Every app, and how it works
10 apps in one workspace: figures, slides, two poster designers, chemical structures, a 3D studio, a protein viewer, graphs with statistics, image analysis, optics and pixel editing. Each one below is shown at work.
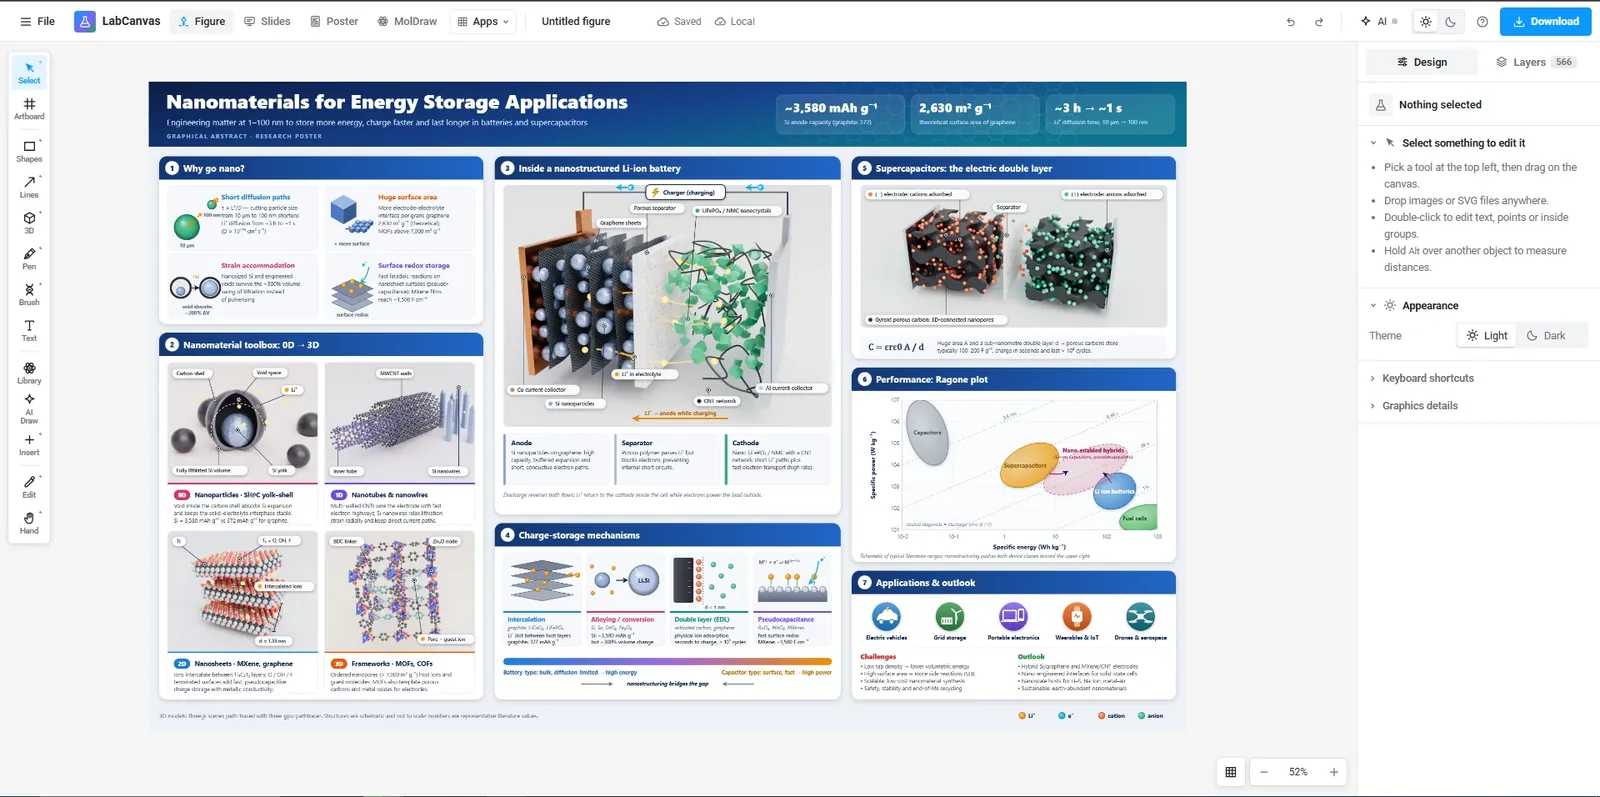
Figure editor
Illustrator-level vector tools made for scientific figures.
- Pen, Pathfinder, gradients and scientific brushes (DNA, membranes, proteins)
- 500+ adjustable science objects, lab glassware and instruments, any molecule from PubChem in 3D, plus LaTeX equations and tables
- TIFF, PDF, SVG and PNG at the DPI and column width your journal asks for
All Figure editor features
- Illustrator-level vector tools
- Pen, pencil and brush with Bézier fitting, direct selection, Pathfinder (union, subtract, intersect, divide…), offset and outline stroke, blends, warps, clipping masks, rulers, guides and smart guides.
- Scientific brushes
- DNA double helix at its real proportions (B, A or Z form), RNA, α-helix and β-strand ribbons, bead chains, actin, lipid bilayers and coils, drawn along any path.
- 500+ adjustable science objects
- Nanoparticles, liposomes, lipid nanoparticles, cells, cancer cells, viruses, antibodies, crystals, 2D materials, hydrogels, MOFs, devices, lab instruments and effects such as fire, bubbles and particles; every detail is a setting.
- Connectable lab glassware
- Over a hundred pieces of chemistry and materials-lab apparatus at real proportions: flasks, condensers, still heads, adapters, funnels, burettes, stands and clamps, hot plates, baths, furnaces, gloveboxes and instruments. Joints snap together and tubing follows the hose barbs, so experimental setups stay assembled.
- Equations and tables
- LaTeX typeset by MathJax into vector outlines (chemistry with mhchem), and editable tables with scientific booktabs styles.
- Icon library
- A shared library of scientific icons, searchable, to click or drag onto the canvas.
- Pixel editing with an edit log
- Levels, curves, false-colour lookup tables, healing and clone stamp for micrographs, with a log of every edit for your methods section.
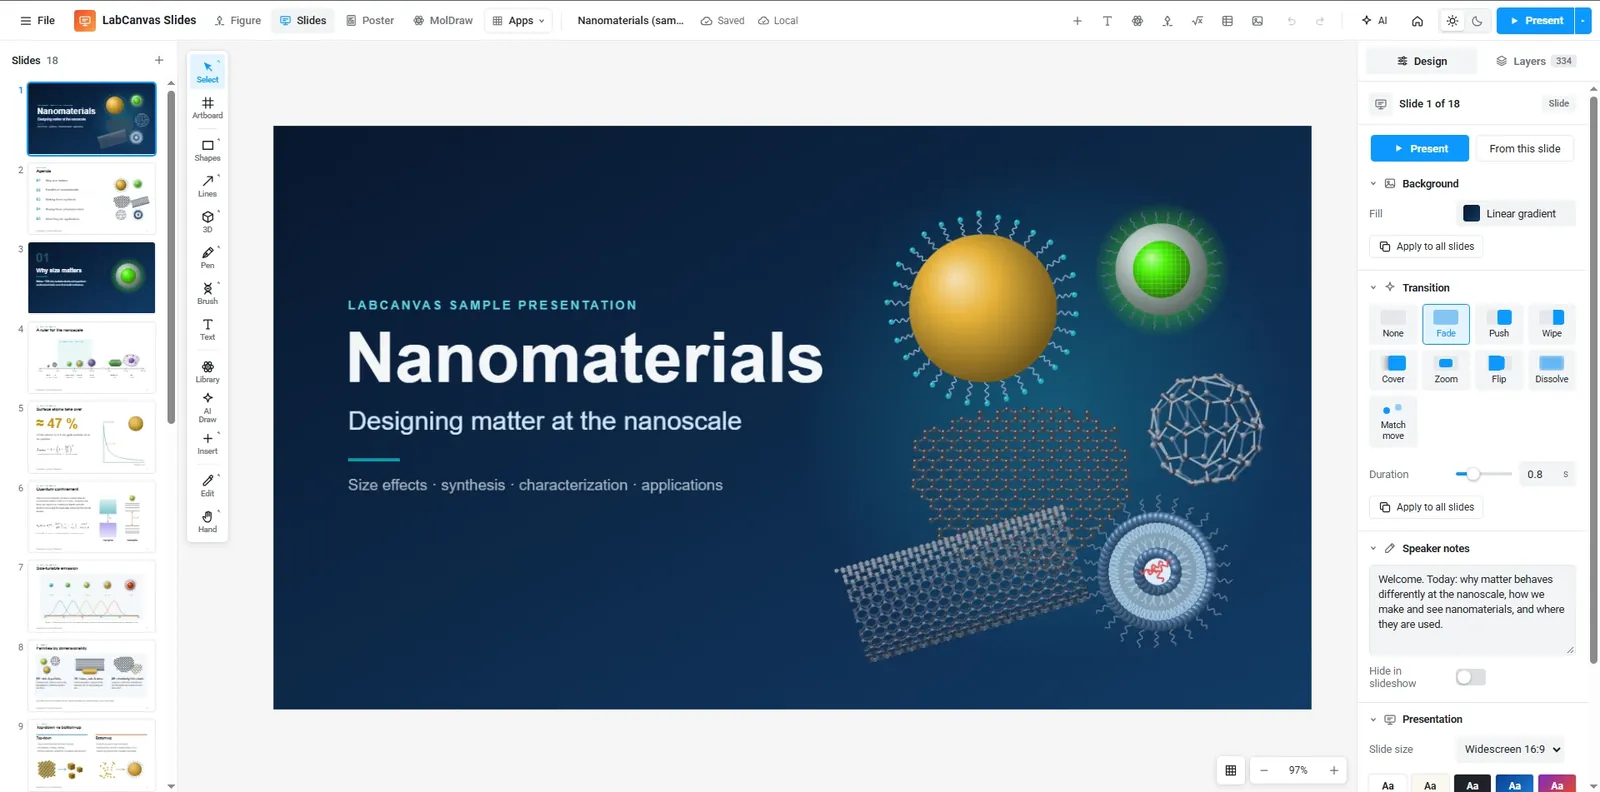
Slides
Presentations built on the same editor, with real vector figures.
- PowerPoint-style slide strip, layouts and themes
- Fade, push, wipe, zoom, flip and more transitions
- Speaker notes, full-screen presenting and one vector PDF
All Slides features
- Presentations from the same editor
- Every tool, object and equation works on slides; layouts, themes and a PowerPoint-style slide strip.
- Transitions and presenting
- Fade, push, wipe, cover, zoom, flip and dissolve; full-screen presenting with speaker notes.
- Vector PDF export
- The whole deck as one vector PDF, or a slide as PNG.
Research Poster
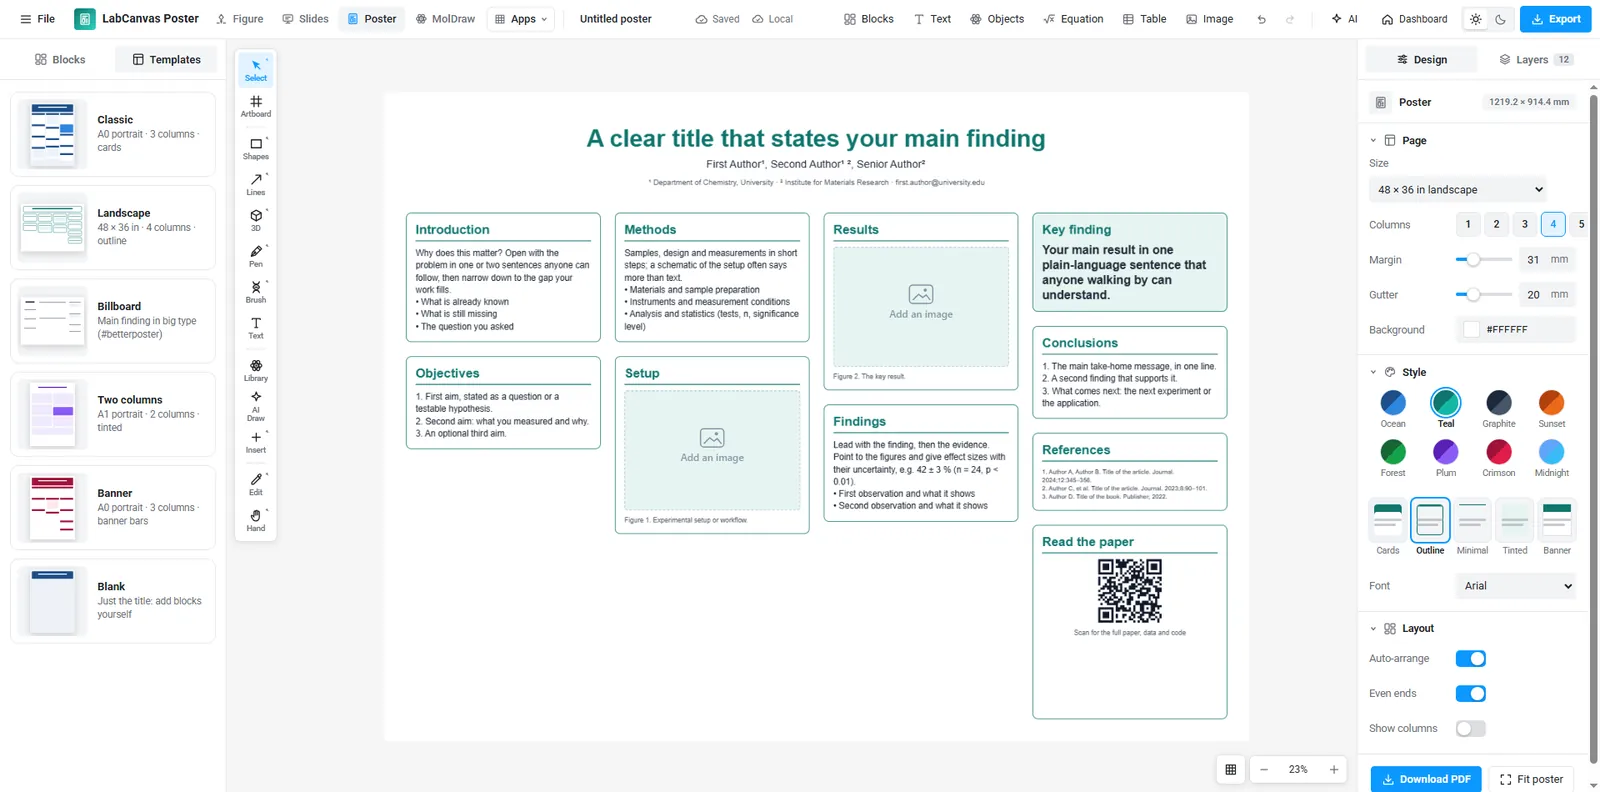
Research posters from blocks that stack in columns and re-flow their text.
- Drag blocks between columns: the poster re-arranges itself; resize and text re-flows
- Title, figure, key finding, big number, references and QR code blocks with themes
- A0, A1 and 48 × 36 in templates, exported as a print-ready vector PDF
MolDraw
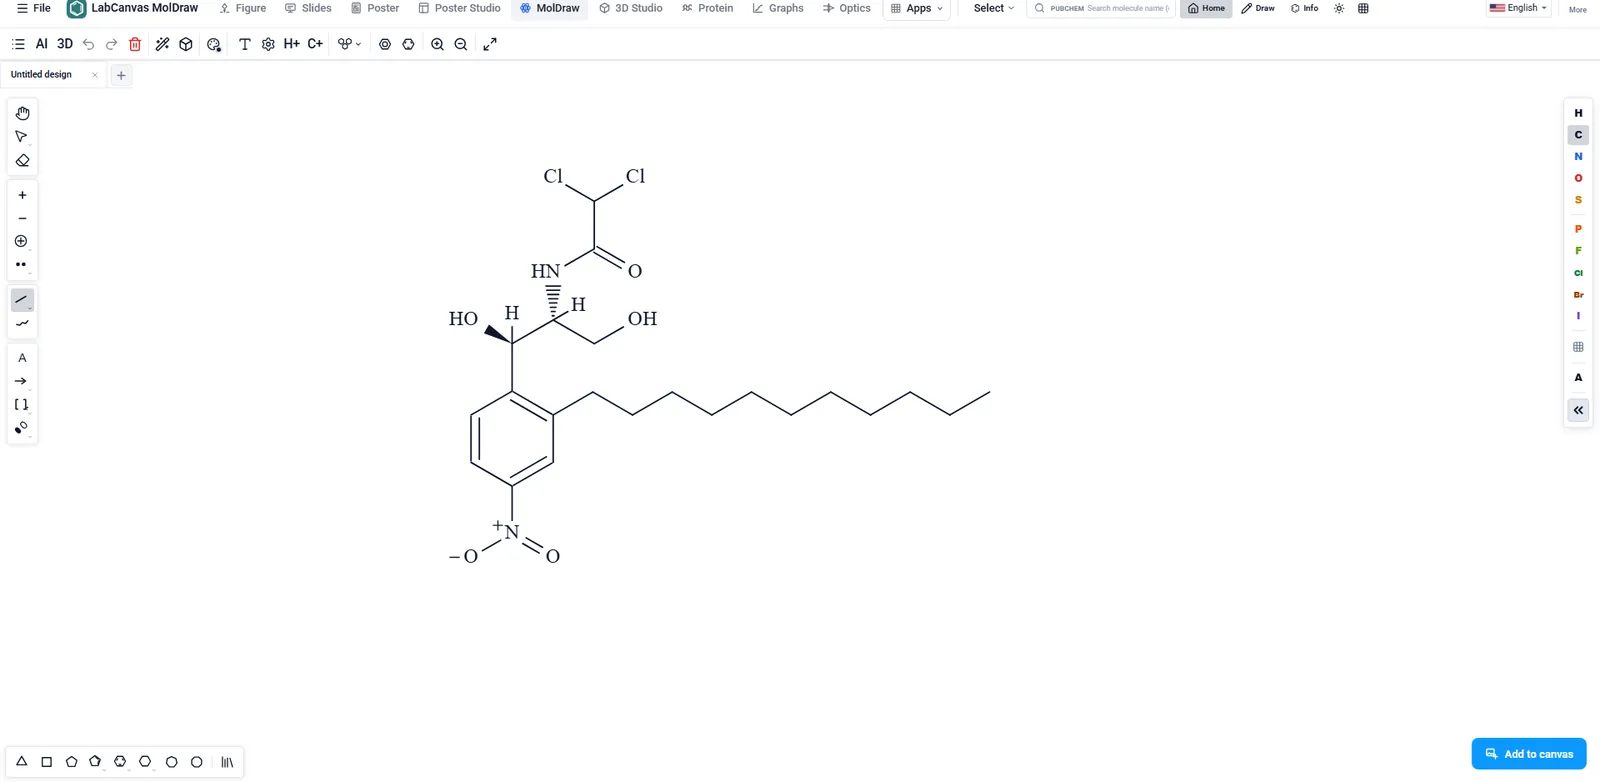
Chemical structures: draw molecules and reactions, then turn them in 3D.
- Atoms, bonds, rings, charges and reaction arrows, with ring and group templates
- Structures from PubChem to start from
- A 3D view of the same molecule
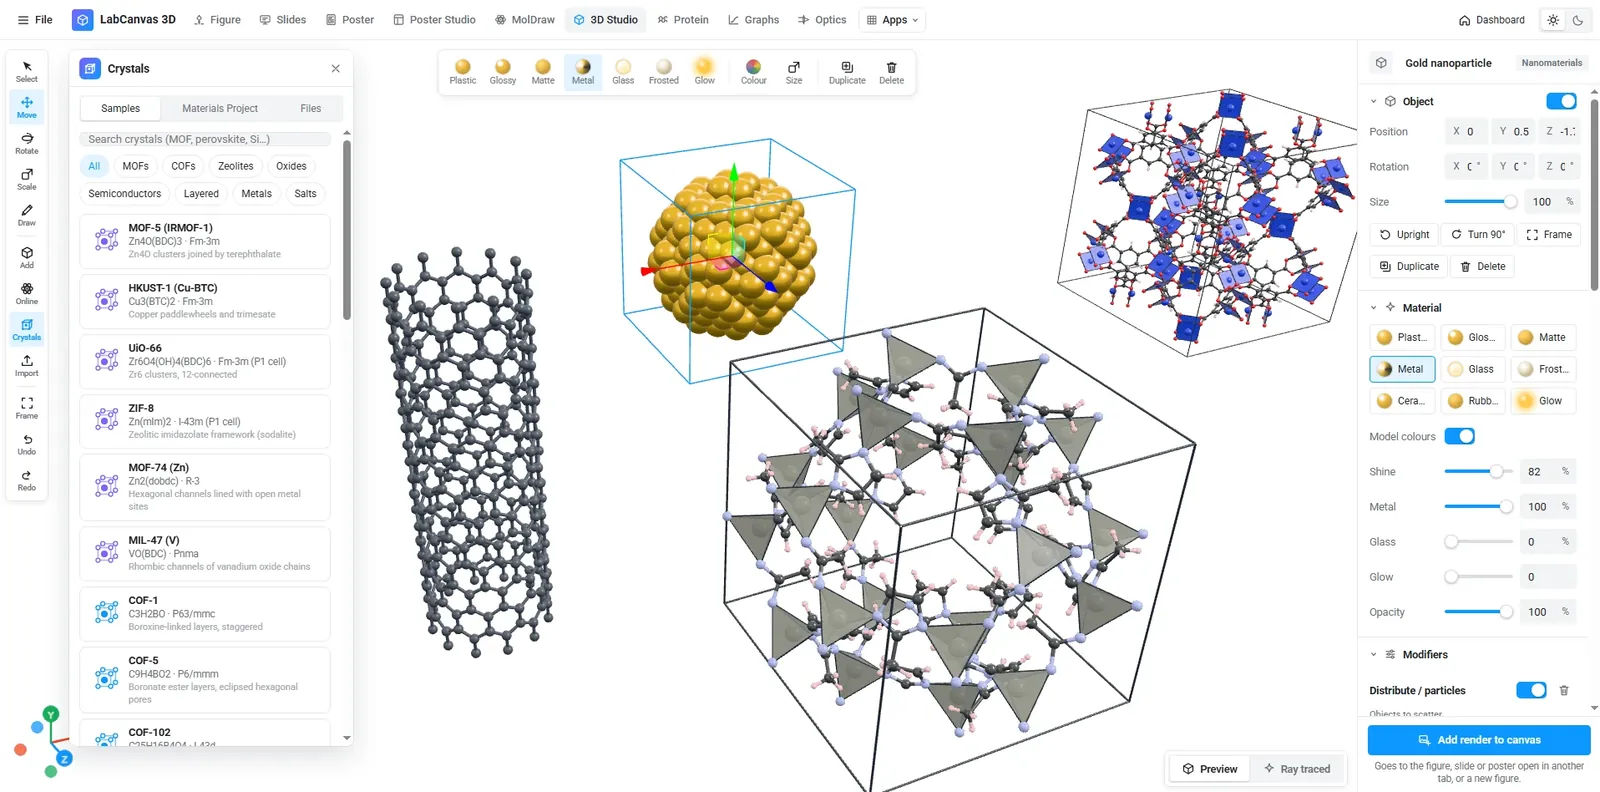
3D Studio
Procedural nanomaterials, devices and molecules with ray-traced renders.
- Nanoparticles, porous scaffolds, MOFs, 2D materials, solar cells, batteries
- Molecules from PubChem and proteins from the RCSB PDB
- Every model has sliders; renders drop straight into your figure
All 3D Studio features
- Adjustable 3D models
- DNA and origami, antibodies, viruses, liposomes and LNPs, tumours, organoids, vessels, atom-by-atom nanoparticles and quantum dots, 2D materials, MOFs, zeolites, scaffolds, devices and shapes.
- Molecules and proteins
- Import compounds from PubChem and structures from the RCSB PDB, or open GLB, OBJ, STL, PLY, FBX, 3MF, PDB, mmCIF, SDF and XYZ files.
- Crystals
- Open CIF and POSCAR files or search the Materials Project; unit cells and supercells as ball-and-stick, space-filling or VESTA-style polyhedra, with ready-made MOFs, COFs, zeolites and classic structures.
- Molecule brushes
- Draw DNA (atoms from PDB 1BNA, or B, A and Z cartoons), RNA, chromatin, α-helices, β-strands, collagen, actin, microtubules and polymer chains to scale along a freehand stroke.
- Modifiers and brushes
- Array, displace, distribute and gradient modifiers; freehand 3D strokes that follow your hand and stay editable curves. Touch: one finger draws, two orbit.
- Ray-traced renders
- GPU path tracing with soft shadows, on white, colour or transparent backgrounds; PNG up to 4× or GLB.
Protein viewer
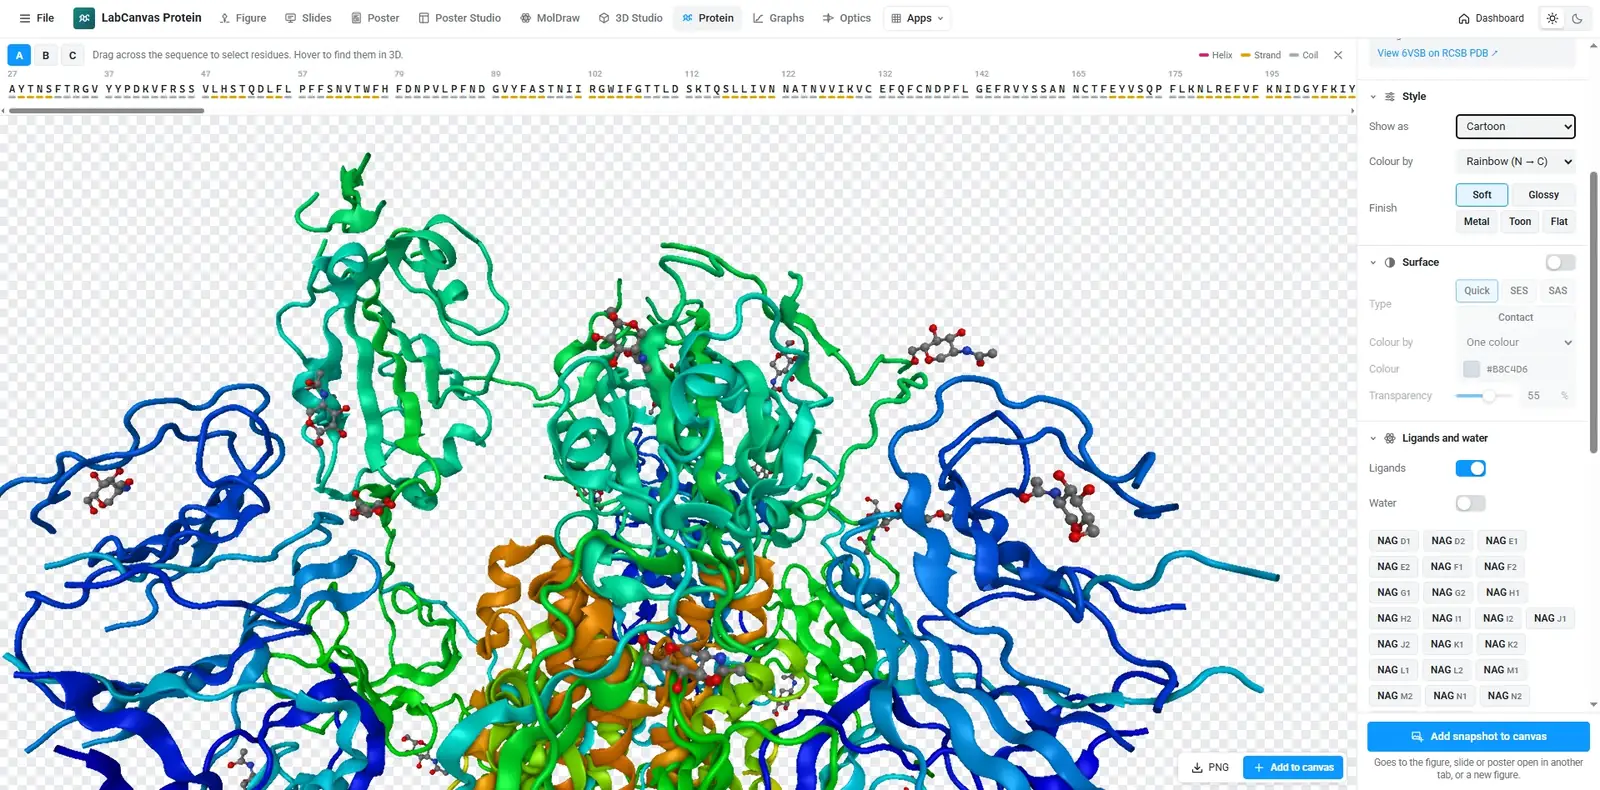
A fast, focused viewer for PDB structures, powered by Miew.
- Load any PDB ID or your own PDB / mmCIF file
- Select residues on the sequence and restyle them
- Cartoon, surfaces, ball-and-stick; transparent PNG snapshots
All Protein viewer features
- Any PDB entry
- Load by ID or file; cartoon, surfaces, ball-and-stick and more, coloured by chain, secondary structure, element, hydrophobicity or B-factor.
- Select on the sequence
- Select residues on the sequence bar and give them their own style; transparent PNG snapshots straight into a figure.
Graphs & statistics
Prism-style data tables, graphs and statistics.
- Column, XY, grouped, survival and contingency tables
- t tests, ANOVA with post-hoc tests, curve fits, log-rank
- Results checked against SciPy and statsmodels
All Graphs & statistics features
- Prism-style projects
- Data tables, results and graphs in a navigator; 37 graph presets from bar and box plots to Kaplan–Meier, volcano, Bland–Altman and ROC.
- Statistics you can check
- t tests, ANOVA with post-hoc tests, nonparametric tests, regression, curve fits, survival and contingency tests, validated in more than 42,000 automated checks against SciPy, statsmodels, lifelines and R.
- Linked into figures
- Graphs go into figures as editable vectors that update when the data change.
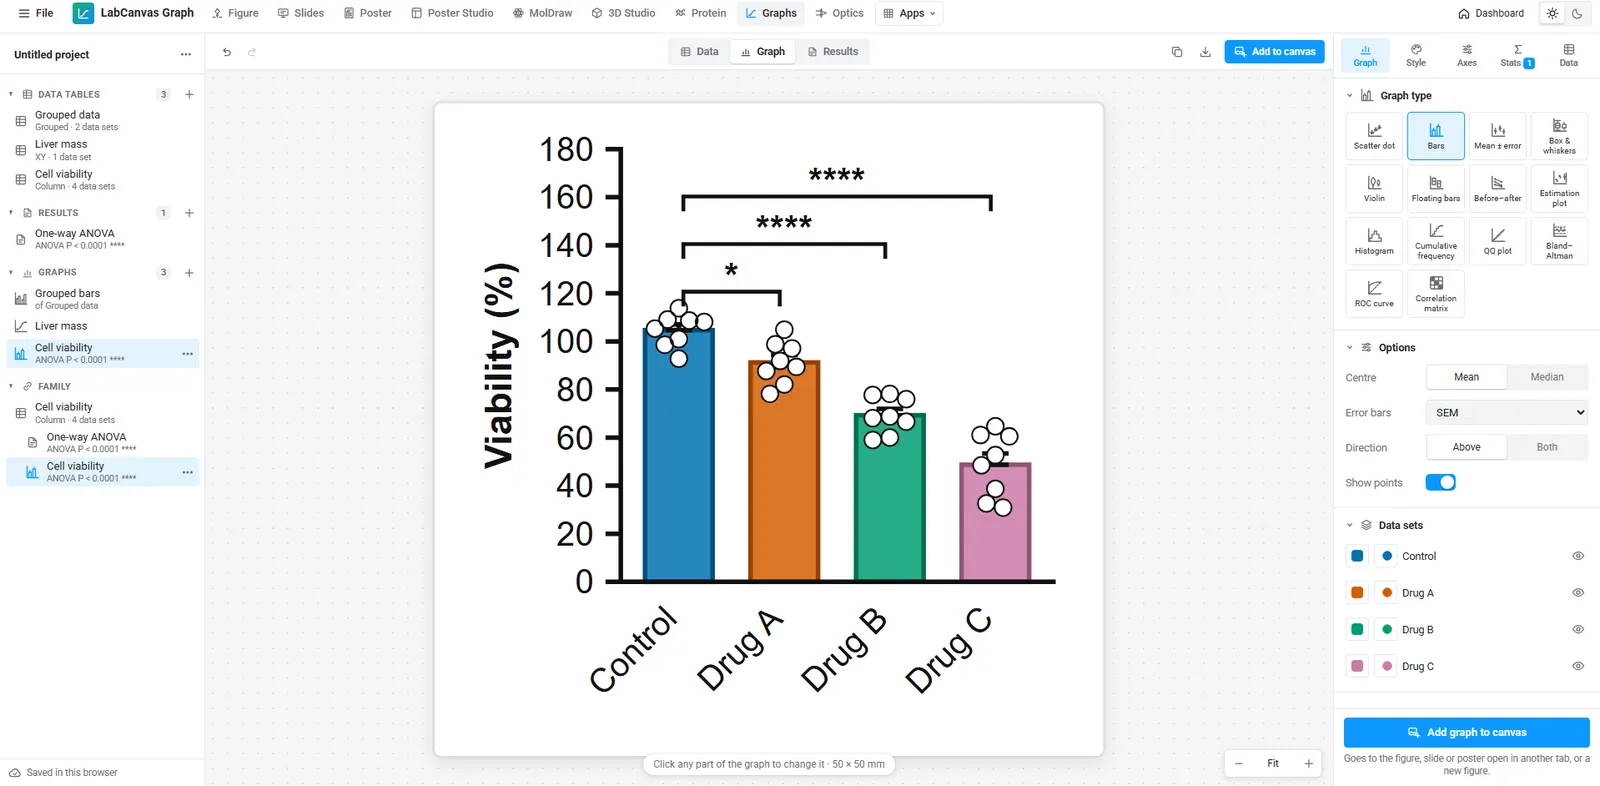
Image Analysis
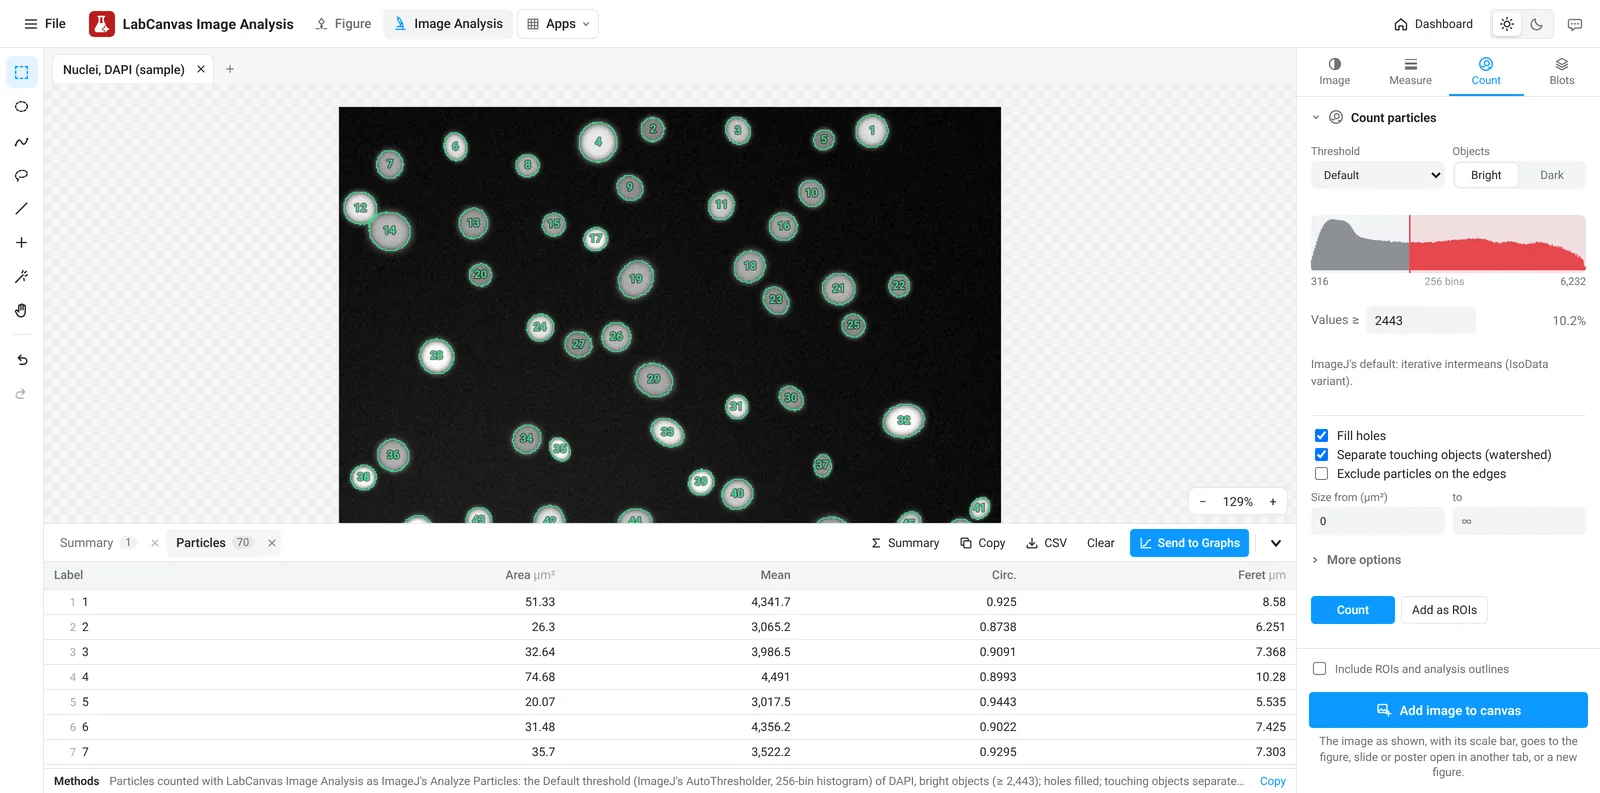
Measure microscope images, western blots and gels on their raw values, with guided assays.
- Guided assays: nuclear translocation, spots per cell, wound healing, FRAP, calcium, tracking, branching
- Blots with a molecular-weight ladder, counting by threshold or a classifier trained with a few brush strokes
- ImageJ definitions, checked in more than 4,000 tests against scikit-image and SciPy; results go to Graphs
All Image Analysis features
- Raw values, ImageJ definitions
- 8-, 16- and 32-bit images, TIFF stacks, OME-TIFF and BigTIFF with their scale. Areas, intensities and shapes follow ImageJ’s definitions, checked in more than 4,000 automated tests against scikit-image, SciPy and images with known answers.
- Guided assays
- Nuclear vs cytoplasmic signal, spots per cell, colonies, wound healing, FRAP, calcium ΔF/F₀, tracking, kymographs, branching, Sholl analysis and tube formation, step by step with good defaults, saved as workflows and run on many files.
- Blots, counting and segmentation
- Western blot densitometry with a molecular-weight ladder, total-protein normalisation and smiling-lane correction; counting by threshold and watershed, by spots, with a cell counter, or with a pixel classifier trained by a few brush strokes.
- Processing that keeps the data honest
- Background subtraction, filters, CLAHE, denoising, binary tools, an image calculator with ratio images, drift correction, stain separation (H-DAB, H&E) and an image check that warns about clipped, uneven or lossy data.
- Into Graphs and figures
- Results tables go to Graphs with a methods sentence; each channel and the merge go to a figure, side by side, ready for a layout; ImageJ ROI sets and whole projects open and save.
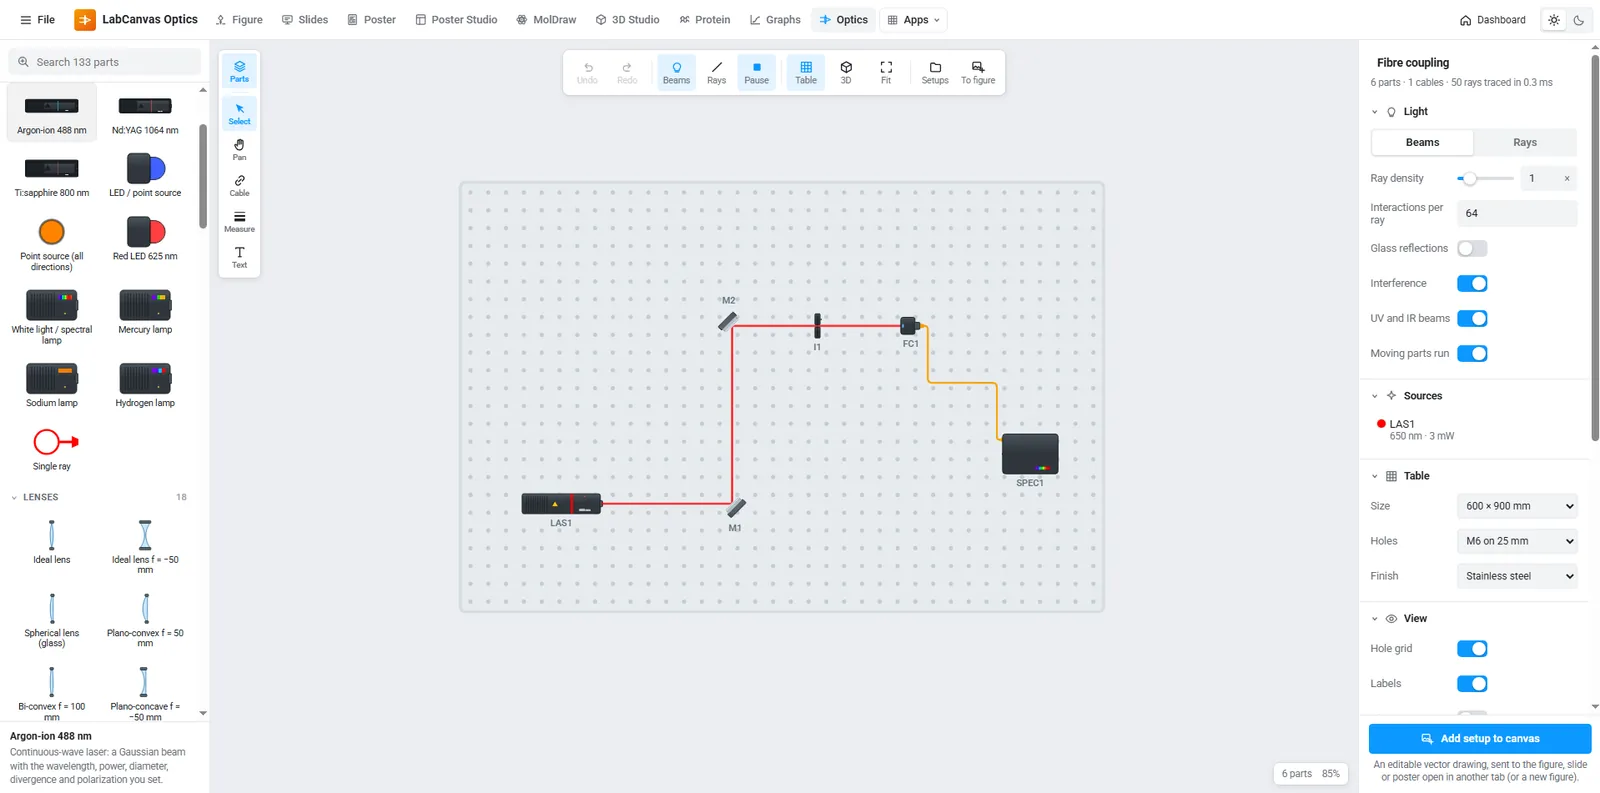
Optics
Optical setups on a breadboard, with the beam path simulated live.
- Lasers and lamps, lenses, mirrors, prisms, gratings, beam splitters and detectors
- Rays traced live as you move parts on the breadboard
- Clean schematics to export into a figure
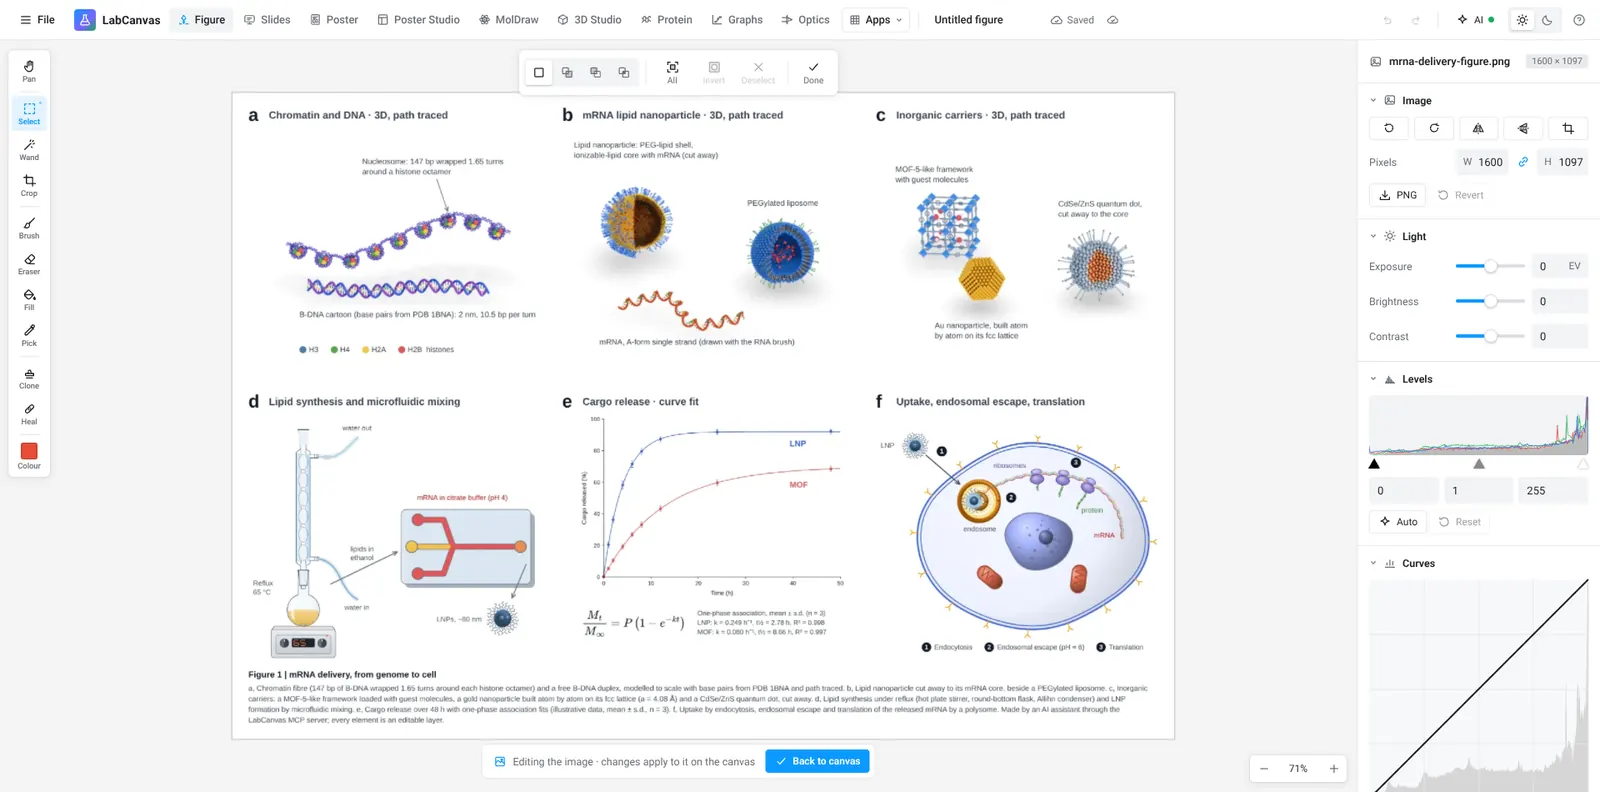
Pixel editor
Microscopy and photo touch-ups without leaving your figure.
- Crop, levels, exposure and false-colour lookup tables
- Healing, clone stamp, selections and masks
- Edits flow back into the figure layer
Across every app
Shared by all of them: one account, one cloud, one clipboard, one export dialog.
Journal-ready export
Set the width in millimetres and the resolution (300, 600 or 1200 dpi) and export TIFF, PDF, SVG, PNG, JPEG or WebP. Files carry their DPI, so the size is right when the journal opens them.
500+ science objects
Liposomes, cancer cells, viruses, nanoparticles, crystals, hydrogels, devices and lab instruments: drawn by generators, so every detail is a setting.
LaTeX and tables
Equations typeset by MathJax into vector outlines, and editable tables with scientific (booktabs) styles.
Lab glassware that connects
Flasks, condensers, still heads, adapters, funnels, burettes, stands, hot plates, furnaces and gloveboxes at real proportions. Pieces snap onto each other’s joints and tubing follows them, so a distillation setup stays assembled as you move it.
Molecules and proteins
Import compounds from PubChem and structures from the RCSB PDB; show them as cartoons, surfaces or ball-and-stick.
Statistics you can check
Prism-style analyses whose results are validated against SciPy, statsmodels, lifelines and R in more than 42,000 automated checks.
Posters that arrange themselves
Drag a block between two others or into another column and the poster re-stacks; resize it and the text re-flows. A0 and 48 × 36 in templates, themes, QR codes and a print-ready vector PDF.
Private by default
Designs autosave in your browser and, if you choose, to your own private cloud folder so you can open them on any computer. Nothing is public, and nobody else can open your work.
Start making better figures
Every app is free to start in your browser. LabCanvas Pro adds downloads, unlimited designs and the AI assistant.
Start free See pricing