Guides for better scientific visuals
Figures, presentations, structures and data, from the LabCanvas team. RSS feed
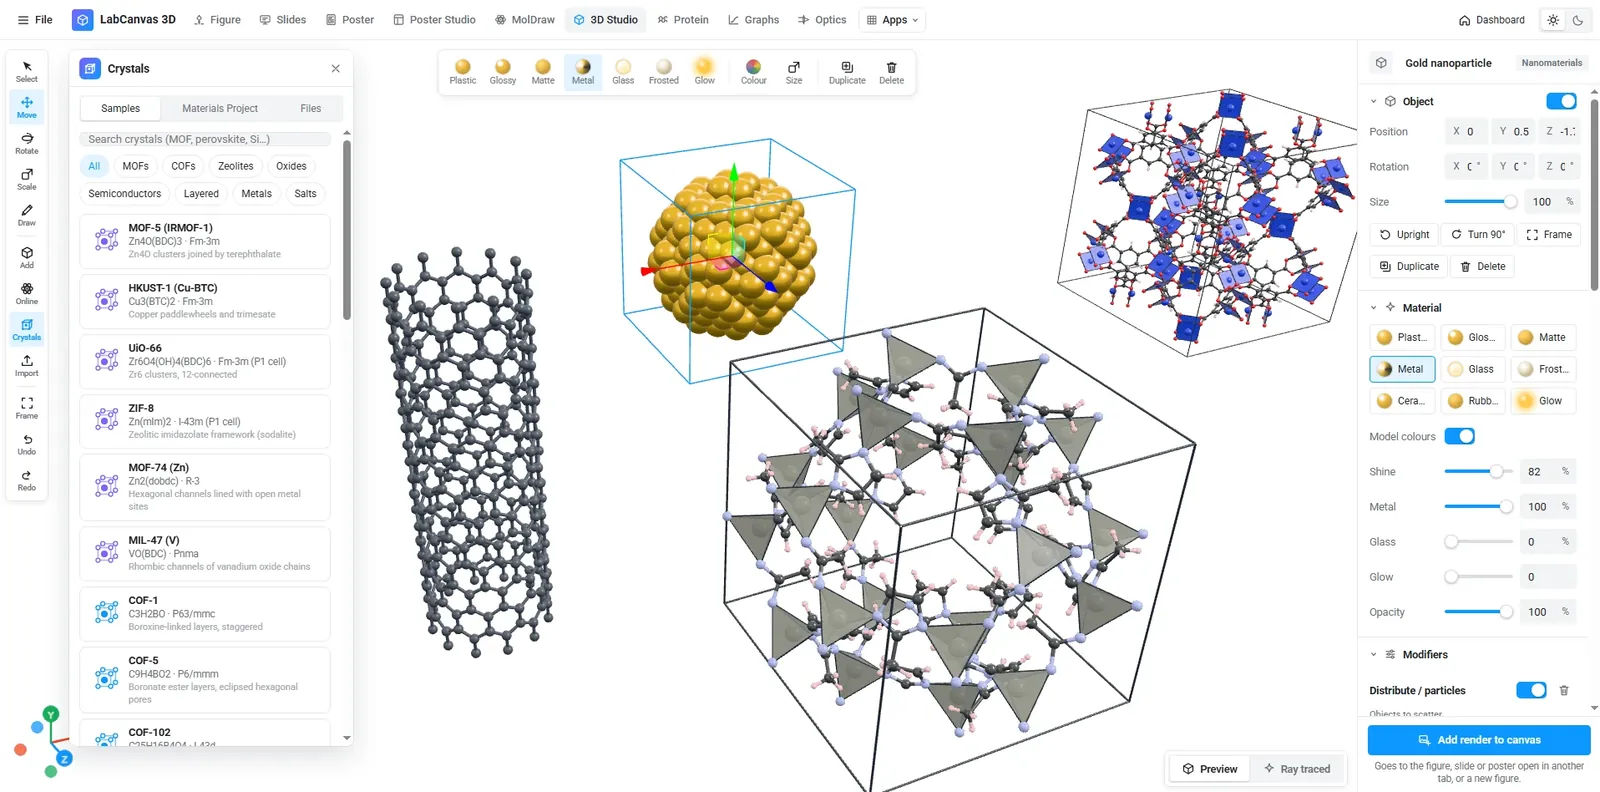
Crystal structure and 2D-material figures: VESTA, Mercury, CrystalMaker, Avogadro, OVITO and LabCanvas compared
Which tool for crystal structure and 2D-material figures? VESTA, CrystalMaker, Mercury, Avogadro, Jmol, OVITO, the Materials Project viewer and LabCanvas compared: licence, platforms, file formats, rendering and how to cite each.
Read the guideImage analysis how-tos

ImageJ vs LabCanvas Image Analysis: an honest comparison
ImageJ/Fiji or LabCanvas Image Analysis? Six everyday jobs done in both, six newer ones (macros, vendor files, 3D, StarDist, big images) and which to use.

How to use ImageJ: a beginner's tutorial for the 10 everyday jobs (2026)
How to use ImageJ and Fiji: get started, open an image, then 10 everyday jobs (scale, measure, threshold, count, background, blots) with exact menu paths.

How to set the scale and add a scale bar in ImageJ (with a calibration image to practise on)
Set the scale in ImageJ (Analyze › Set Scale) from a micrometer, scale bar or pixel size, add a scale bar, and practise on a free calibration image.
The apps, one guide each
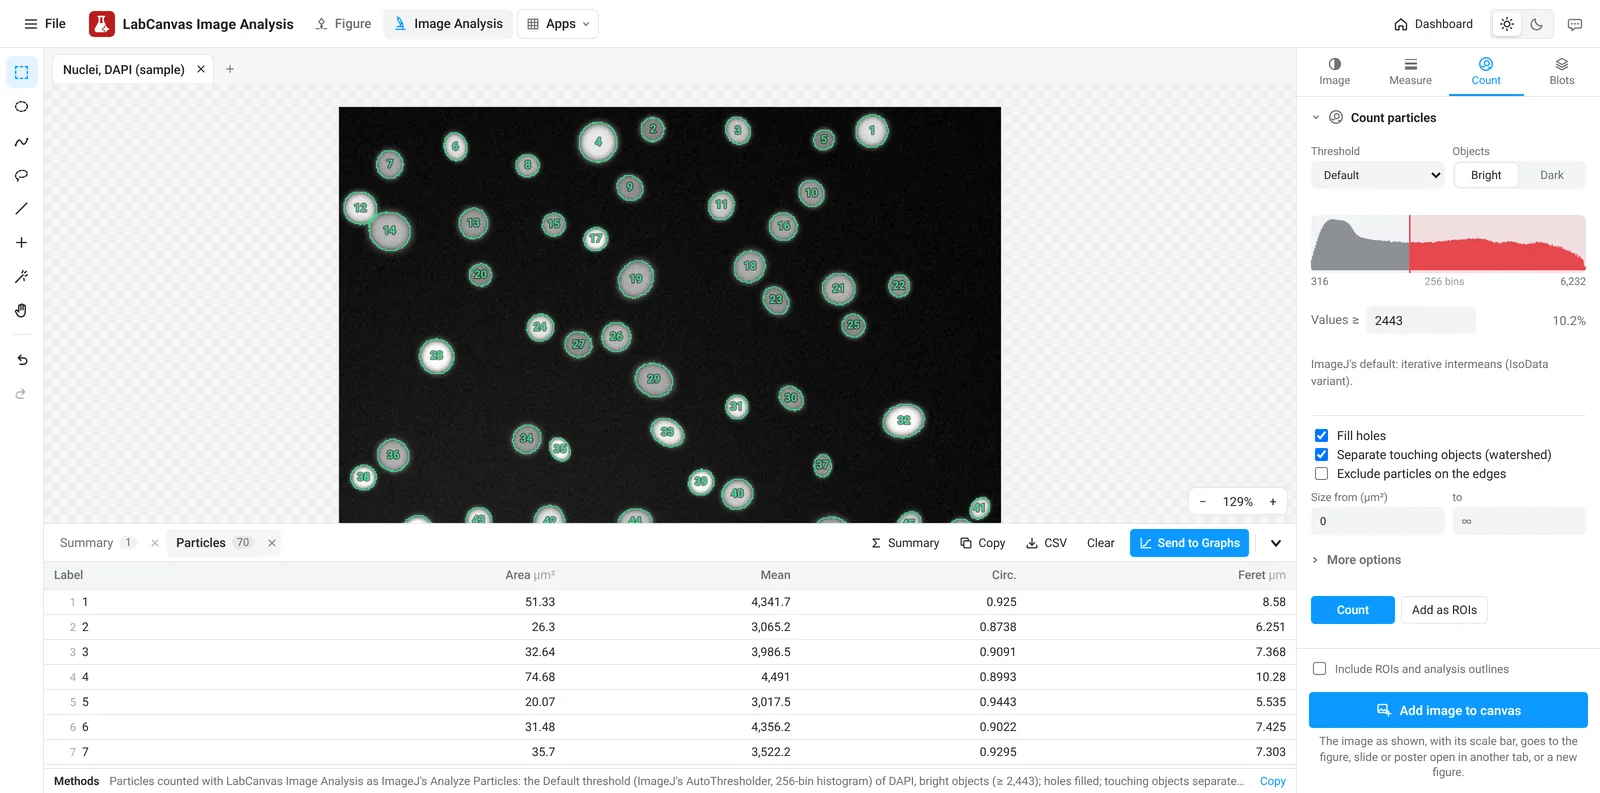
LabCanvas Image Analysis: measure microscopy images, western blots and gels in your browser
How to measure images in LabCanvas Image Analysis: guided assays (nuclear translocation, spots per cell, wound healing, FRAP, calcium, tracking, branching), western blots with a ladder and total-protein normalisation, cell counting with a trainable classifier, ROIs with ImageJ definitions, on the raw pixel values, with results sent to Graphs.
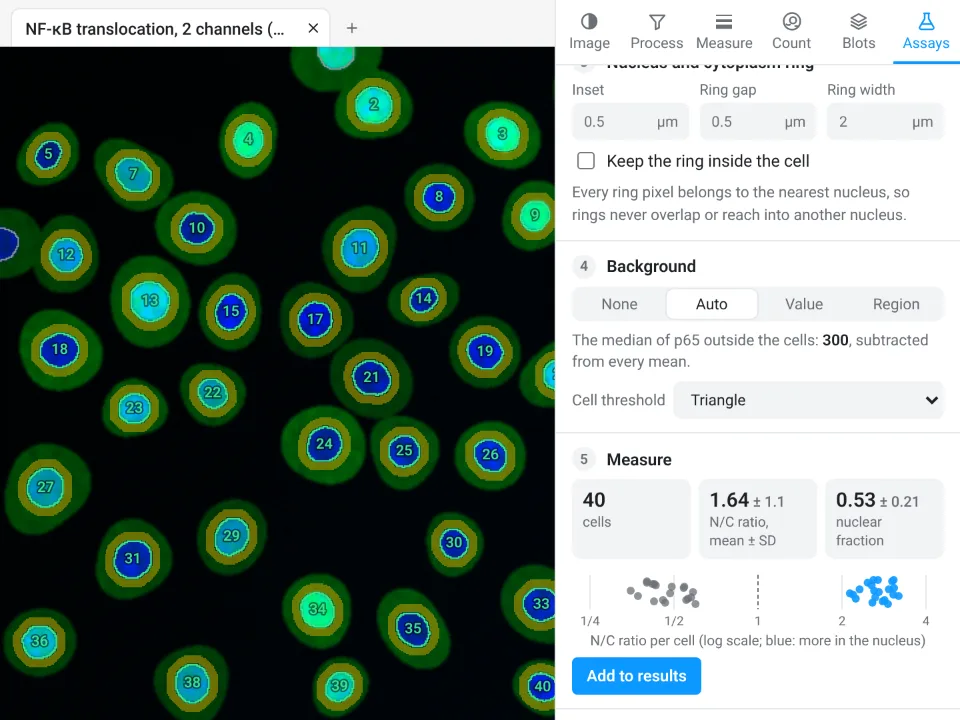
Image Analysis in LabCanvas: a complete guide to every tool and setting, with examples
Every tool in LabCanvas Image Analysis, tab by tab, with its settings and a real example: image check, display and scale, stacks and Z projection, background subtraction, filters, thresholds and binary operations, ROIs and Set measurements, Analyze Particles, a pixel classifier, spots, cell counter, western blot densitometry, colocalisation, colour deconvolution and eleven guided assays.
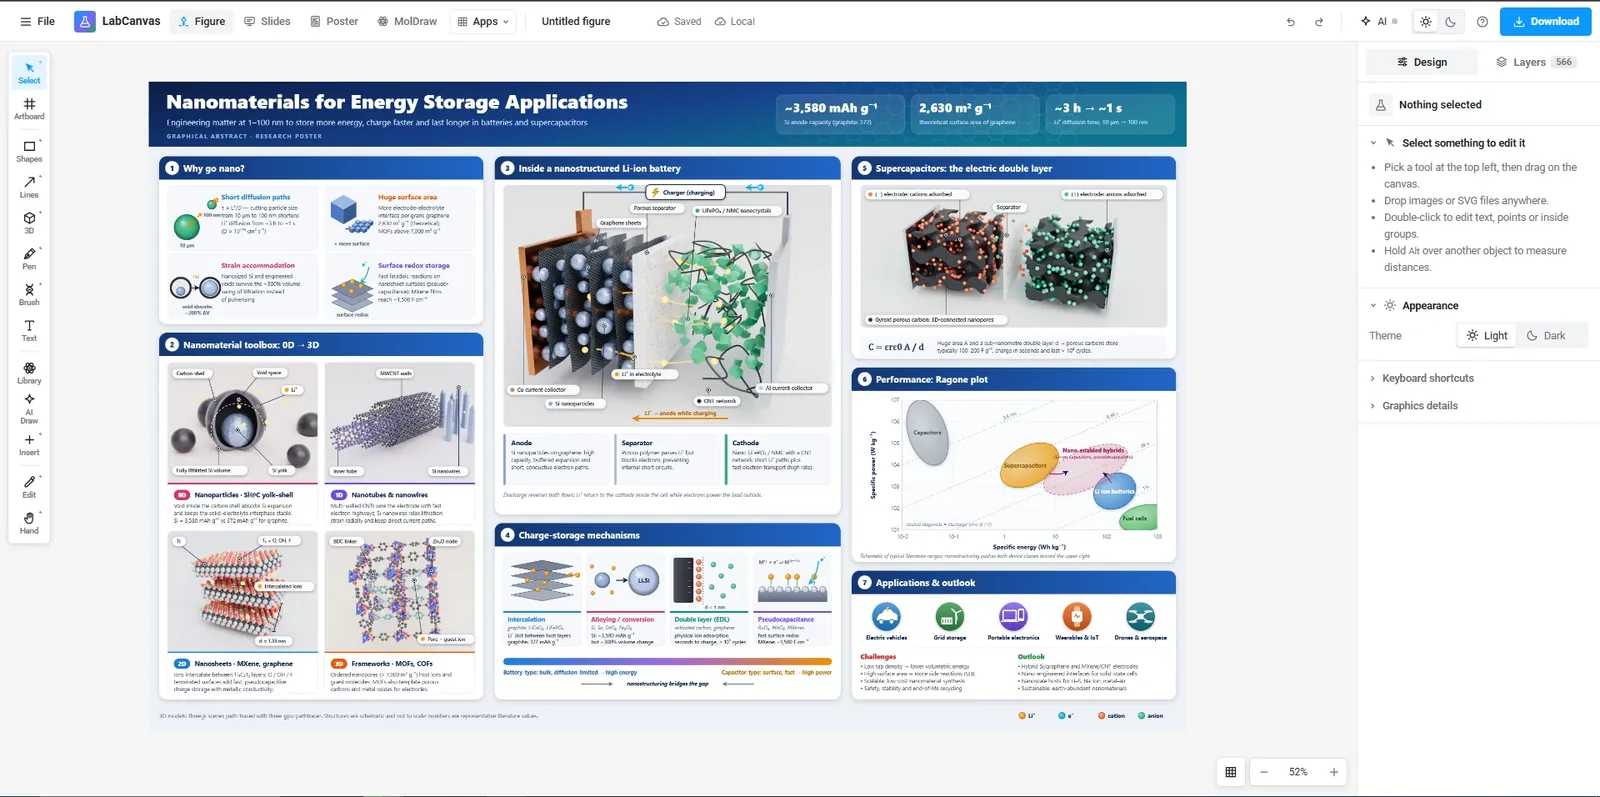
The LabCanvas Figure editor: vector scientific illustration in your browser
How to make journal figures and graphical abstracts in the LabCanvas Figure editor: vector tools, 700+ adjustable science objects, lab glassware that connects, LaTeX equations, and export at the width and DPI your journal asks for.
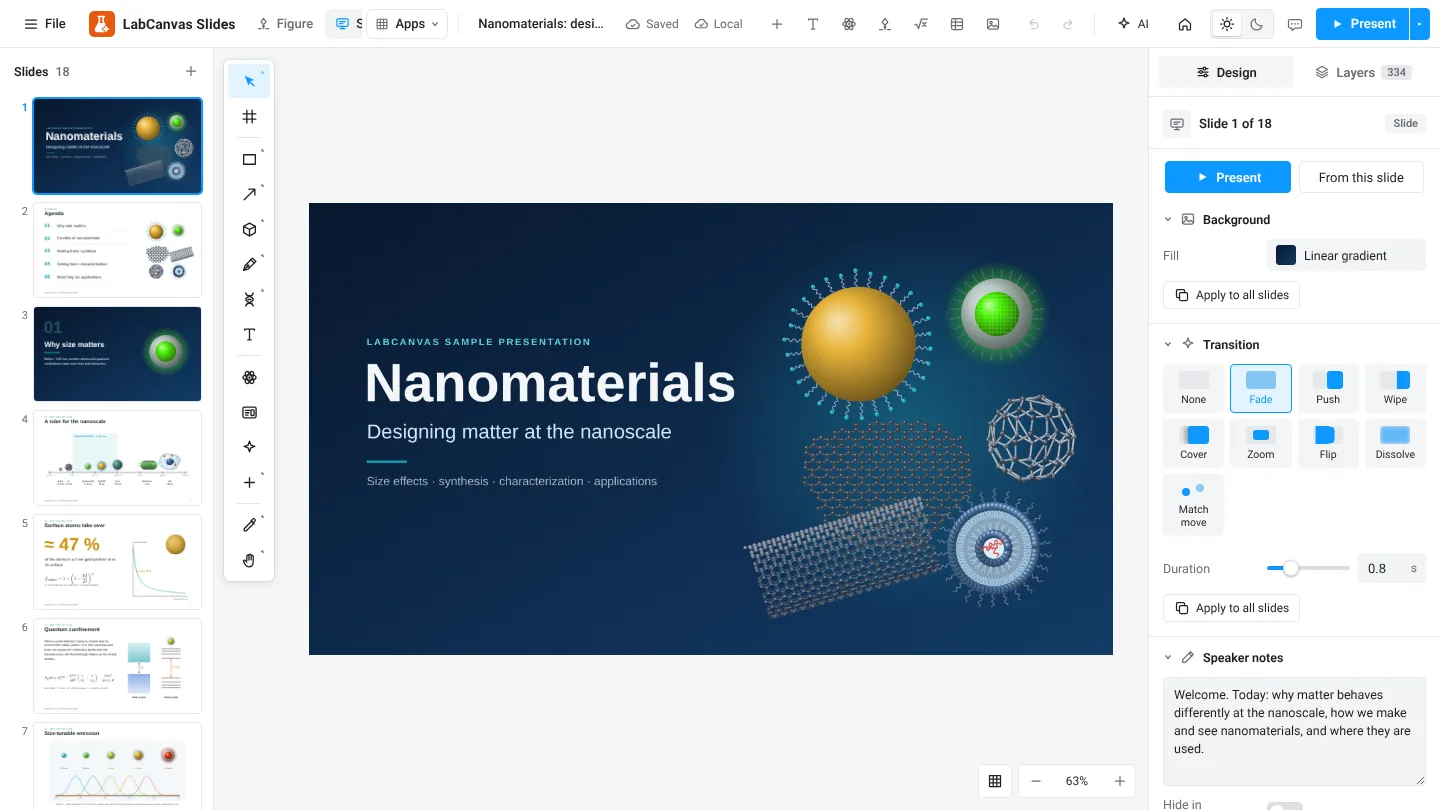
LabCanvas Slides: scientific presentations built from editable figures
How to build lab meetings, conference talks and lectures in LabCanvas Slides: a slide strip, layouts and themes, transitions and motion paths, speaker notes, full-screen presenting and a vector PDF of the deck.
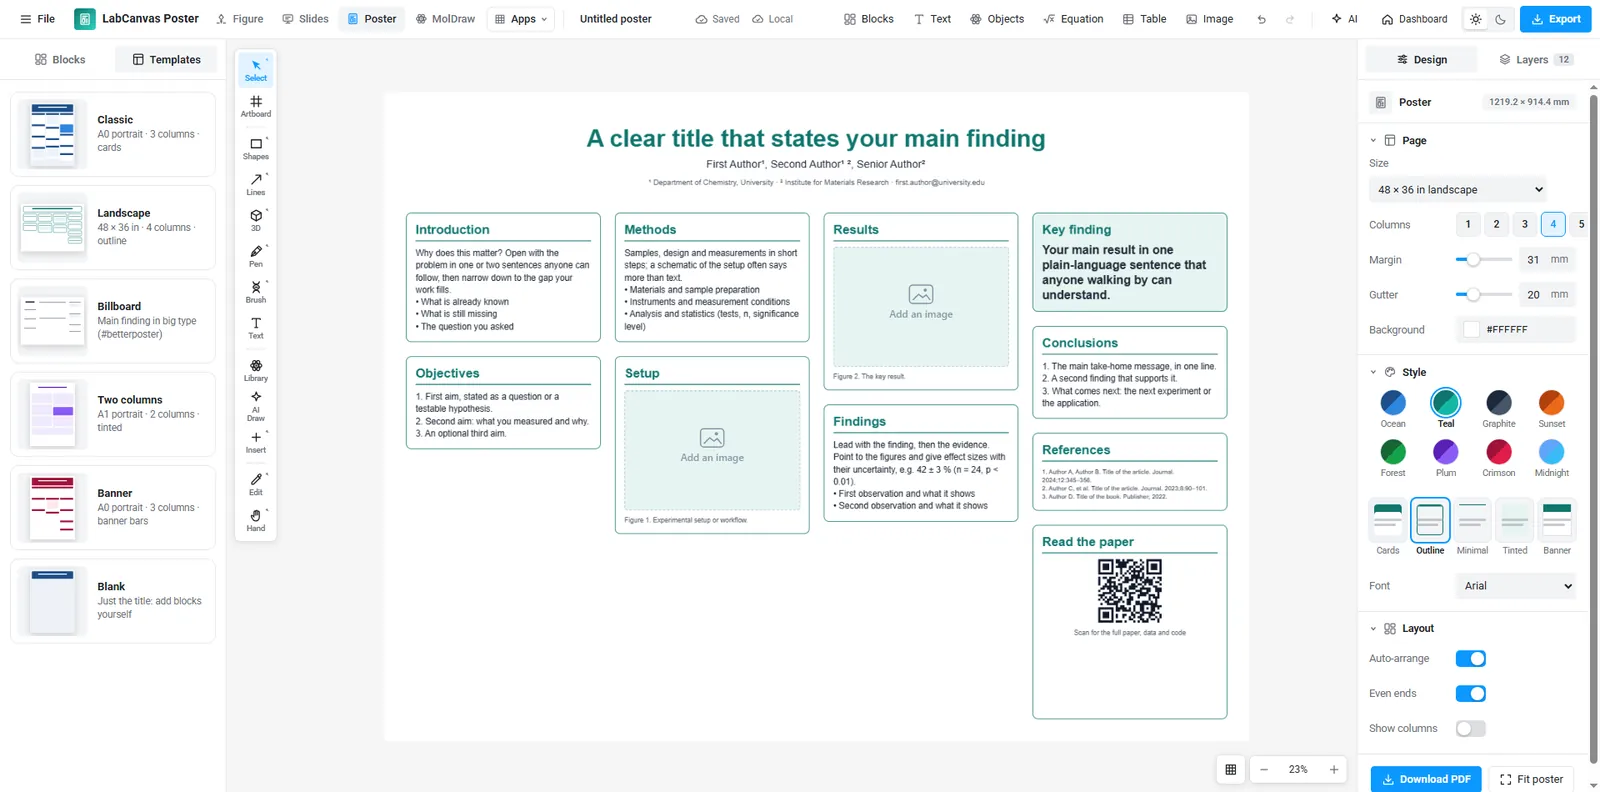
LabCanvas Research Poster: conference posters that arrange themselves
How to make an A0, A1 or 48 × 36 in research poster in LabCanvas Research Poster: blocks that stack in columns and re-flow their text, themes and block styles, QR codes, and a print-ready vector PDF.
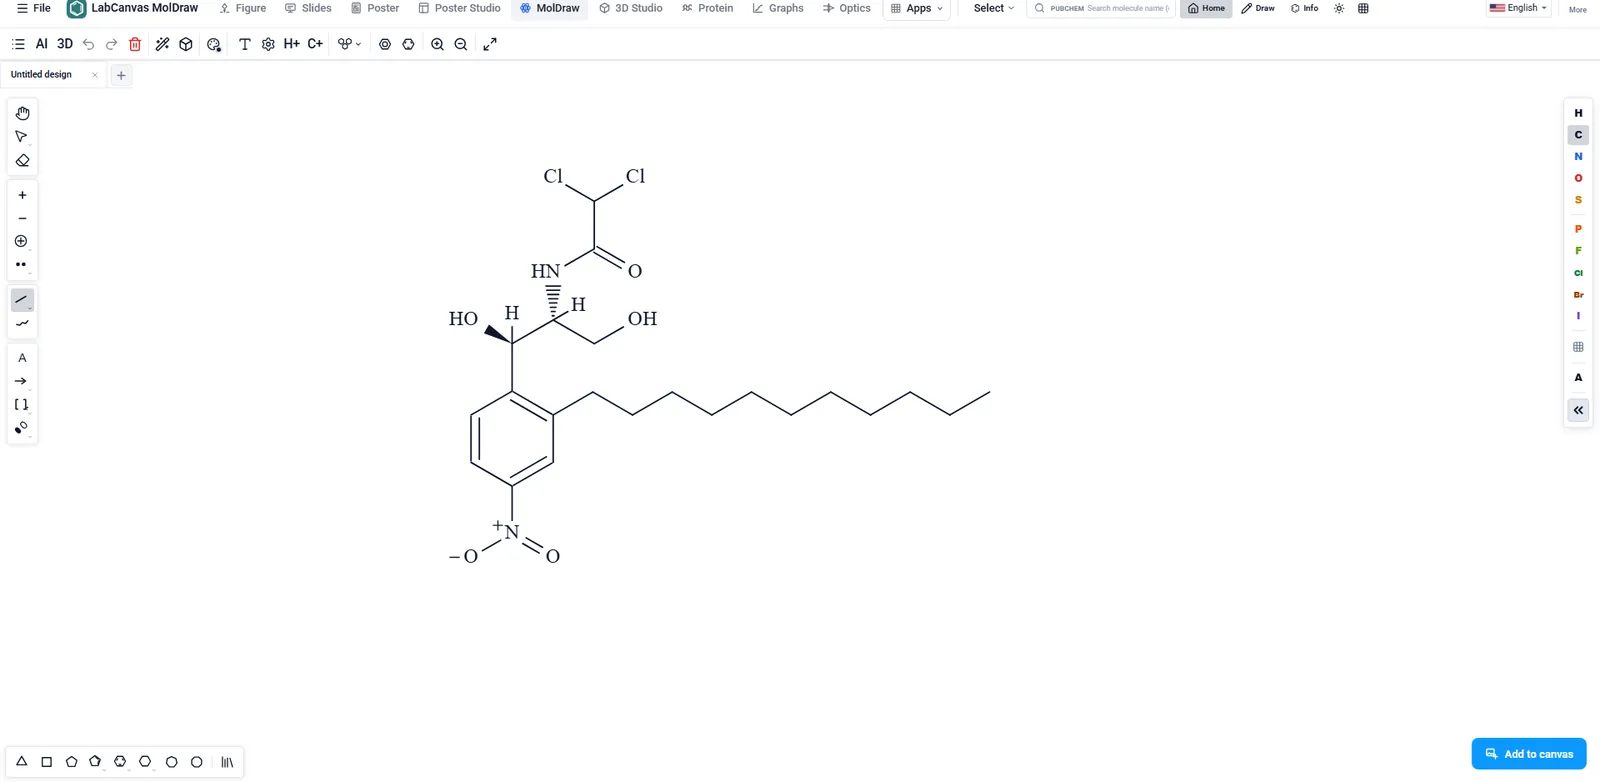
MolDraw online: free chemical structure drawing in your browser
Draw molecules and reaction schemes online, free, with nothing to install. LabCanvas MolDraw: atoms, bonds, rings and charges, reaction arrows, structures from PubChem, SMILES, a 3D view of the same molecule, and placing structures in figures.
The LabCanvas 3D Studio: adjustable 3D models of cells, nanomaterials and devices
How to make 3D scientific renders in the LabCanvas 3D Studio: adjustable models of cells, viruses, nanoparticles, 2D materials, MOFs and devices, molecules from PubChem, proteins from the PDB, crystals from CIF files, and renders placed in figures.
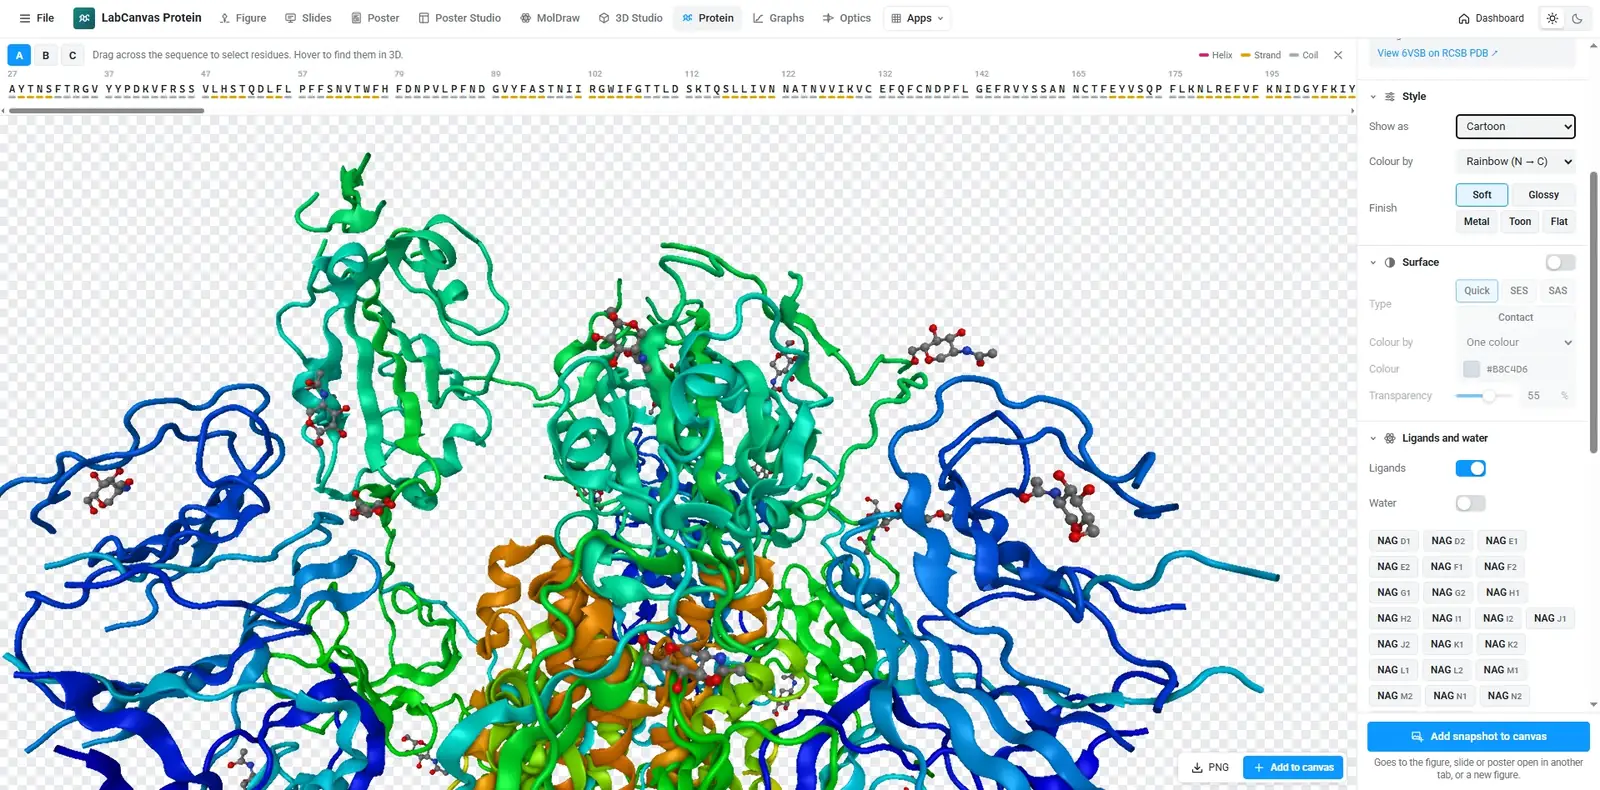
The LabCanvas Protein viewer: PDB structures styled for figures
How to show a protein structure in the LabCanvas Protein viewer: load any PDB ID or your own PDB and mmCIF file, choose cartoon, surface or ball-and-stick, colour by chain or secondary structure, select residues on the sequence and snapshot a transparent PNG for your figure.
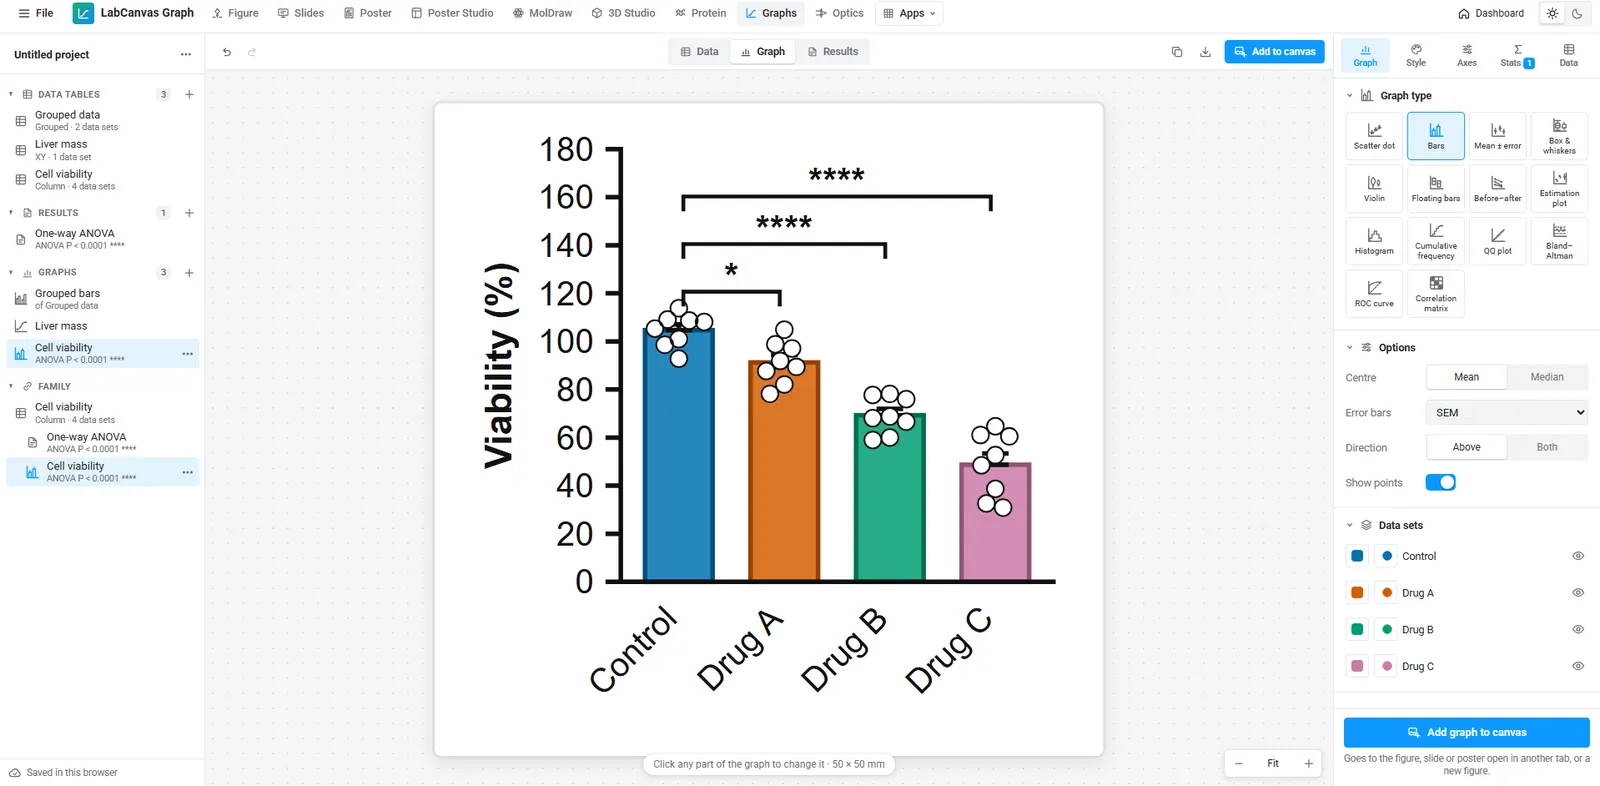
LabCanvas Graphs & statistics: 70 scientific graph types with checked statistics
A visual guide to LabCanvas Graphs & statistics: Prism-style data tables, 70 graph types from scatter dot plots to Kaplan–Meier, volcano and PAE plots, t tests, ANOVA, curve fits and survival tests checked against SciPy, and graphs that stay linked to their figure.
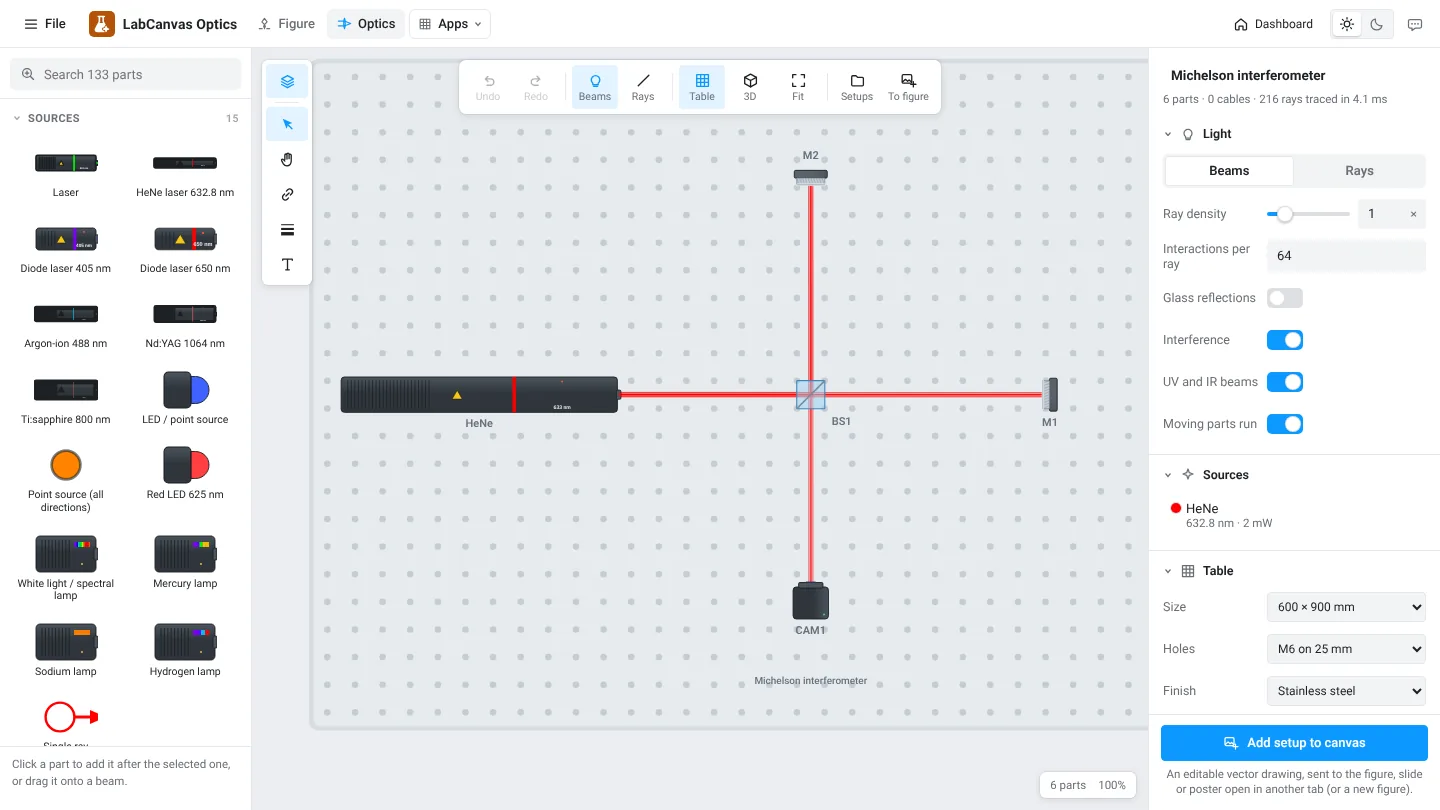
LabCanvas Optics: draw optical setups with the beam path simulated live
How to build optical setup diagrams in LabCanvas Optics: lasers, lenses, mirrors, beam splitters, gratings and detectors on a breadboard, rays and beams traced as you move parts, interference, ready-made setups and clean schematics for figures.
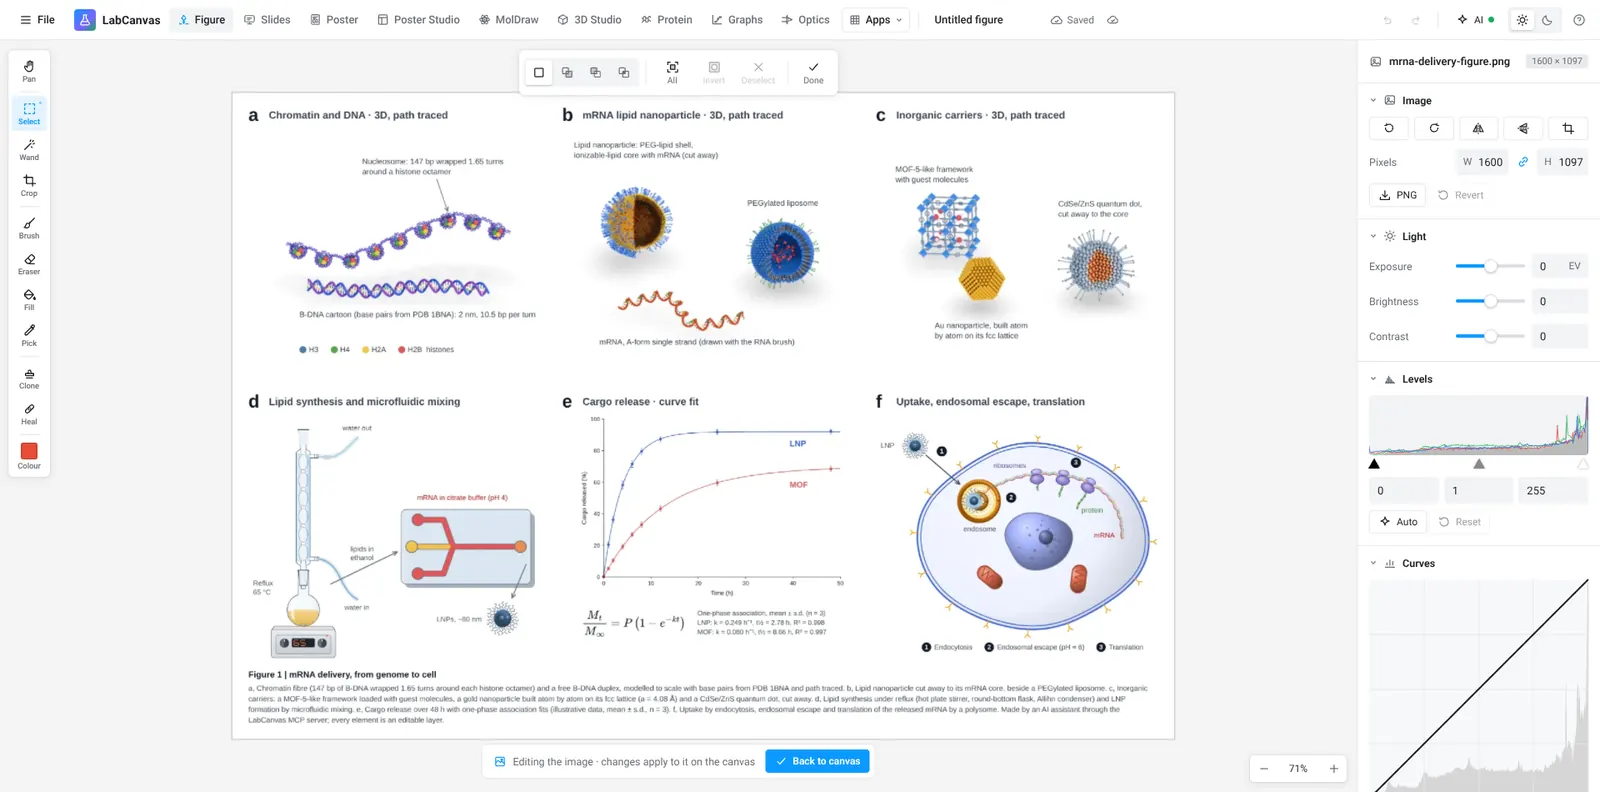
The LabCanvas Pixel editor: edit micrographs and photos inside your figure
How to adjust microscopy images and photos in the LabCanvas Pixel editor: crop, levels, curves and exposure, false-colour lookup tables, healing and clone stamp, selections and masks, with an edit log for your methods section.
More guides
Free tools for scientific figures in 2026: BioRender, Inkscape, Affinity, Canva, PowerPoint and more
An honest comparison of tools for scientific figures: BioRender, Mind the Graph, Inkscape, Affinity, Canva, PowerPoint, Adobe Illustrator and LabCanvas. What each free plan includes, publication rights, file formats and who each one suits.
Journal figure size guide: column widths, DPI and fonts for 38 journals
Figure requirements for 38 journals in one table: single, 1.5 and double column widths in mm, maximum height, DPI for photos and line art, fonts and file types, each linked to the journal’s author guidelines.
A free GraphPad Prism alternative: graphs and statistics in your browser
Looking for a free GraphPad Prism alternative? What LabCanvas Graphs does (data tables, t tests, ANOVA, curve fits, survival, cluster analysis, 70 graph types checked against SciPy), what it does not, and when Prism is still the better choice.
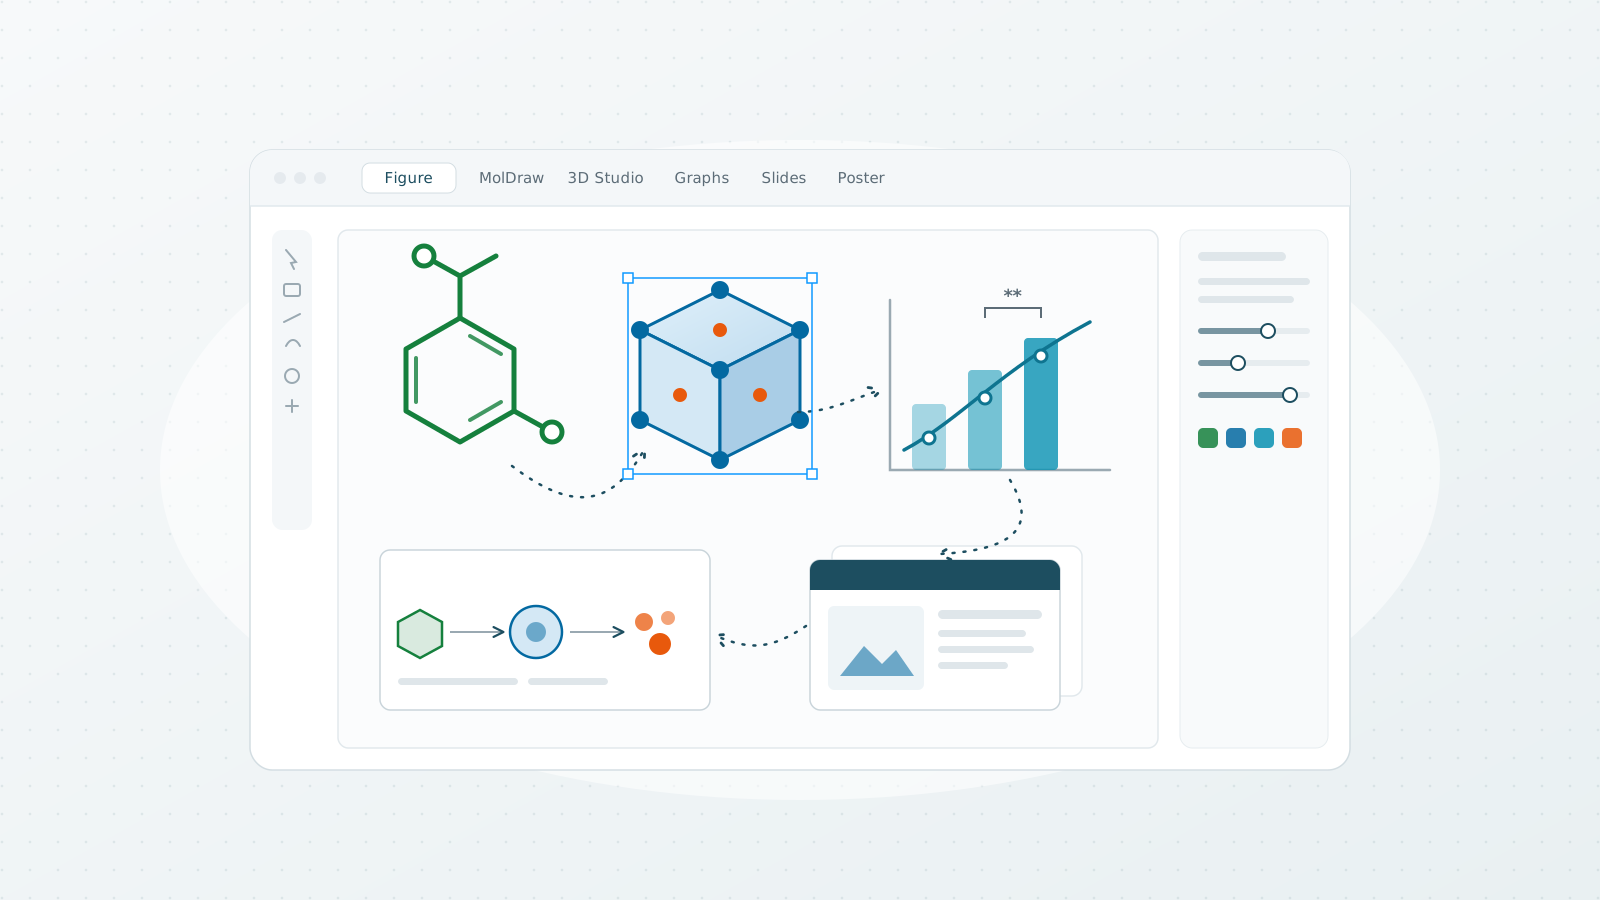
What is LabCanvas? One workspace for scientific illustration, data and presentation
A guide to LabCanvas: ten connected apps for figures, molecules, 3D crystals, graphs, slides and posters, the workflows between them, ready-made templates, and why one editable canvas makes scientific illustration faster to learn and easier to change.
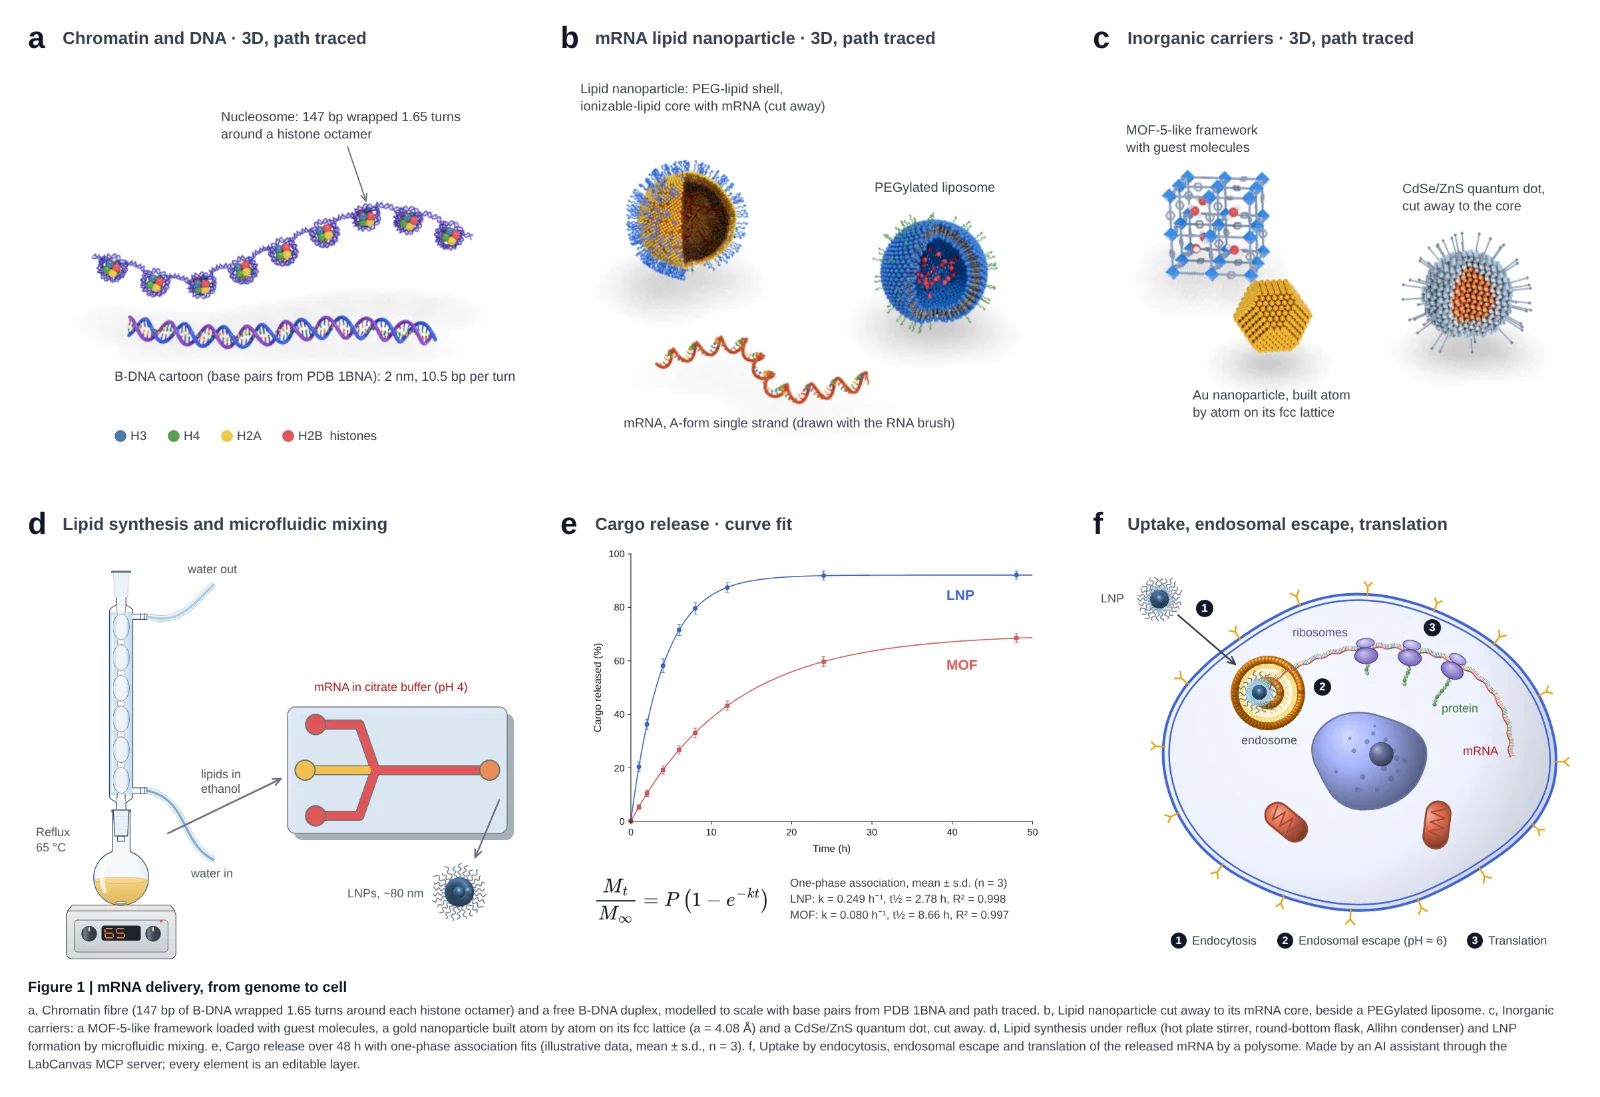
A BioRender alternative for scientific figures: what LabCanvas does differently
Looking for a BioRender alternative? An honest comparison with LabCanvas: adjustable objects, vector tools, 3D and graphs, and when BioRender fits better.