LabCanvas Research Poster: conference posters that arrange themselves
How to make an A0, A1 or 48 × 36 in research poster in LabCanvas Research Poster: blocks that stack in columns and re-flow their text, themes and block styles, QR codes, and a print-ready vector PDF.
Contents
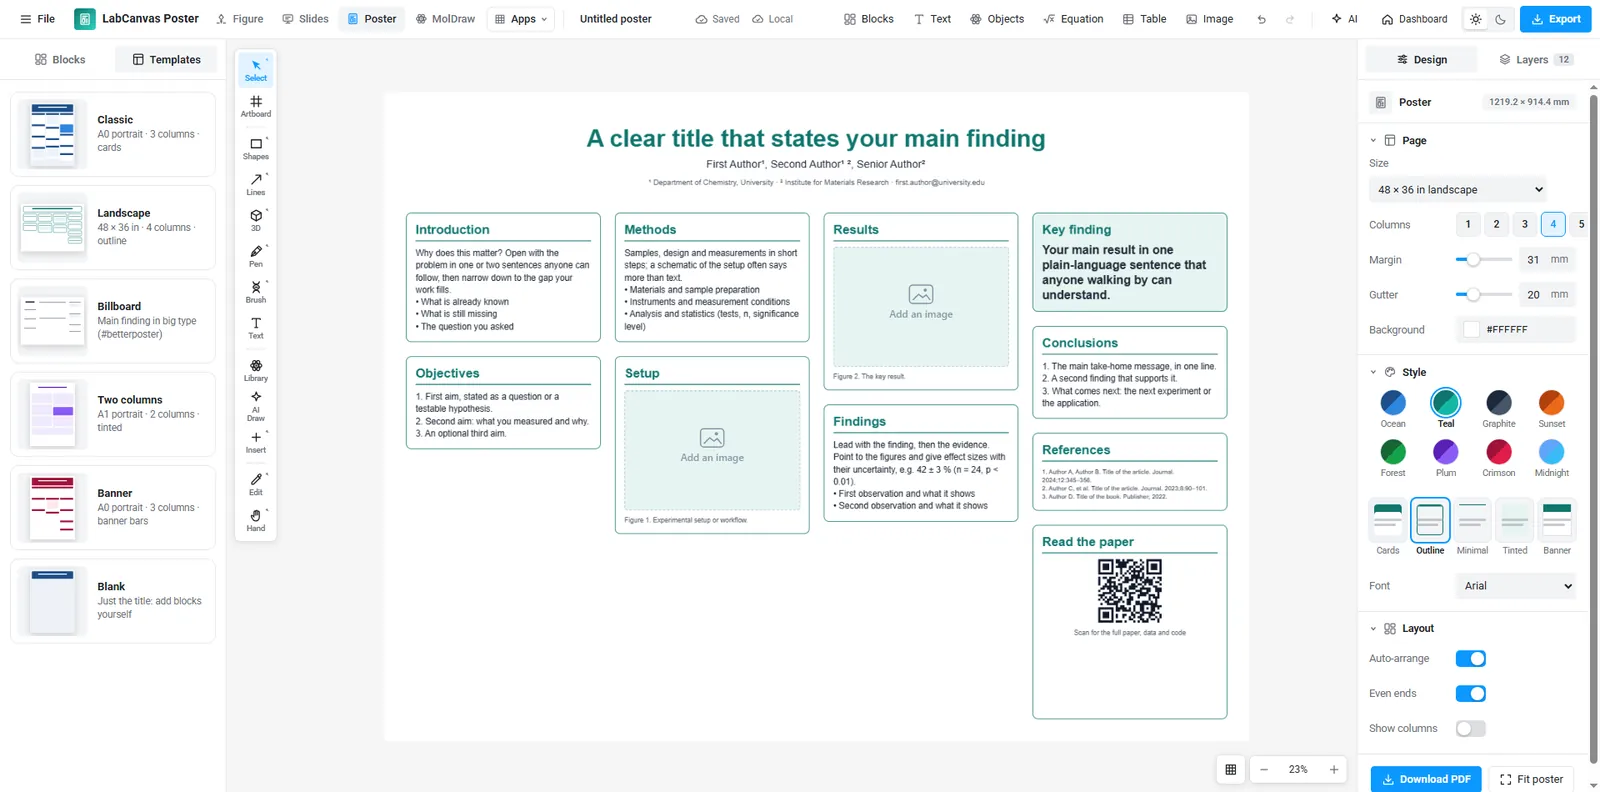
LabCanvas Research Poster makes conference posters from blocks: a title, sections, figures, a key finding, a big number, references, a QR code and contact details. The blocks stack in columns and lay out their own text, so when you drag a block to another column or between two others the poster re-arranges itself, and when you resize a block its text re-flows. Posters export as a vector PDF at their printed size.
Three finished posters
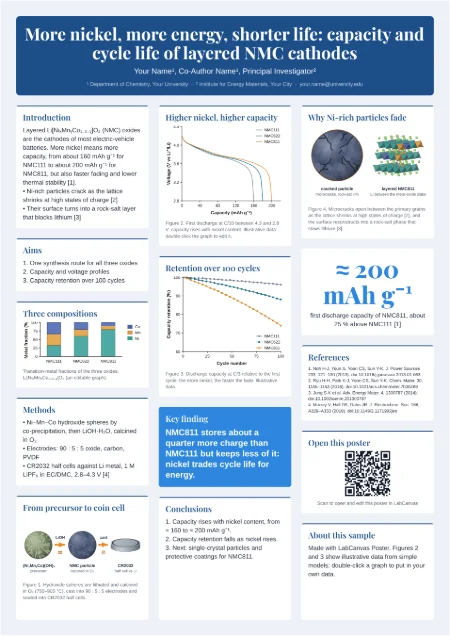
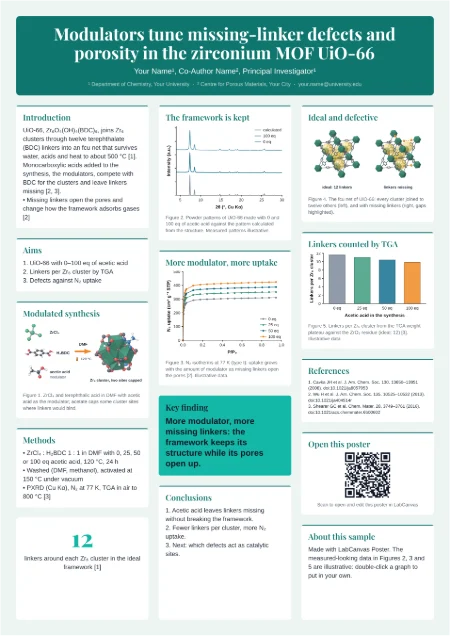
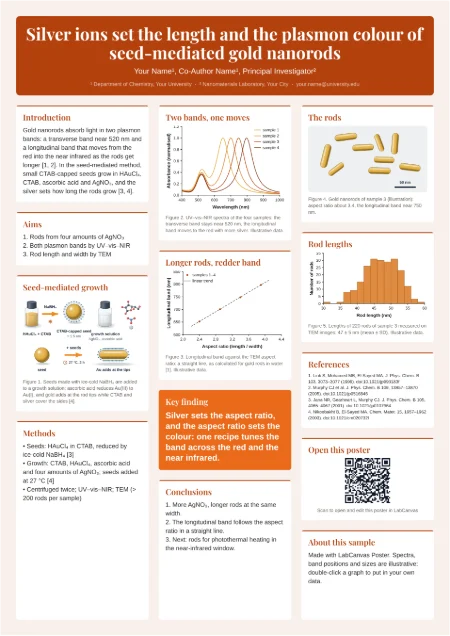
Each sample is a complete A0 poster with illustrations, molecules and graphs, and opens as your own copy.
Blocks instead of text boxes
A poster in a general drawing program is a page of loose text boxes: shorten one paragraph and everything below it has to be moved by hand. In Research Poster each section is a block that knows its column. Blocks grow with their text and the blocks below move down; drop a block into another column and both columns re-stack.
| Block | Use |
|---|---|
| Title | Title, authors and affiliations across the top |
| Section | Introduction, methods, results, discussion, conclusions |
| Figure | An image or a LabCanvas figure with a caption |
| Key finding | The one sentence a visitor should remember |
| Big number | A headline result, such as 87 % |
| References | Numbered references in a small type size |
| QR code | A link to the paper, data or the poster itself |
Themes and styles
Pick a colour theme (Ocean, Teal, Graphite, Sunset, Forest, Plum, Crimson, Midnight) and a block style (cards, outline, minimal, tinted or banner), and every block restyles at once. Fonts, margins, gutters and the number of columns are page settings.
How to make a poster
- Open Research Poster and choose a size and template.
- Double-click any text to write; blocks grow and the columns re-stack.
- Drag blocks from the Blocks panel onto the poster; drop images onto figure blocks.
- Use the Library (Shift+O) for science objects, and paste graphs from Graphs & statistics.
- Pick a theme and block style, then Export a vector PDF at the printed size.
Writing for a poster
- State the finding in the title, not just the topic.
- Keep sections to a few short bullet points: people read posters from two metres away.
- One key finding block with the main result in plain language.
- Large figures with large labels; check the printed size before you export.
Frequently asked questions
What poster sizes are there?
A0 and A1 portrait, 48 × 36 in landscape, a billboard-style #betterposter layout and custom sizes in millimetres or inches.
How do I move a section to another column?
Drag the block by its heading and drop it into another column or between two blocks. The columns re-stack; with Auto-arrange on, the poster keeps the columns tidy for you.
Which formats can I export?
A vector PDF at the printed size for the print shop, plus PNG, JPEG and SVG.
Can I add a QR code to my paper or data?
Yes. The QR code block makes a code from any link, with a caption, so visitors can open the paper, the data or the poster itself.
Are there finished examples?
Three complete A0 posters (layered NMC cathodes, defects in UiO-66 and gold nanorods) open as your own copy from the home page.
Try it in LabCanvas
Every app is free to start in your browser. Create an account and begin.
Start Research Poster free in your browserKeep reading

ImageJ vs LabCanvas Image Analysis: an honest comparison
ImageJ/Fiji or LabCanvas Image Analysis? Six everyday jobs done in both, six newer ones (macros, vendor files, 3D, StarDist, big images) and which to use.
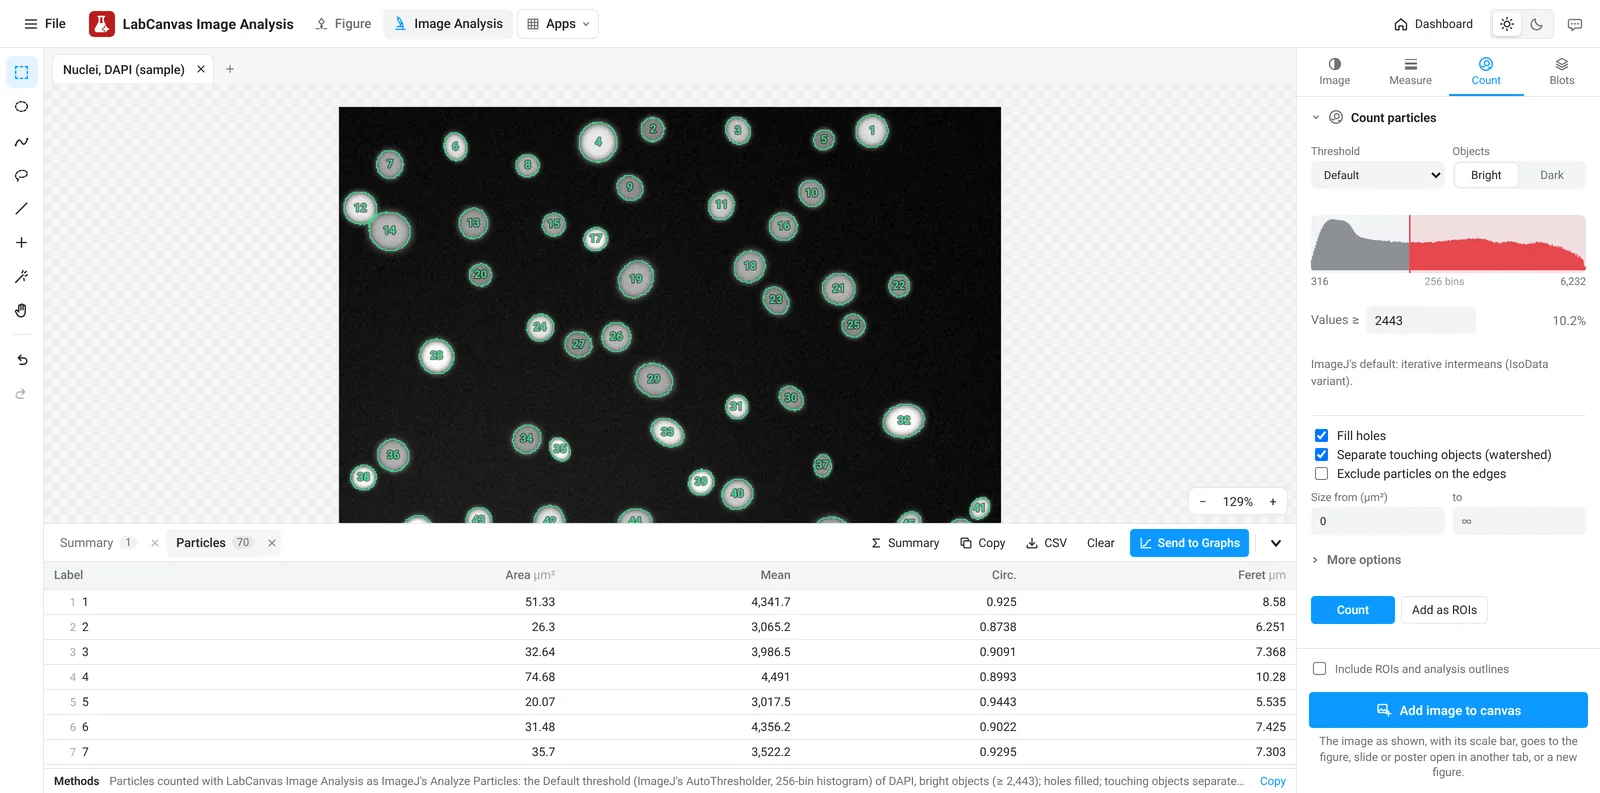
LabCanvas Image Analysis: measure microscopy images, western blots and gels in your browser
How to measure images in LabCanvas Image Analysis: guided assays (nuclear translocation, spots per cell, wound healing, FRAP, calcium, tracking, branching), western blots with a ladder and total-protein normalisation, cell counting with a trainable classifier, ROIs with ImageJ definitions, on the raw pixel values, with results sent to Graphs.
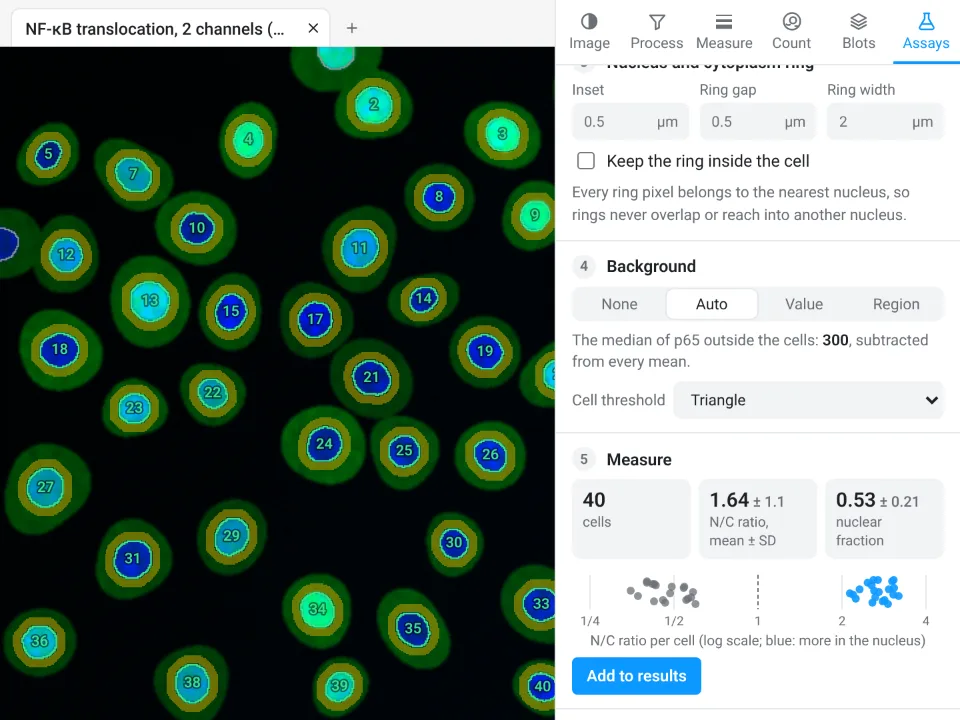
Image Analysis in LabCanvas: a complete guide to every tool and setting, with examples
Every tool in LabCanvas Image Analysis, tab by tab, with its settings and a real example: image check, display and scale, stacks and Z projection, background subtraction, filters, thresholds and binary operations, ROIs and Set measurements, Analyze Particles, a pixel classifier, spots, cell counter, western blot densitometry, colocalisation, colour deconvolution and eleven guided assays.