LabCanvas Graphs & statistics: 70 scientific graph types with checked statistics
A visual guide to LabCanvas Graphs & statistics: Prism-style data tables, 70 graph types from scatter dot plots to Kaplan–Meier, volcano and PAE plots, t tests, ANOVA, curve fits and survival tests checked against SciPy, and graphs that stay linked to their figure.
Contents
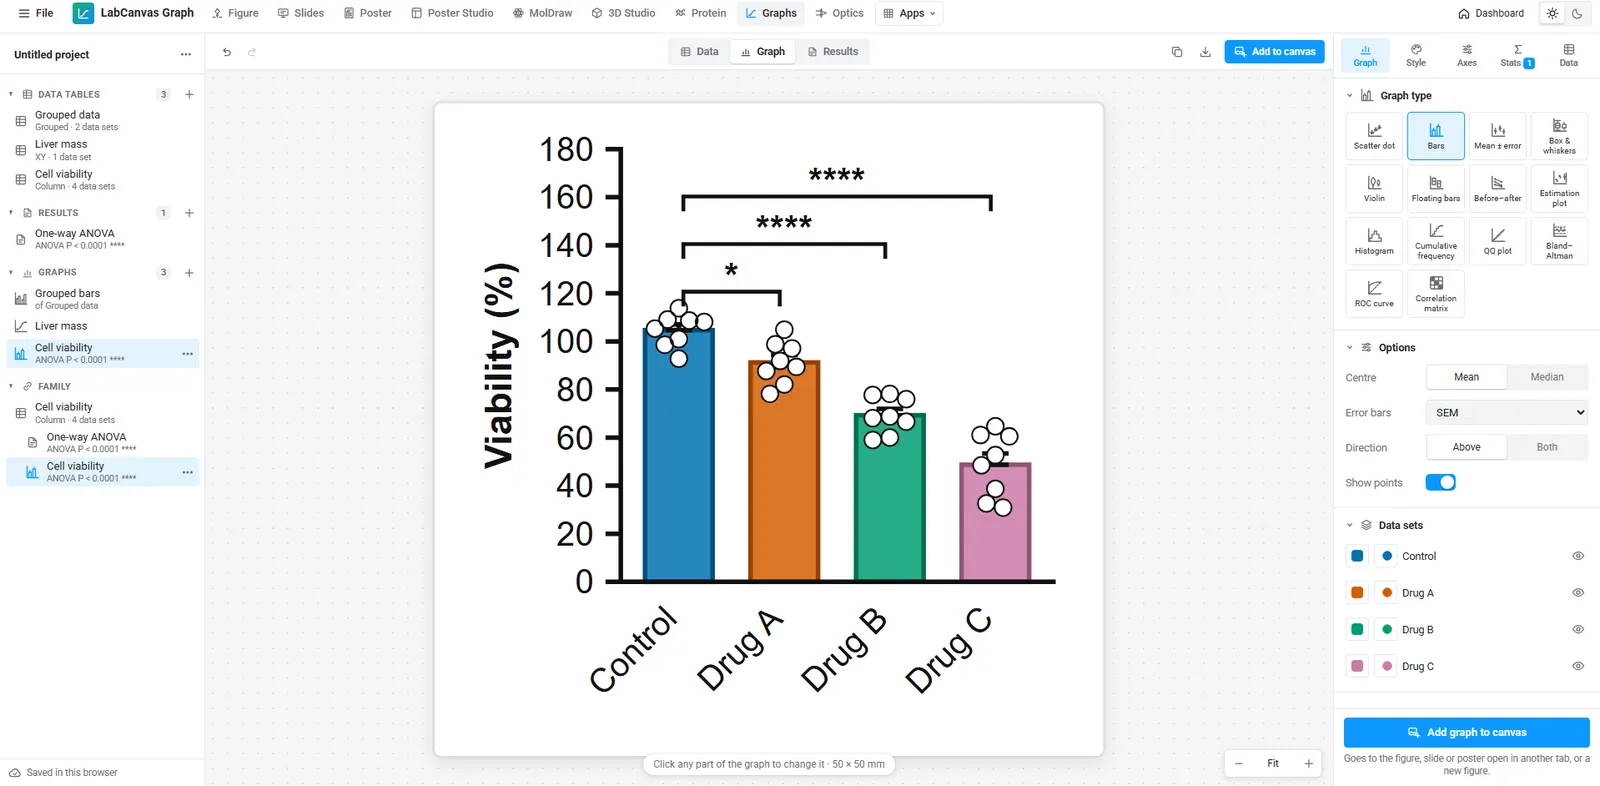
LabCanvas Graphs & statistics is a data analysis and graphing app in the style of GraphPad Prism. Data go into typed tables (column, XY, grouped, survival or contingency), analyses run on them and graphs draw from them, with significance brackets placed from the test results. There are 70 graph types, and every statistical method is checked against SciPy and statsmodels in automated tests. Graphs go into figures as editable vectors that stay linked to their data.
Every graph type, by category
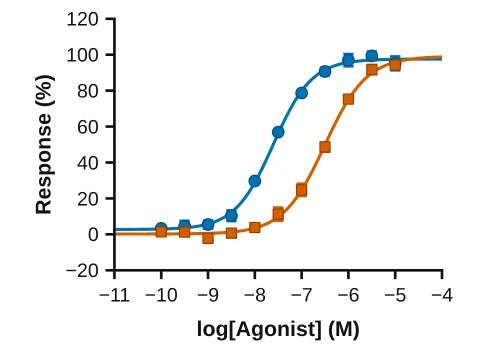
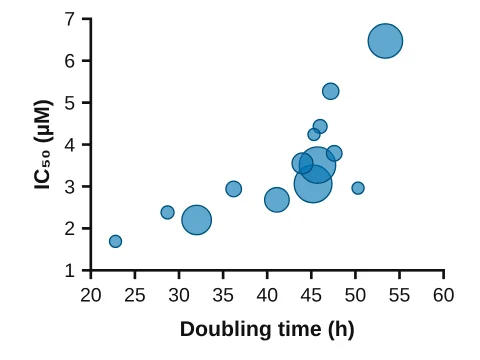
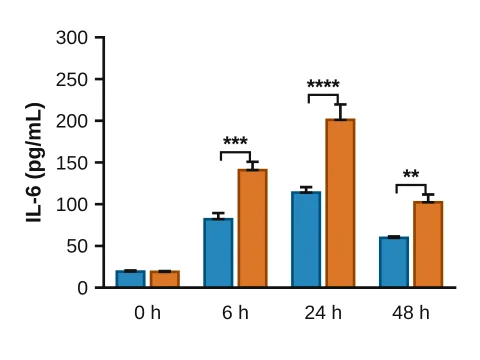
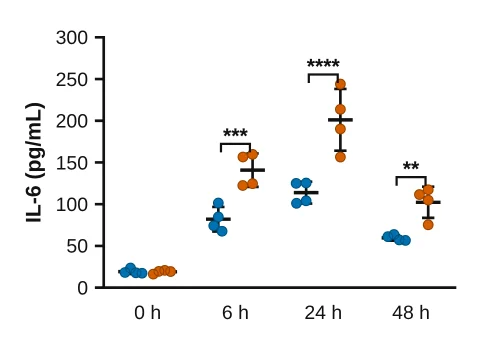
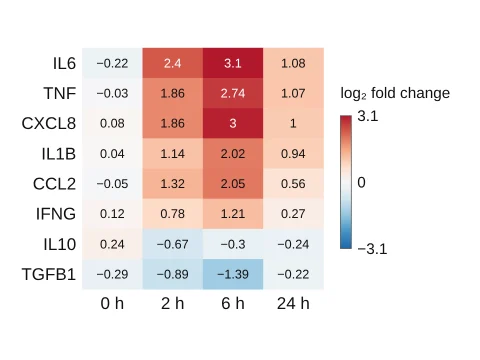
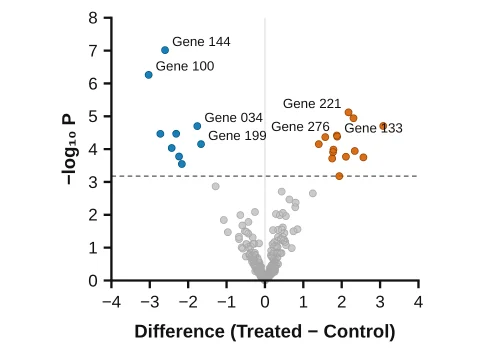
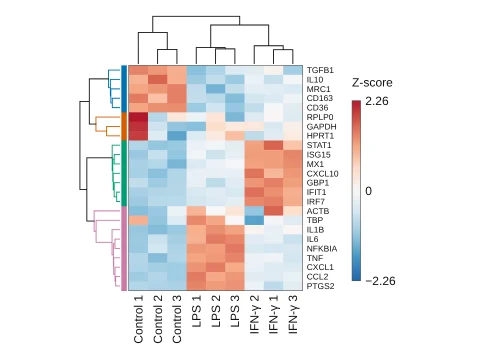
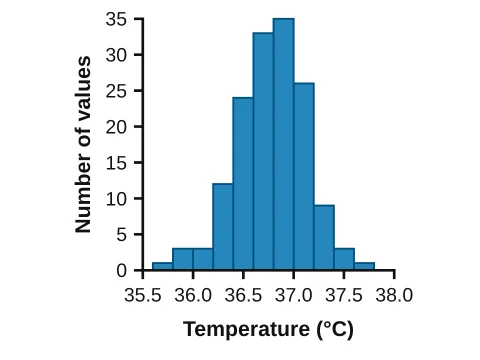
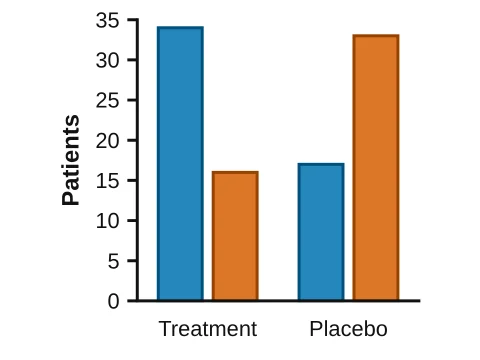
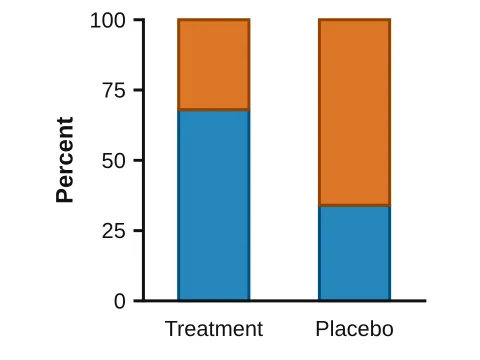
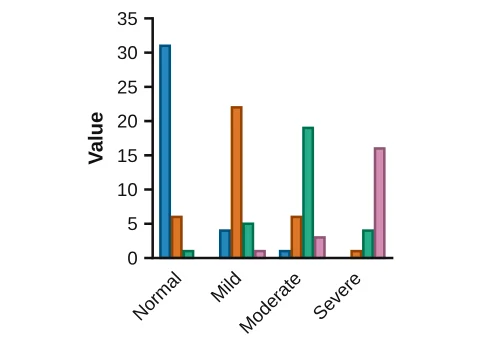
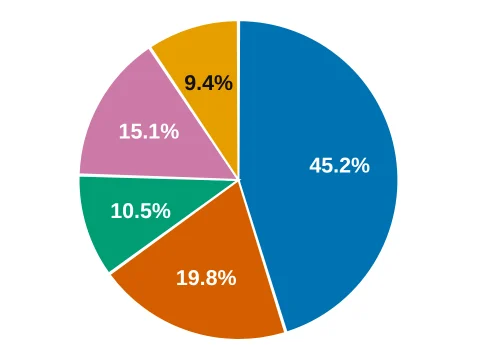
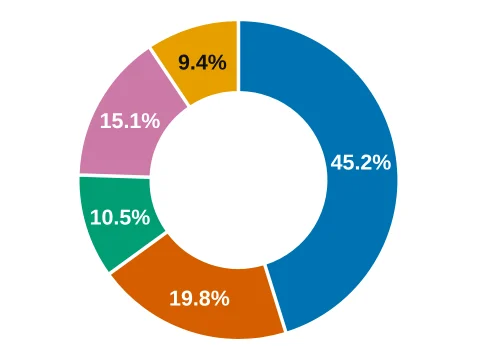
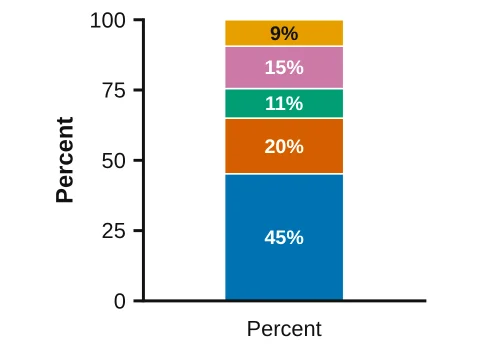
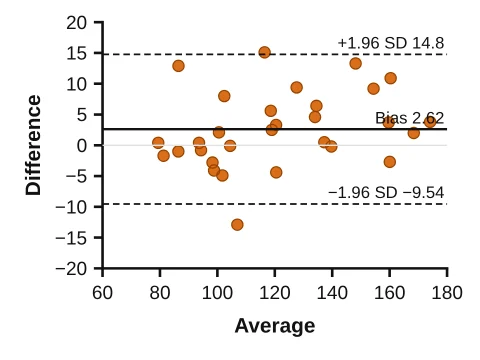
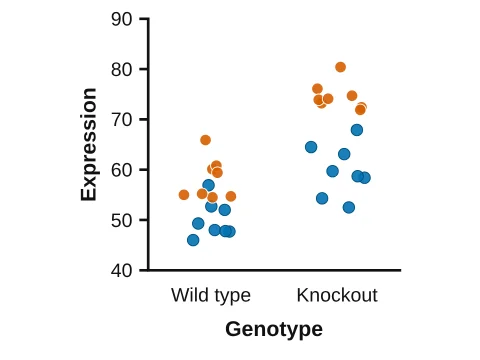
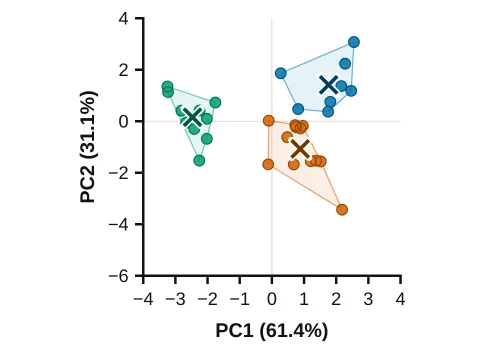
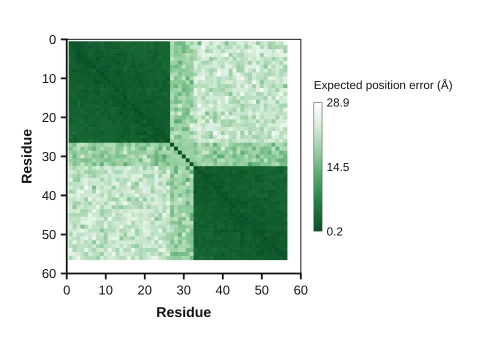
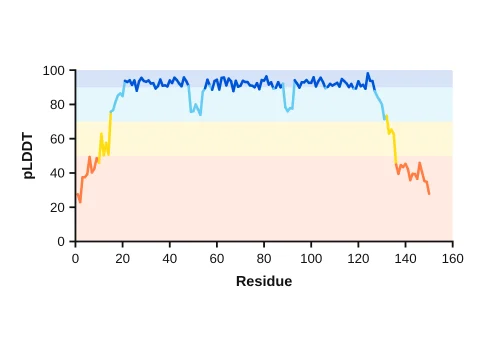
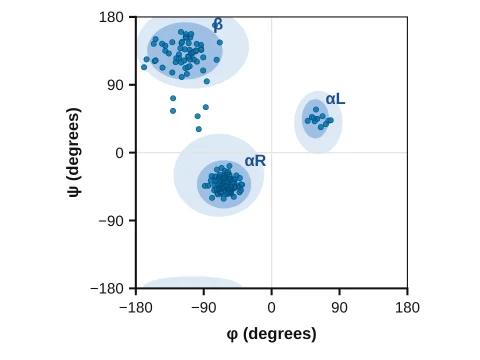
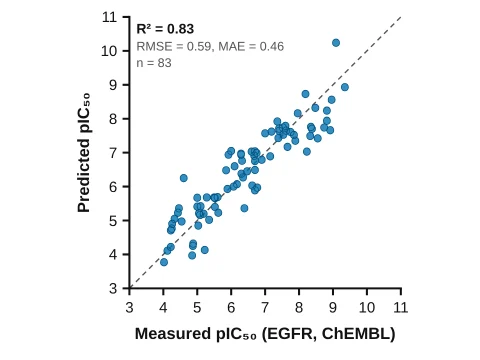
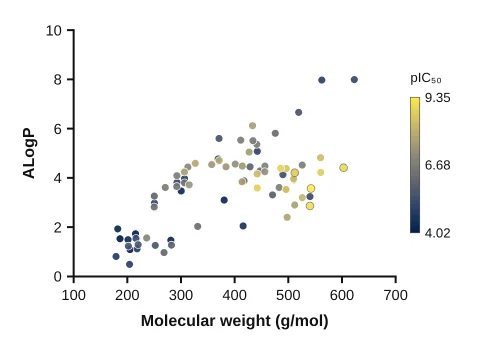
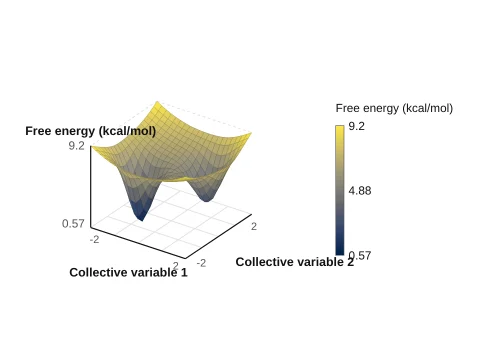
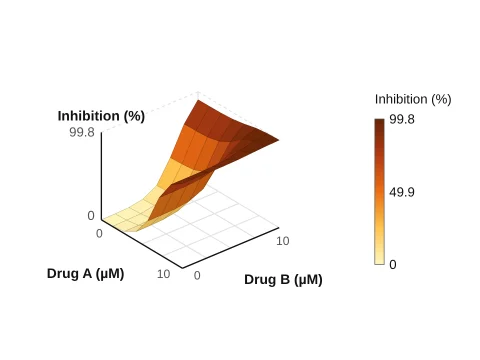
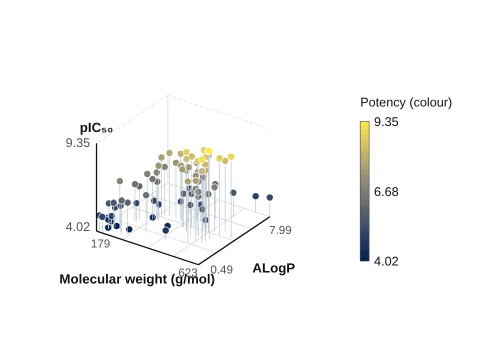
Each picture below was drawn by the app from its example data, exactly as it appears when you pick the graph type. Open the app and the same graphs are one click away.
Column
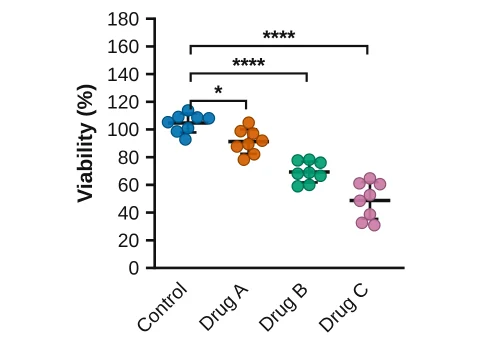
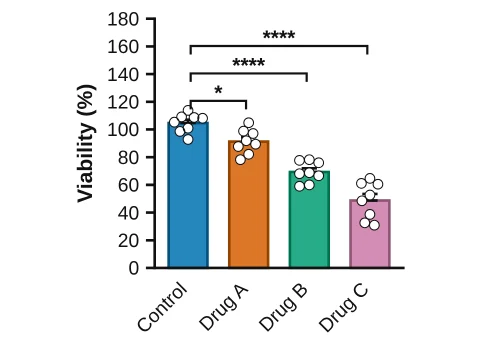
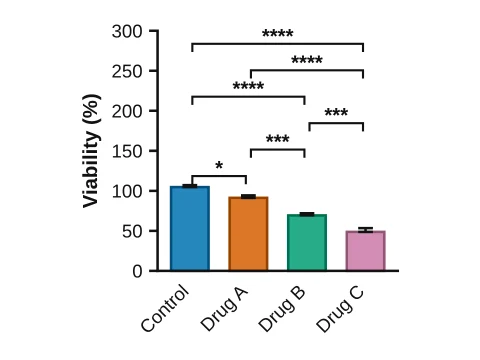
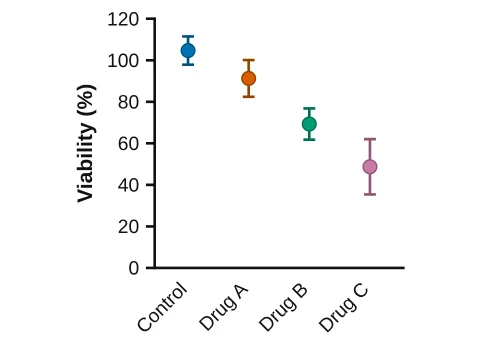
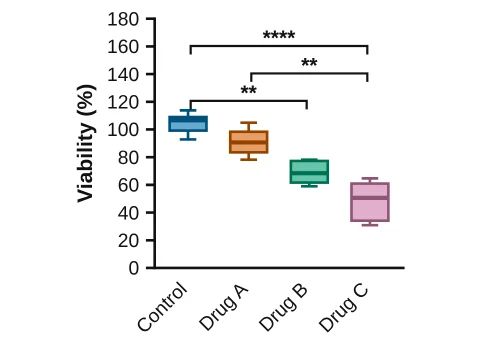
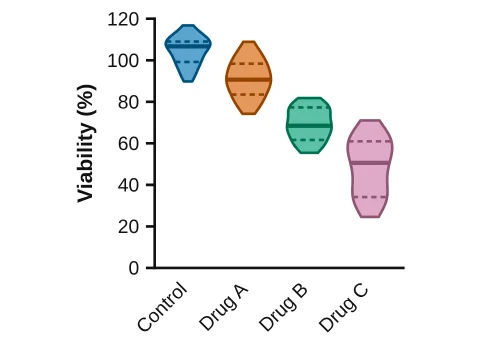
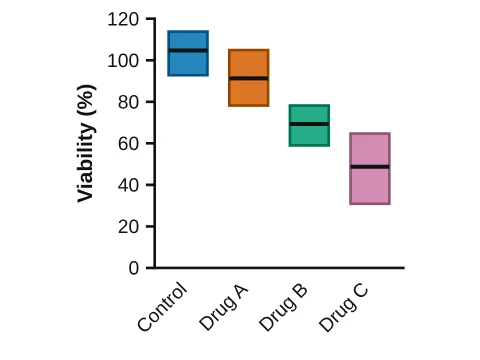
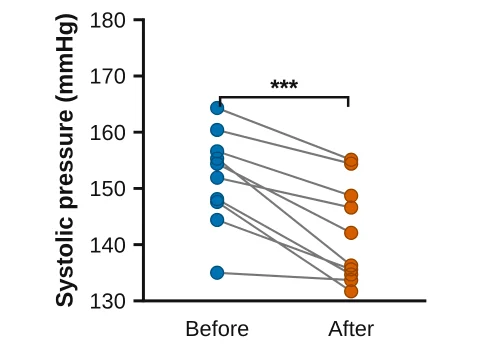
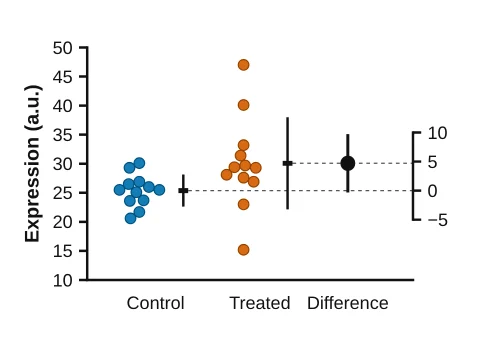
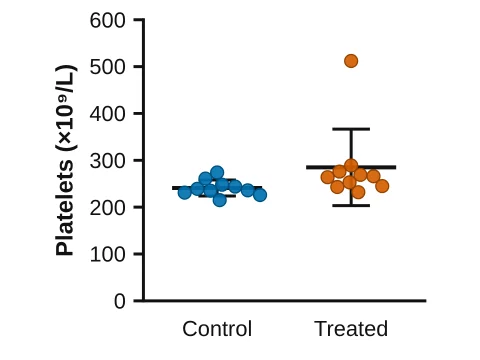
XY
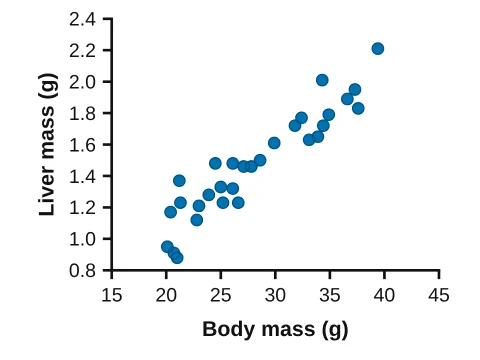
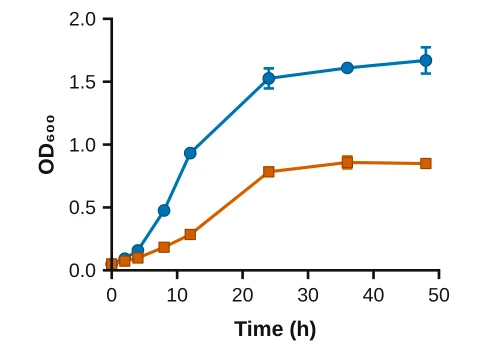
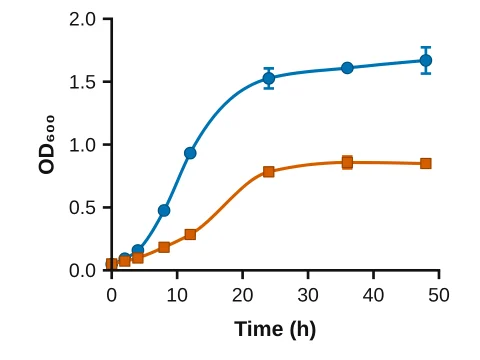
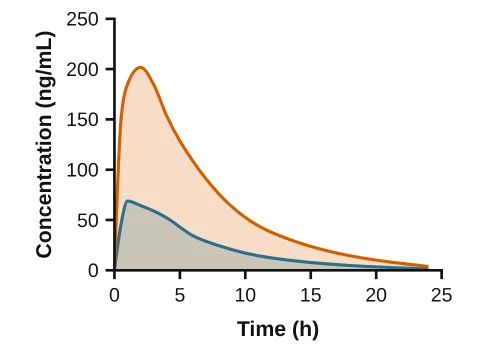
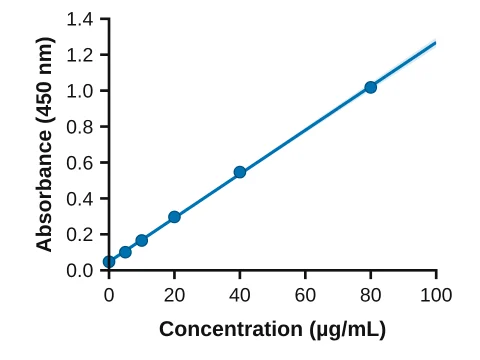
Grouped
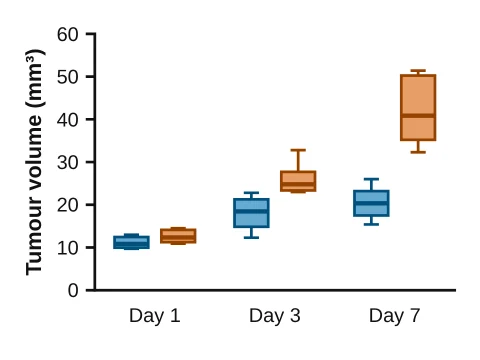
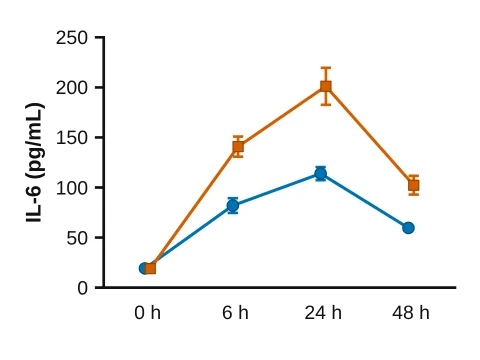
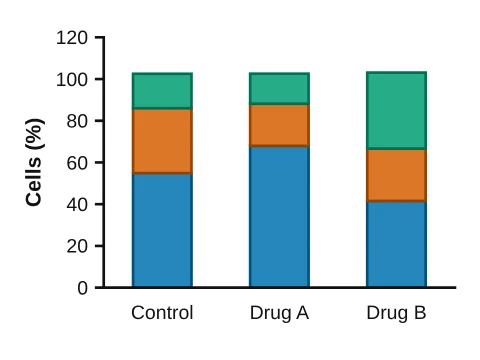
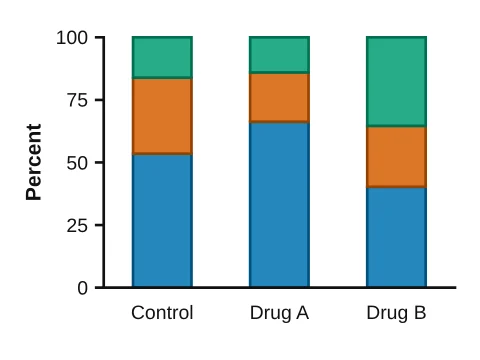
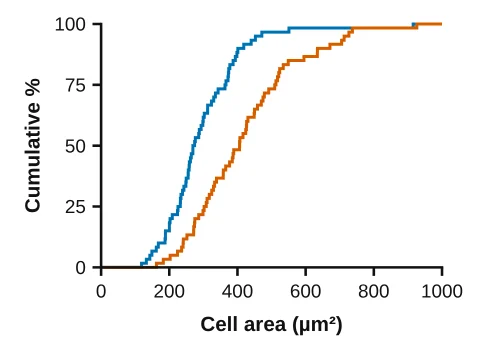
Distributions
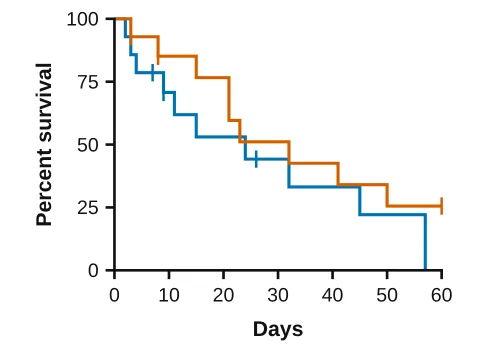
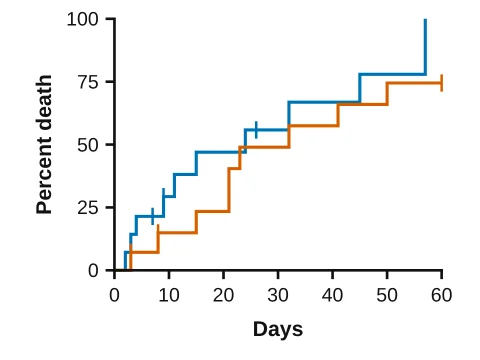
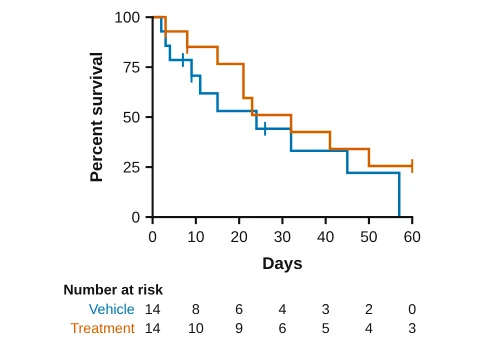
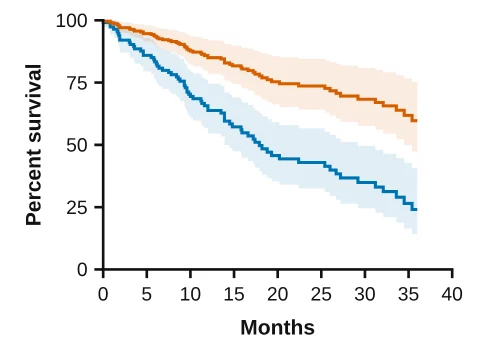
Survival
Contingency
Parts of whole
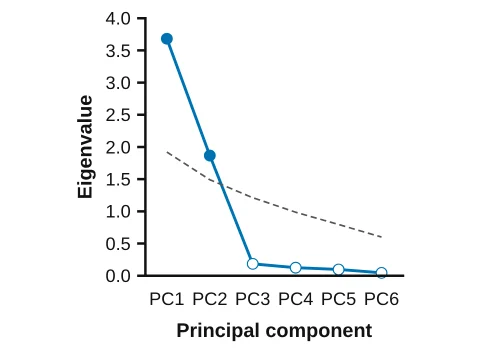
Methods & diagnostics
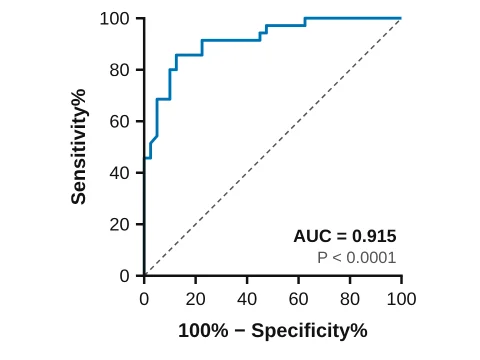
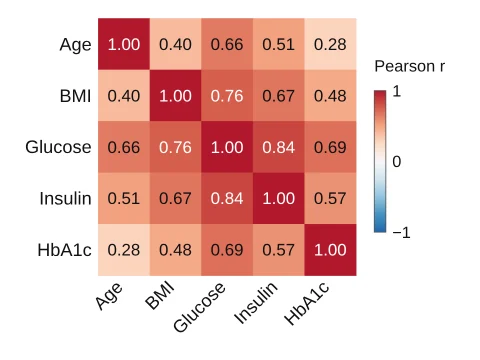
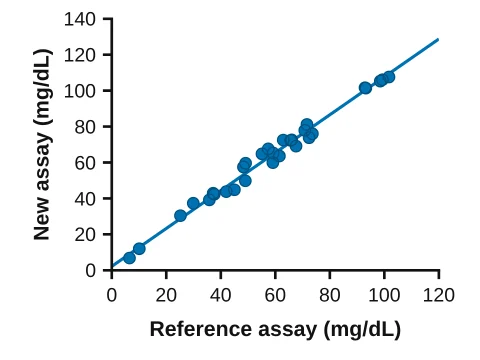
Curve fits & standard curves
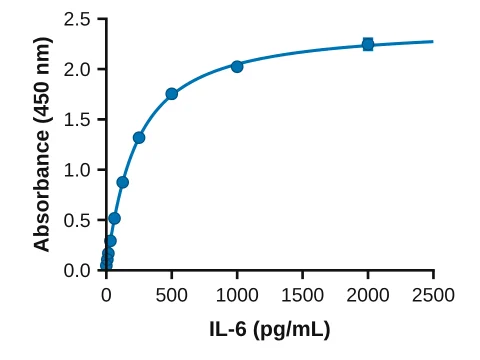
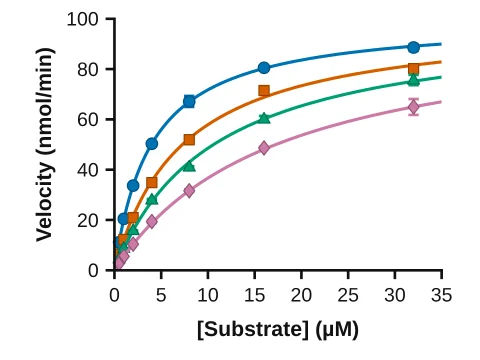
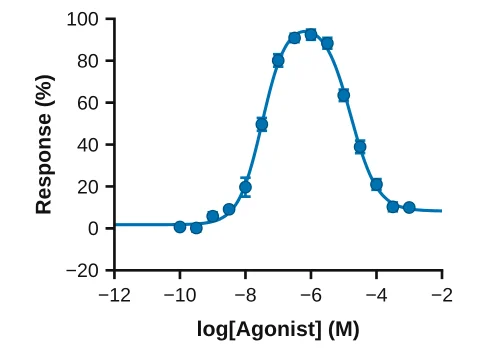
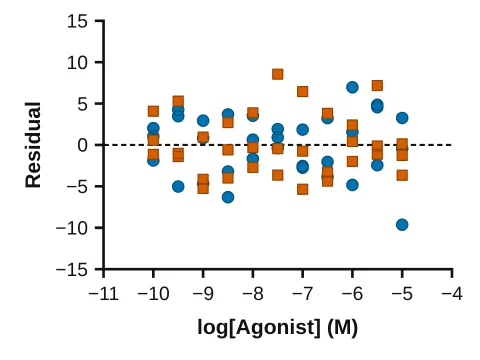
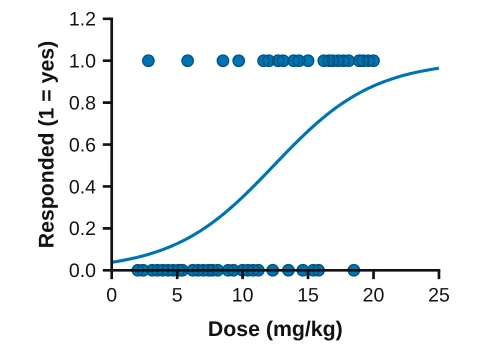
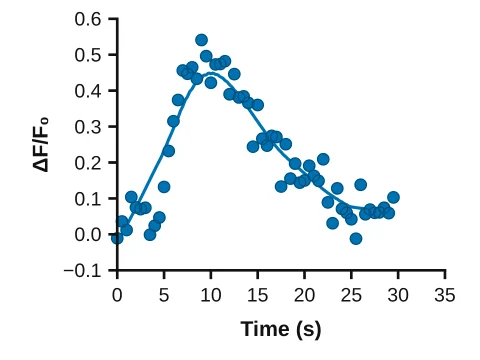
Nested
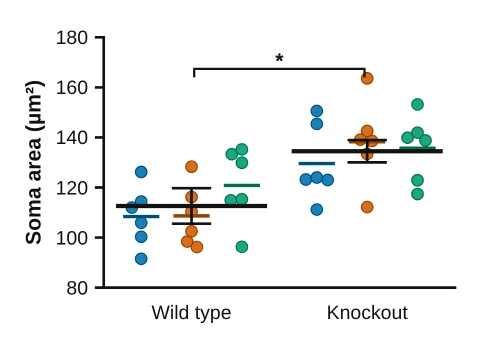
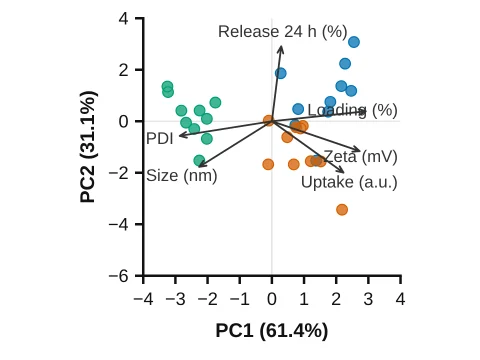
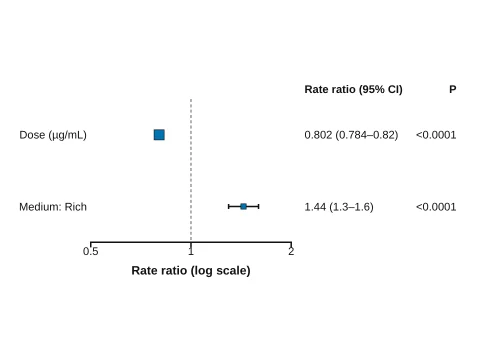
Multiple variables
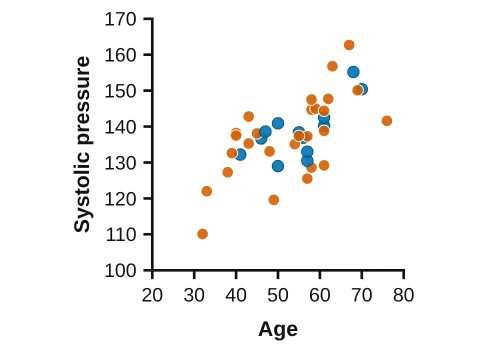
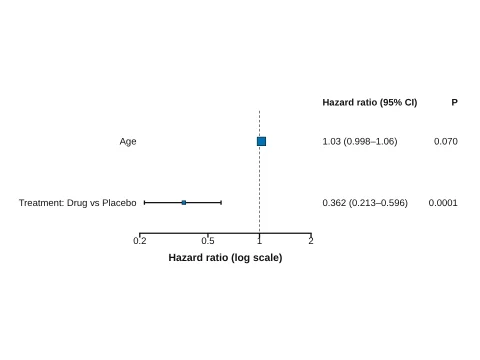
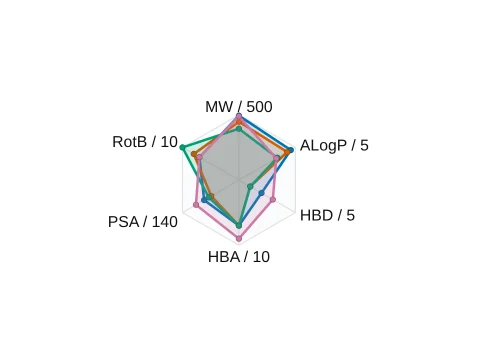
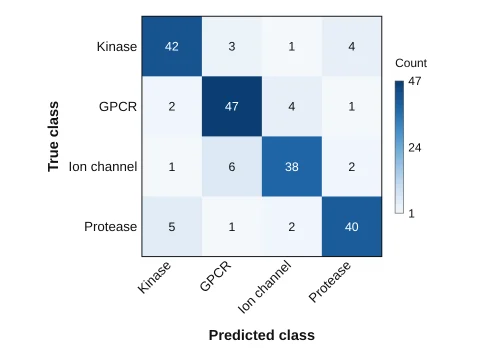
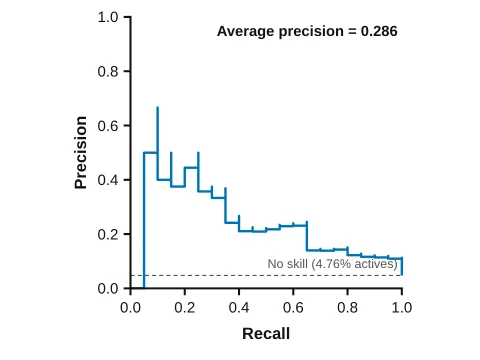
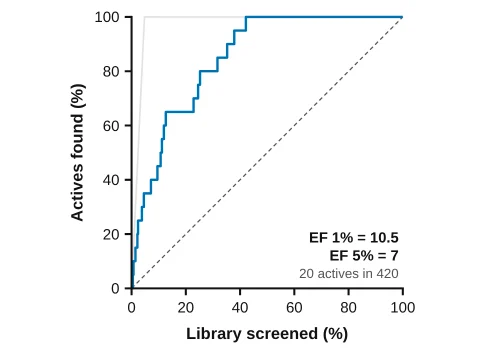
Proteins & drug discovery
Statistics you can check
| Analysis | Methods |
|---|---|
| Compare two groups | Unpaired and paired t tests, Welch’s t test, Mann–Whitney, Wilcoxon, Kolmogorov–Smirnov |
| Compare several groups | One- and two-way ANOVA, repeated measures, Kruskal–Wallis, Friedman; post-hoc tests such as Tukey, Dunnett and Šidák |
| Relationships | Linear regression, correlation, nonlinear curve fits including dose–response (EC50/IC50) |
| Survival | Kaplan–Meier curves, log-rank test, median survival |
| Contingency | Chi-square and Fisher’s exact test, odds and risk ratios |
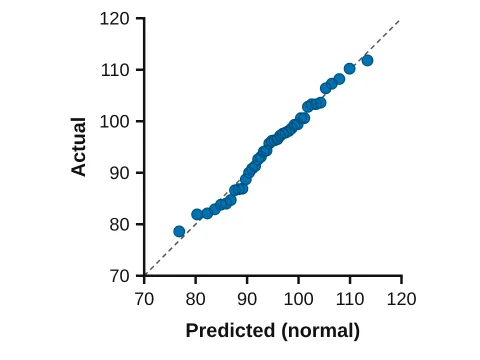
| Diagnostics | ROC curves with AUC, Bland–Altman agreement, QQ plots |
| Cluster analysis | Hierarchical clustering drawn as a clustered heat map with dendrograms, k-means with elbow and silhouette plots |
| Simulation | Simulated XY and column data, families of theoretical curves, Monte Carlo power and parameter-spread analysis |
Results are validated against SciPy, statsmodels, lifelines and R in more than 42,000 automated checks, and the drawn graphs in 3,473 more (how the statistics are validated).
How to run a one-way ANOVA with post-hoc tests
- Open Graphs & statistics and pick Bars with points (Column).
- Type or paste your values into the column table, one column per group.
- In the Stats tab choose one-way ANOVA and Tukey or Dunnett comparisons.
- Significance brackets appear on the graph; adjust their style in the panel.
- Click Add to figure to place the graph, still linked to its data.
Choosing a graph
- Show every point when groups are small (n < 20): scatter dot plots or bars with points.
- Box and violin plots show the spread of larger samples.
- XY graphs for time courses and dose–response curves; fit the curve rather than joining the dots.
- Survival data belong in Kaplan–Meier curves with the number at risk.
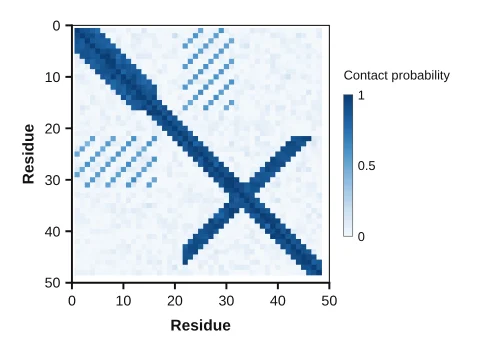
- Matrices (heat maps, correlation, PAE and contact maps) need a colour scale with a labelled range; cluster the rows and columns to show the groups in them.
- Black-and-white print: give bars hatched or dotted fills so they stay apart without colour.
Several graphs on one page
A layout puts graphs from the project side by side in a grid on one page, with panel letters (A, B, C…), and exports the page as one PDF, TIFF or PNG. Each panel stays linked to its graph, so a corrected value updates the page.
Frequently asked questions
Is LabCanvas Graphs an alternative to GraphPad Prism?
It works in the same way: data tables (column, XY, grouped, survival, contingency), analyses and graphs in a project navigator, with significance brackets drawn from the tests. It runs in the browser and its graphs go straight into LabCanvas figures.
Which statistical tests are there?
t tests (paired and unpaired), one- and two-way ANOVA with Tukey, Dunnett, Šidák and other post-hoc tests, nonparametric tests (Mann–Whitney, Wilcoxon, Kolmogorov–Smirnov, Kruskal–Wallis), linear and nonlinear regression including dose–response curves, log-rank survival tests, contingency tests (chi-square, Fisher), hierarchical clustering and k-means, and Monte Carlo simulations.
How do I know the statistics are right?
Every analysis is checked against SciPy, statsmodels, lifelines and R in more than 42,000 automated tests, and every graph type is drawn from reference data and read back point by point (3,473 checks).
Can I paste data from Excel?
Yes. Copy cells in Excel or Google Sheets and paste them into a data table; the table grows to fit.
Do graphs update in my figure when the data change?
Yes. Add to figure places the graph as editable vectors that stay linked to the data, so a corrected value updates the figure it sits in.
Try it in LabCanvas
Every app is free to start in your browser. Create an account and begin.
Start Graphs & statistics free in your browserKeep reading

ImageJ vs LabCanvas Image Analysis: an honest comparison
ImageJ/Fiji or LabCanvas Image Analysis? Six everyday jobs done in both, six newer ones (macros, vendor files, 3D, StarDist, big images) and which to use.
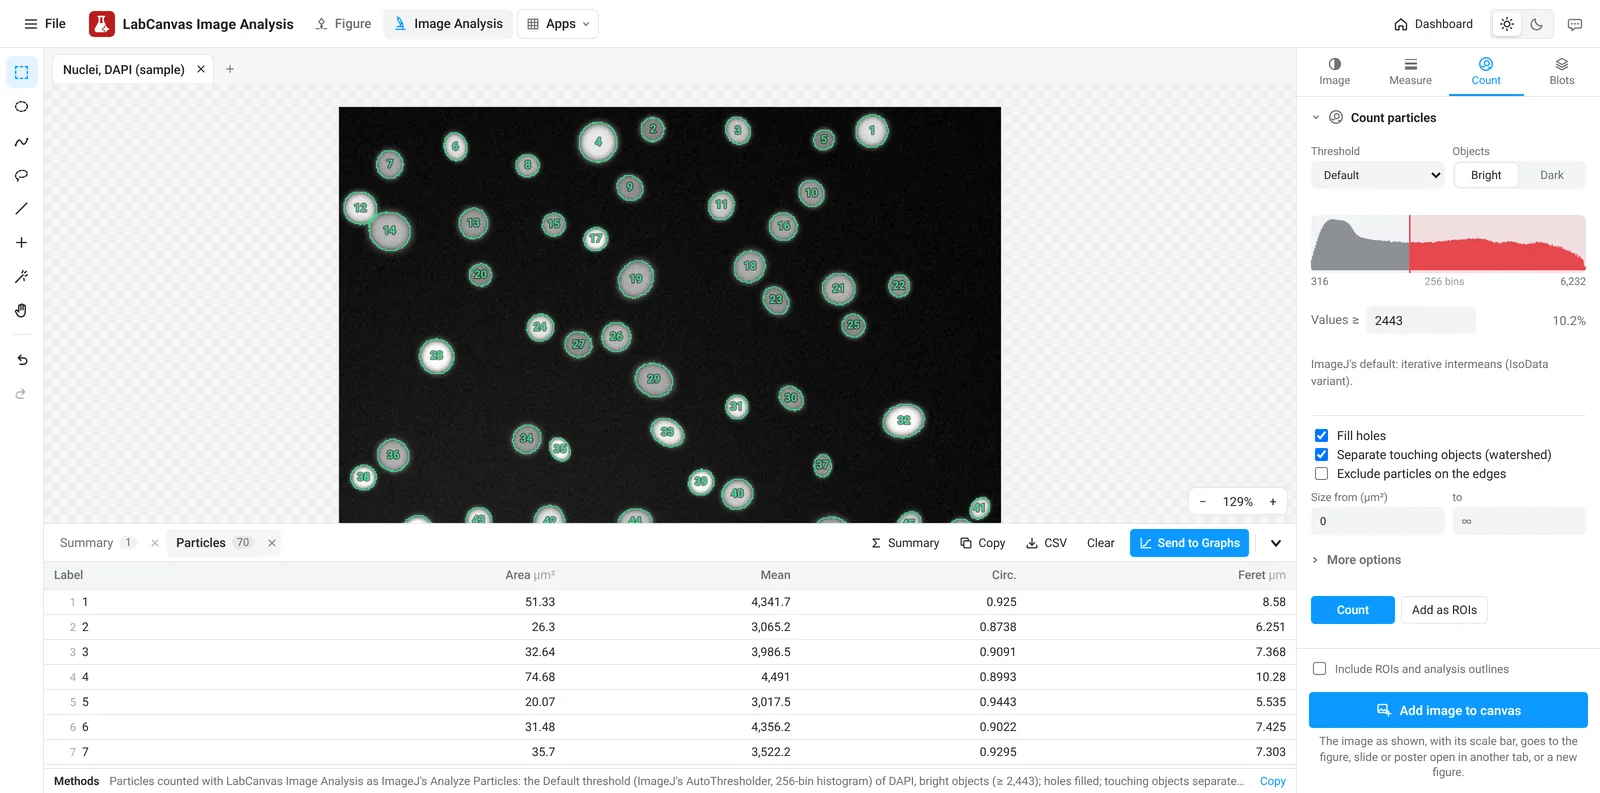
LabCanvas Image Analysis: measure microscopy images, western blots and gels in your browser
How to measure images in LabCanvas Image Analysis: guided assays (nuclear translocation, spots per cell, wound healing, FRAP, calcium, tracking, branching), western blots with a ladder and total-protein normalisation, cell counting with a trainable classifier, ROIs with ImageJ definitions, on the raw pixel values, with results sent to Graphs.
Image Analysis in LabCanvas: a complete guide to every tool and setting, with examples
Every tool in LabCanvas Image Analysis, tab by tab, with its settings and a real example: image check, display and scale, stacks and Z projection, background subtraction, filters, thresholds and binary operations, ROIs and Set measurements, Analyze Particles, a pixel classifier, spots, cell counter, western blot densitometry, colocalisation, colour deconvolution and eleven guided assays.