The LabCanvas Figure editor: vector scientific illustration in your browser
How to make journal figures and graphical abstracts in the LabCanvas Figure editor: vector tools, 700+ adjustable science objects, lab glassware that connects, LaTeX equations, and export at the width and DPI your journal asks for.
Contents
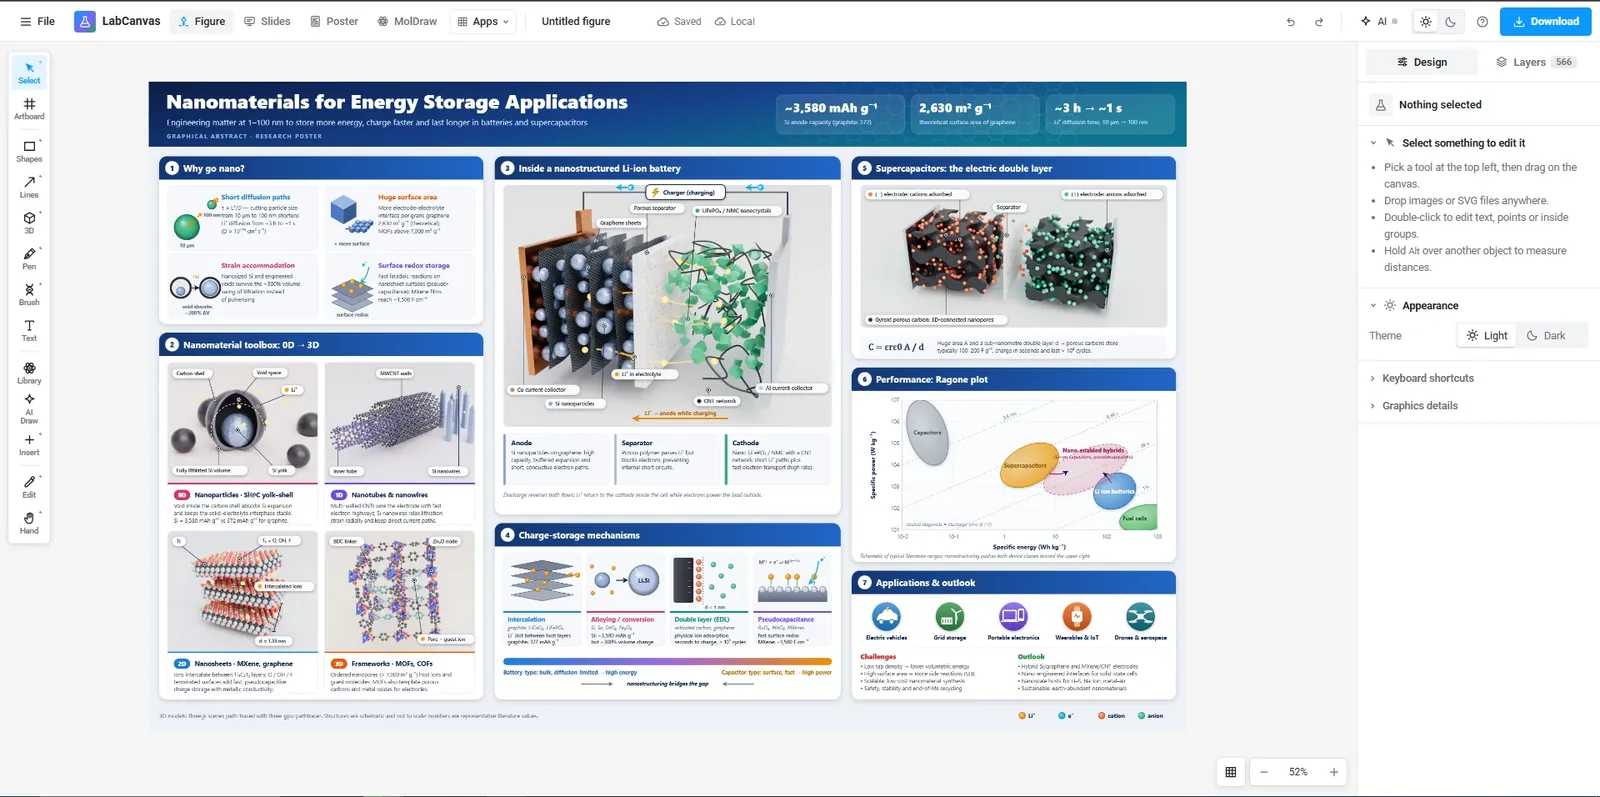
The LabCanvas Figure editor is a vector drawing app for scientific figures that runs in the browser. It combines the tools of a general illustration program (pen, Pathfinder, gradients, masks) with things scientists draw every week: 700+ adjustable science objects, lab glassware that snaps together, scientific brushes such as a DNA double helix, LaTeX equations and tables. Figures export at the exact width and resolution a journal asks for.
What you can make with it
The editor is built for the figures that go into papers, theses and grant applications:
- Graphical abstracts and TOC graphics, drawn from objects and arrows, or started from a template.
- Schematics of syntheses and devices: a reaction flask on a hot plate, a coin cell, a membrane module.
- Mechanism figures with molecules from PubChem, proteins from the PDB and labelled pathways.
- Multi-panel figures with panel letters, aligned graphs from Graphs & statistics and micrographs edited in the Pixel editor.
Science objects you can adjust
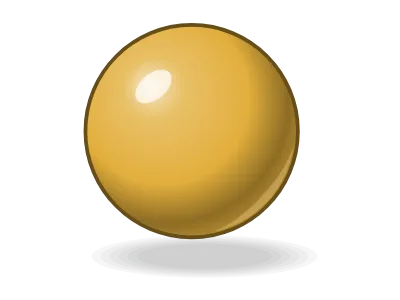
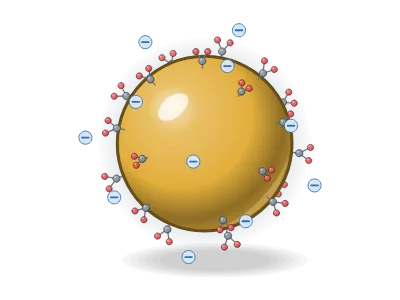
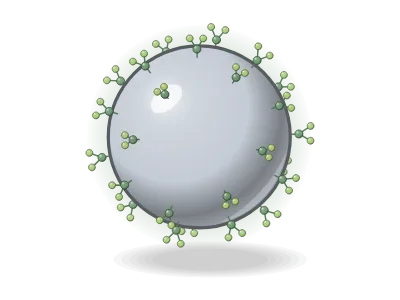
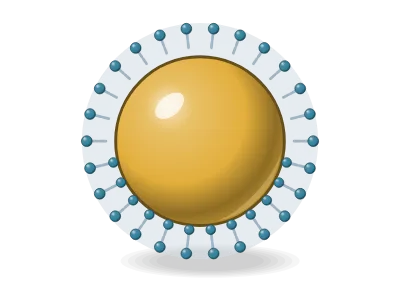
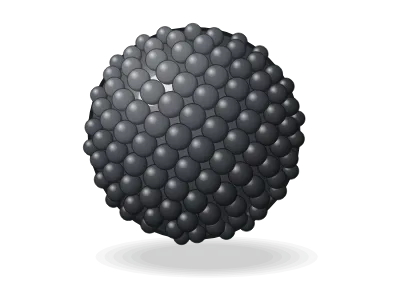
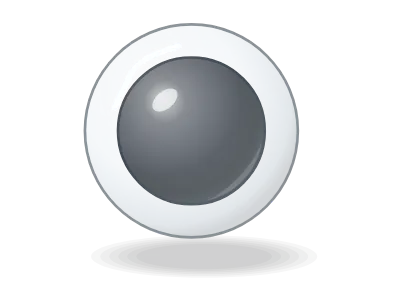
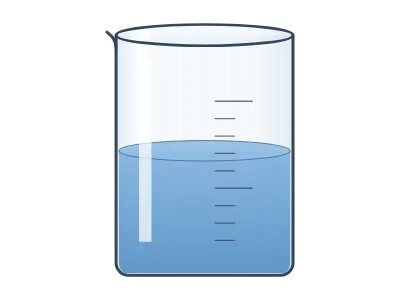
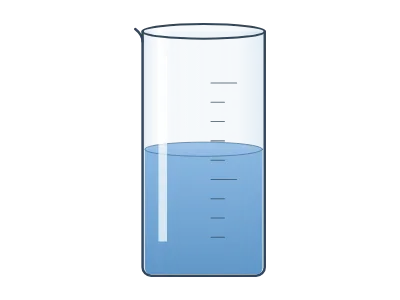
Every object in the Library is drawn by a generator: a small program that turns settings into a drawing. A liposome has settings for its size, its bilayer and its cargo; a nanoparticle for its core, shell and ligands; a beaker for its volume, graduations and liquid. Change a setting and the drawing follows, so one object covers many variants.
Nanomaterials
Lab glassware and instruments
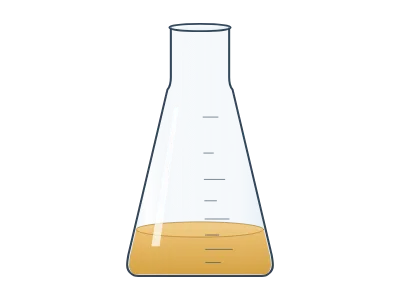
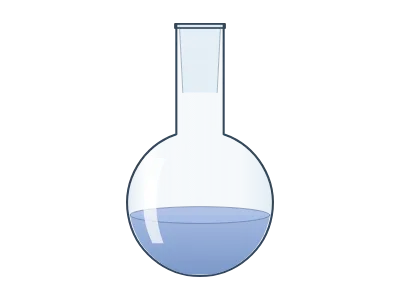
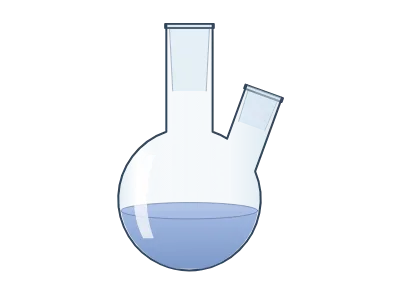
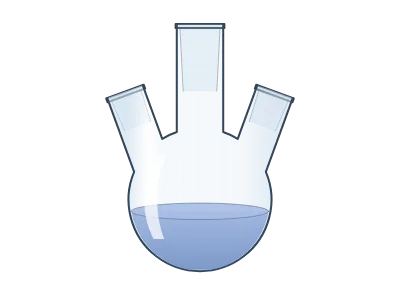
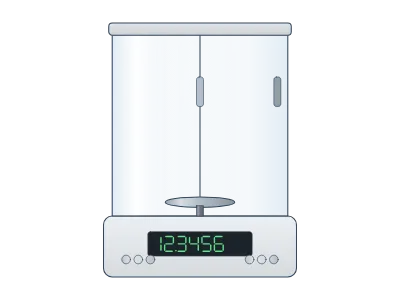
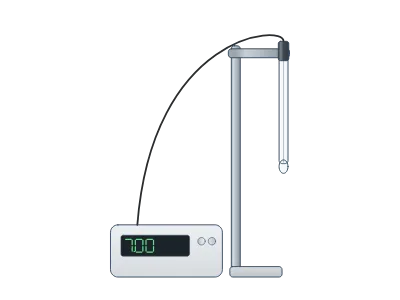
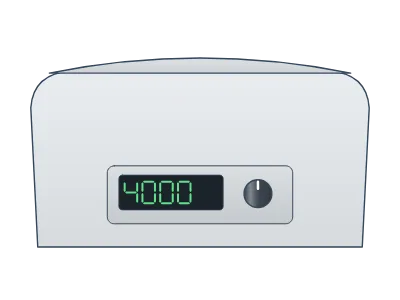
Glassware is drawn at real proportions. Joints snap onto each other and tubing follows the hose barbs, so a distillation or Schlenk setup stays assembled while you move it.
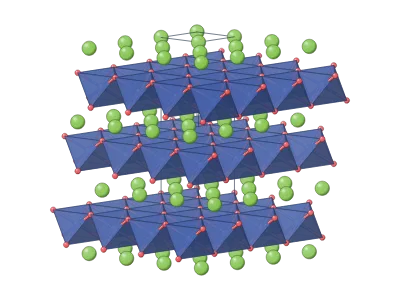
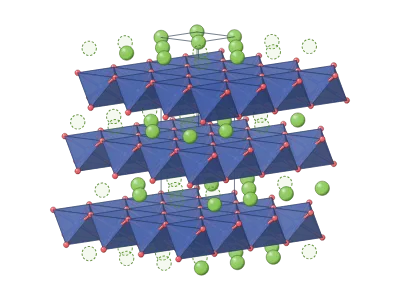
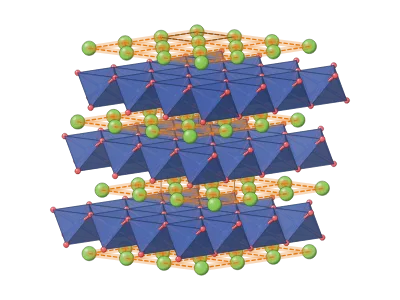
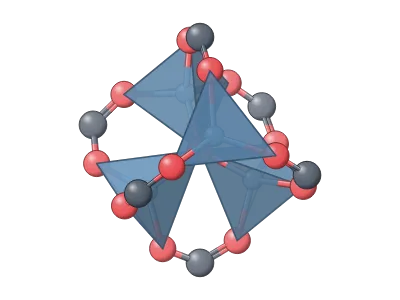
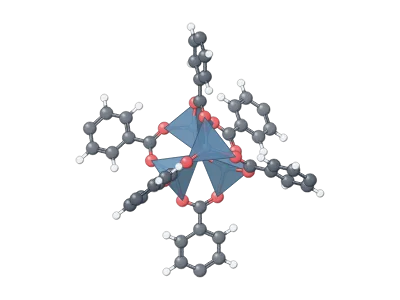
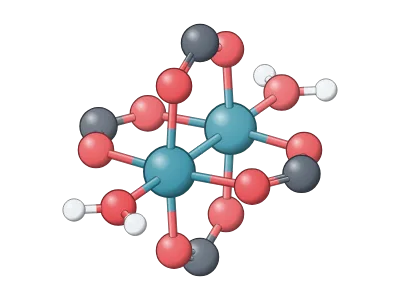
Batteries, devices and frameworks
Tools for vector drawing
| Tool | What it does |
|---|---|
| Pen and pencil | Bézier paths, smoothed freehand lines |
| Pathfinder | Union, subtract, intersect, divide and more |
| Scientific brushes | DNA (B, A or Z form), RNA, α-helices, β-strands, lipid bilayers and bead chains along any path |
| Equations | LaTeX typeset into vector outlines, chemistry with mhchem |
| Tables | Editable tables with booktabs styles |
| Lens | A magnifier callout that enlarges part of the figure |
| Artboards | Several figures, or several panels, on one canvas |
How to make a journal figure, step by step
- Open the dashboard and start a new figure, or open a template.
- Press Shift+O (or click Library) and drag objects onto the canvas; adjust them in the Design panel.
- Draw arrows and labels with the Arrow and Text tools; group each panel.
- Add panel letters and align the panels with Arrange.
- Click Download, choose TIFF or PDF, the column width in millimetres and 300–600 dpi.
Templates of real work
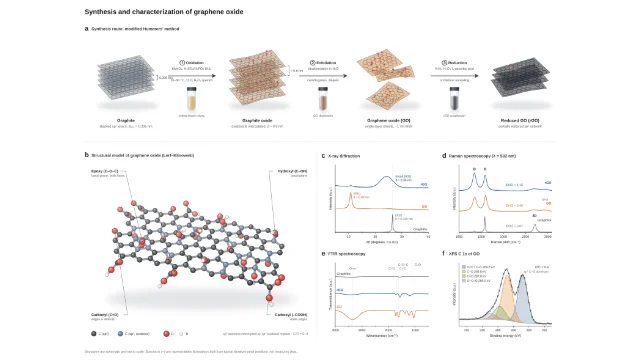
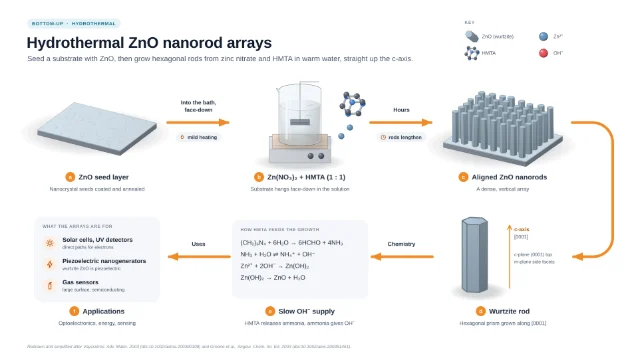
The template library holds graphical abstracts of published syntheses and devices, each built from editable objects and listing the papers it follows. Open one and it becomes your own copy.
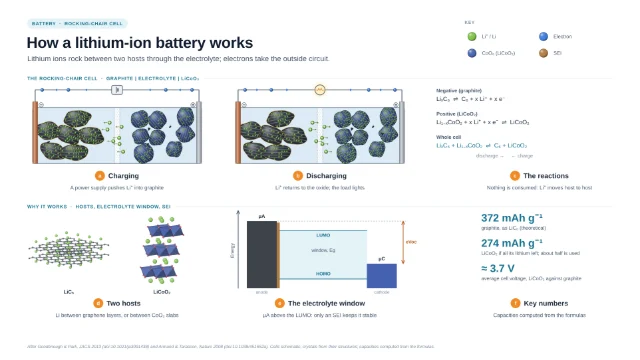
How it fits with the other apps
The Figure editor is the shared canvas of LabCanvas. Slides and Research Poster use the same editor, so a figure moves onto a slide or a poster without exporting it. Renders from the 3D Studio, setups from Optics and graphs from Graphs & statistics arrive as layers you can still change.
Frequently asked questions
Is the LabCanvas Figure editor free?
Yes. Every app, including the Figure editor, is free to start in the browser with an account. Downloading and exporting files is part of LabCanvas Pro.
Which file formats can I export for a journal?
TIFF, PDF, SVG, PNG, JPEG and WebP. Set the width in millimetres (for example 85 mm for one column or 174 mm for two) and the resolution (300, 600 or 1200 dpi); the file carries its DPI so it opens at the right size.
Can I edit the science objects after I place them?
Yes. Objects are drawn by generators, so size, colour, counts, labels and other details are settings in the Design panel, and you can change them at any time. You can also expand an object into ordinary paths.
Can I draw a molecule or add a protein?
Search any compound on PubChem from the Online tab of the Library and place it as a 2D structure or a 3D ball-and-stick model, draw your own in MolDraw, or add a protein snapshot from the Protein viewer.
Does it work like Adobe Illustrator?
The core tools will be familiar: pen, direct selection, Pathfinder, offset path, outline stroke, clipping masks, gradients, guides and smart guides. LabCanvas adds the scientific parts on top: generators, scientific brushes, glassware, equations and tables.
Try it in LabCanvas
Every app is free to start in your browser. Create an account and begin.
Start Figure editor free in your browserKeep reading

ImageJ vs LabCanvas Image Analysis: an honest comparison
ImageJ/Fiji or LabCanvas Image Analysis? Six everyday jobs done in both, six newer ones (macros, vendor files, 3D, StarDist, big images) and which to use.
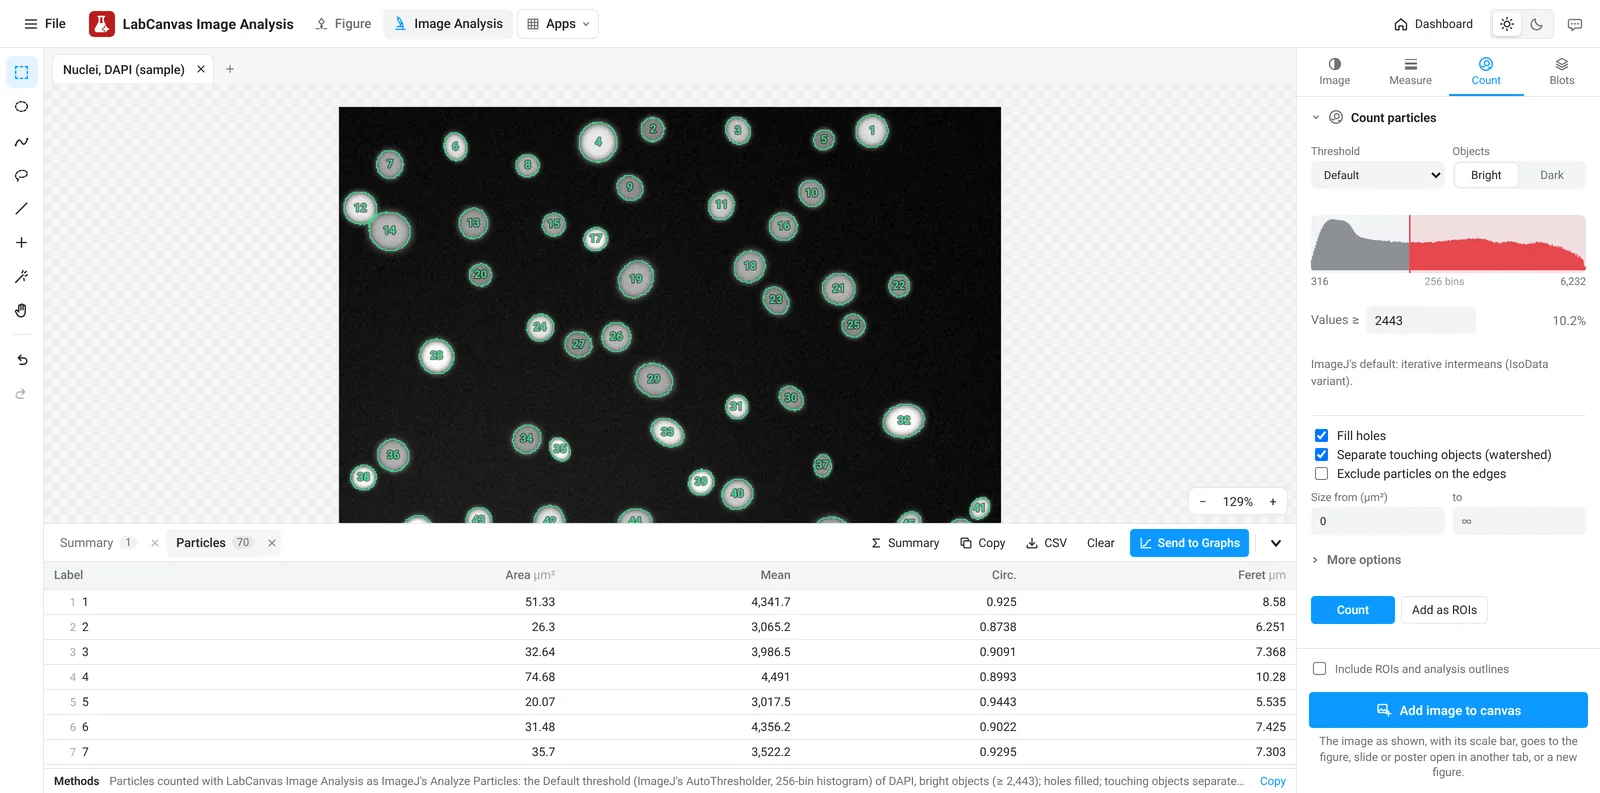
LabCanvas Image Analysis: measure microscopy images, western blots and gels in your browser
How to measure images in LabCanvas Image Analysis: guided assays (nuclear translocation, spots per cell, wound healing, FRAP, calcium, tracking, branching), western blots with a ladder and total-protein normalisation, cell counting with a trainable classifier, ROIs with ImageJ definitions, on the raw pixel values, with results sent to Graphs.
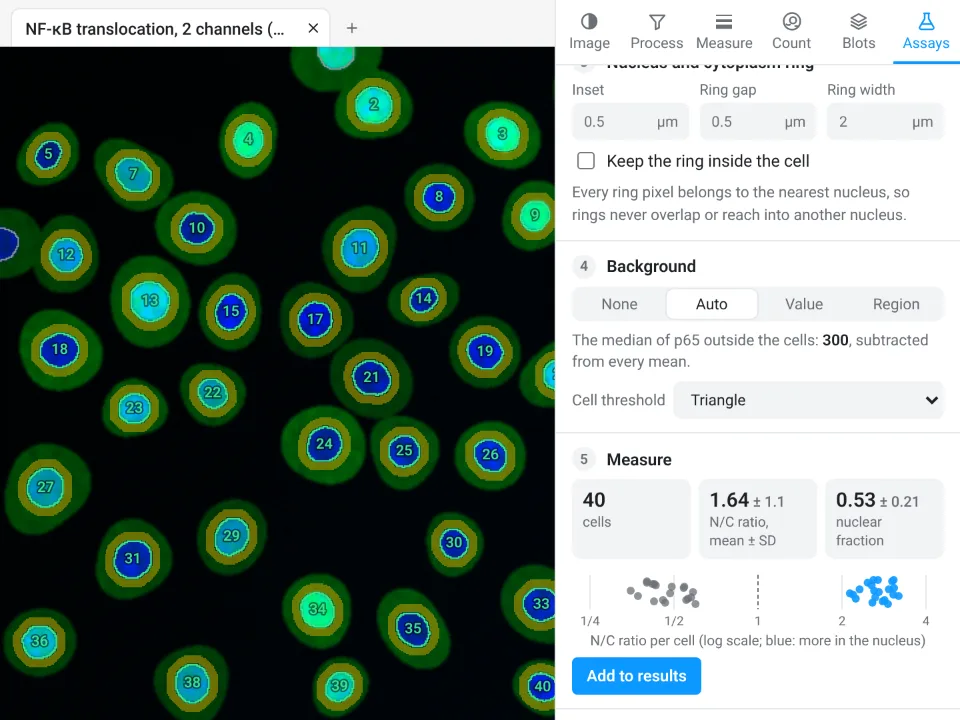
Image Analysis in LabCanvas: a complete guide to every tool and setting, with examples
Every tool in LabCanvas Image Analysis, tab by tab, with its settings and a real example: image check, display and scale, stacks and Z projection, background subtraction, filters, thresholds and binary operations, ROIs and Set measurements, Analyze Particles, a pixel classifier, spots, cell counter, western blot densitometry, colocalisation, colour deconvolution and eleven guided assays.