The LabCanvas Protein viewer: PDB structures styled for figures
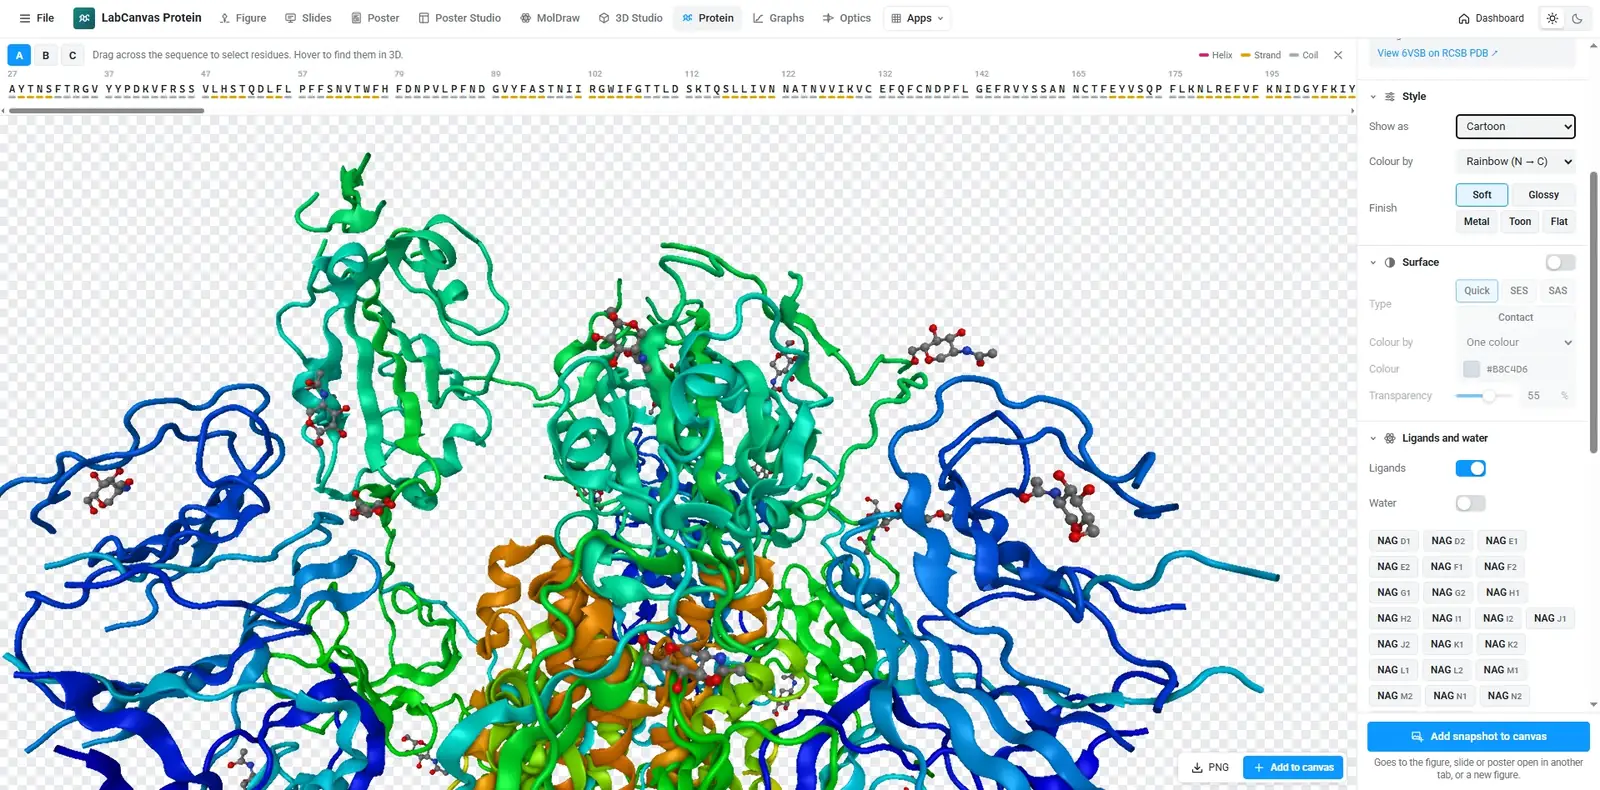
How to show a protein structure in the LabCanvas Protein viewer: load any PDB ID or your own PDB and mmCIF file, choose cartoon, surface or ball-and-stick, colour by chain or secondary structure, select residues on the sequence and snapshot a transparent PNG for your figure.
Contents
The LabCanvas Protein viewer is a focused viewer for protein structures. Load any entry of the RCSB Protein Data Bank by its ID, or your own PDB or mmCIF file, choose a style and a colouring, select residues on the sequence to give them their own look, and snapshot a transparent PNG straight into your figure.
What it is for
- Structure panels in papers: a cartoon coloured by chain with the active site in ball-and-stick.
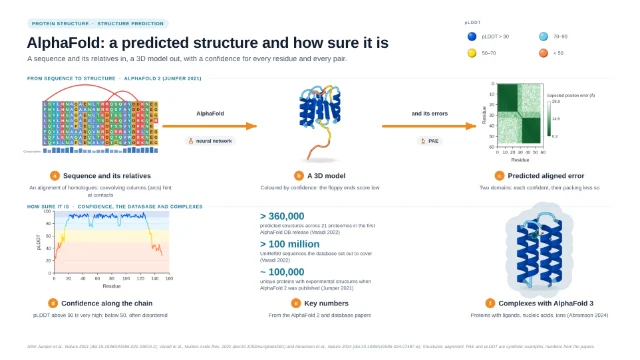
- Predicted models coloured by confidence (AlphaFold writes pLDDT into the B-factor column), next to the PAE plot made in Graphs & statistics.
- Teaching figures of secondary structure, domains and binding sites.
Styles and colourings
| Option | Choices |
|---|---|
| Representation | Cartoon, tube, trace, ball-and-stick, sticks, space-filling, lines, quick, solvent-excluded and solvent-accessible surfaces |
| Colouring | Secondary structure, chain, rainbow (N → C), element, residue type, hydrophobicity, B-factor or one colour |
| Materials | Soft, glossy, metal, toon or flat |
| Selection | Residues picked on the sequence bar get their own style and colour |
| Output | Transparent PNG snapshot into a figure, slide or poster |
How to show a protein and highlight residues
- Open the Protein viewer and enter a PDB ID such as 4HHB.
- Pick a style and colouring, for example cartoon by chain.
- Drag across residues on the sequence bar to select them.
- Give the selection its own style (ball-and-stick) and colour.
- Turn the view, then take a snapshot and add it to your figure.
Protein figures made in LabCanvas
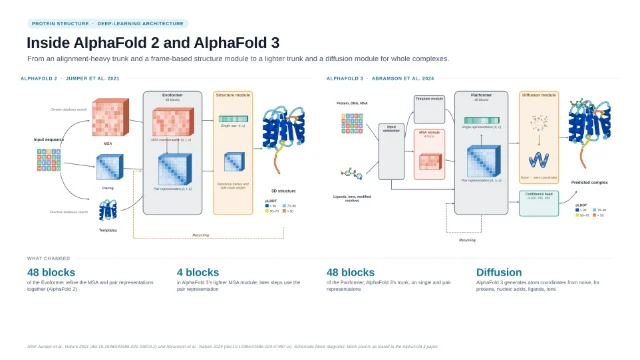
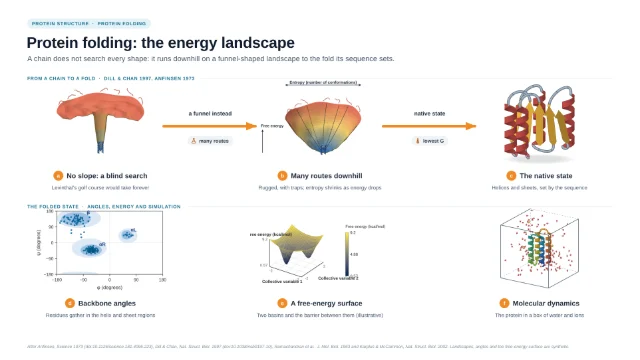
The template library includes graphical abstracts of protein structure prediction, built from protein objects, confidence plots and diagrams you can edit.
Frequently asked questions
Which structures can I open?
Any entry of the RCSB Protein Data Bank by its four-character ID (for example 4HHB for haemoglobin), or your own PDB or mmCIF file, including predicted models such as AlphaFold structures.
Which styles and colourings are there?
Cartoon, tube, trace, ball-and-stick, sticks, space-filling, lines and three kinds of surface, coloured by secondary structure, chain, rainbow (N → C), element, residue type, hydrophobicity, B-factor or one colour. AlphaFold models store pLDDT in the B-factor column, so B-factor colouring shows their confidence.
How do I highlight a binding site?
Drag across residues on the sequence bar to select them, then give the selection its own style and colour, for example ball-and-stick in orange over a grey cartoon.
How do I put the protein in a figure?
Take a snapshot: it is a transparent PNG that goes straight into your figure, slide or poster, where you can label it with the figure tools.
What powers the viewer?
The Protein viewer is built on Miew, an open-source molecular viewer, inside the LabCanvas interface.
Try it in LabCanvas
Every app is free to start in your browser. Create an account and begin.
Start Protein viewer free in your browserKeep reading

ImageJ vs LabCanvas Image Analysis: an honest comparison
ImageJ/Fiji or LabCanvas Image Analysis? Six everyday jobs done in both, six newer ones (macros, vendor files, 3D, StarDist, big images) and which to use.
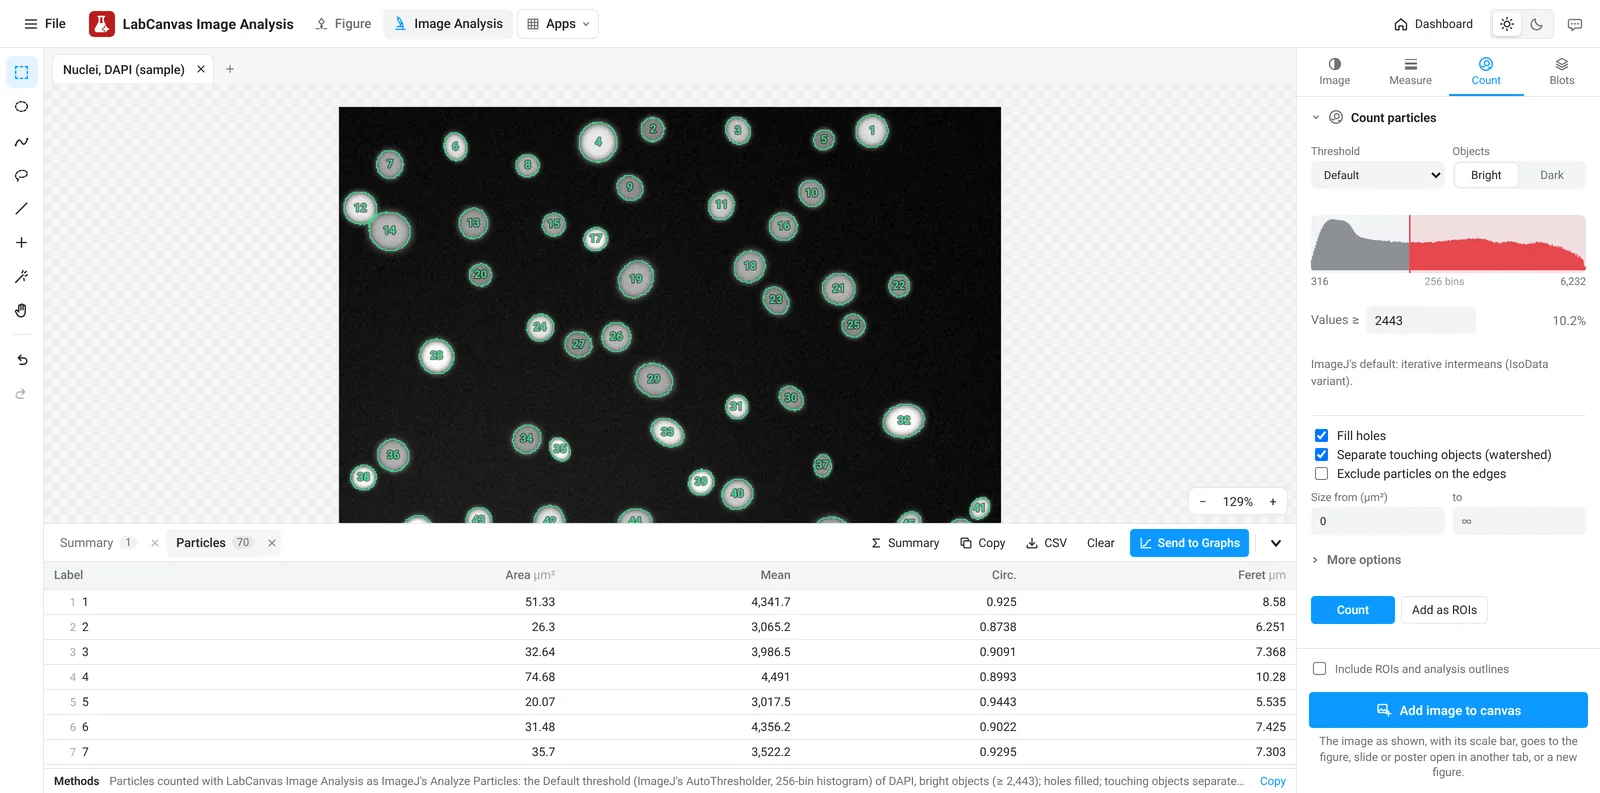
LabCanvas Image Analysis: measure microscopy images, western blots and gels in your browser
How to measure images in LabCanvas Image Analysis: guided assays (nuclear translocation, spots per cell, wound healing, FRAP, calcium, tracking, branching), western blots with a ladder and total-protein normalisation, cell counting with a trainable classifier, ROIs with ImageJ definitions, on the raw pixel values, with results sent to Graphs.
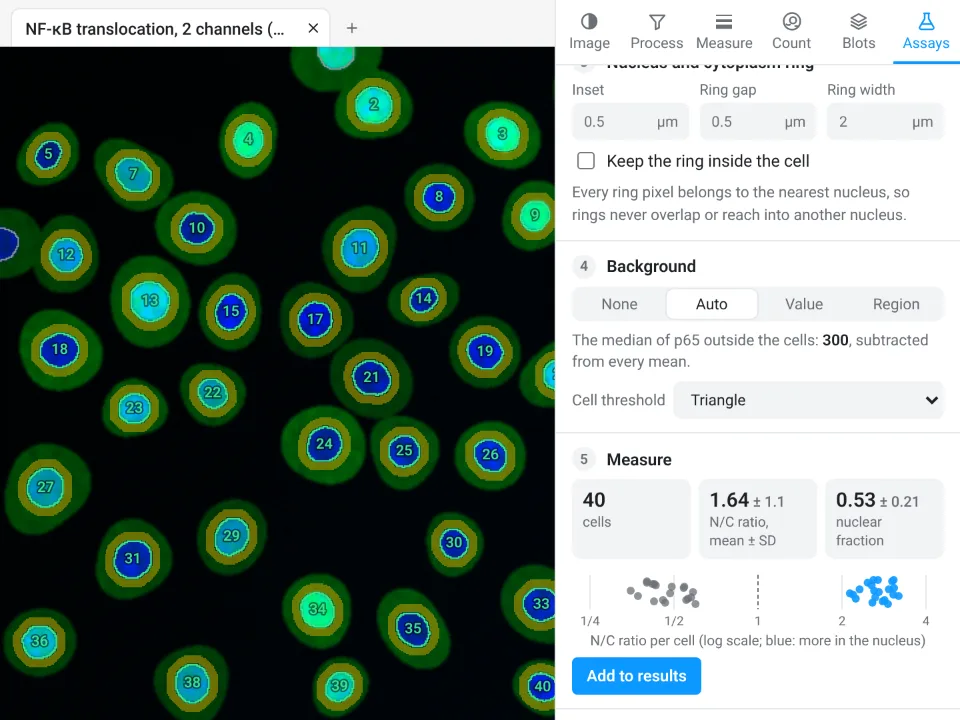
Image Analysis in LabCanvas: a complete guide to every tool and setting, with examples
Every tool in LabCanvas Image Analysis, tab by tab, with its settings and a real example: image check, display and scale, stacks and Z projection, background subtraction, filters, thresholds and binary operations, ROIs and Set measurements, Analyze Particles, a pixel classifier, spots, cell counter, western blot densitometry, colocalisation, colour deconvolution and eleven guided assays.