The LabCanvas Pixel editor: edit micrographs and photos inside your figure
How to adjust microscopy images and photos in the LabCanvas Pixel editor: crop, levels, curves and exposure, false-colour lookup tables, healing and clone stamp, selections and masks, with an edit log for your methods section.
Contents
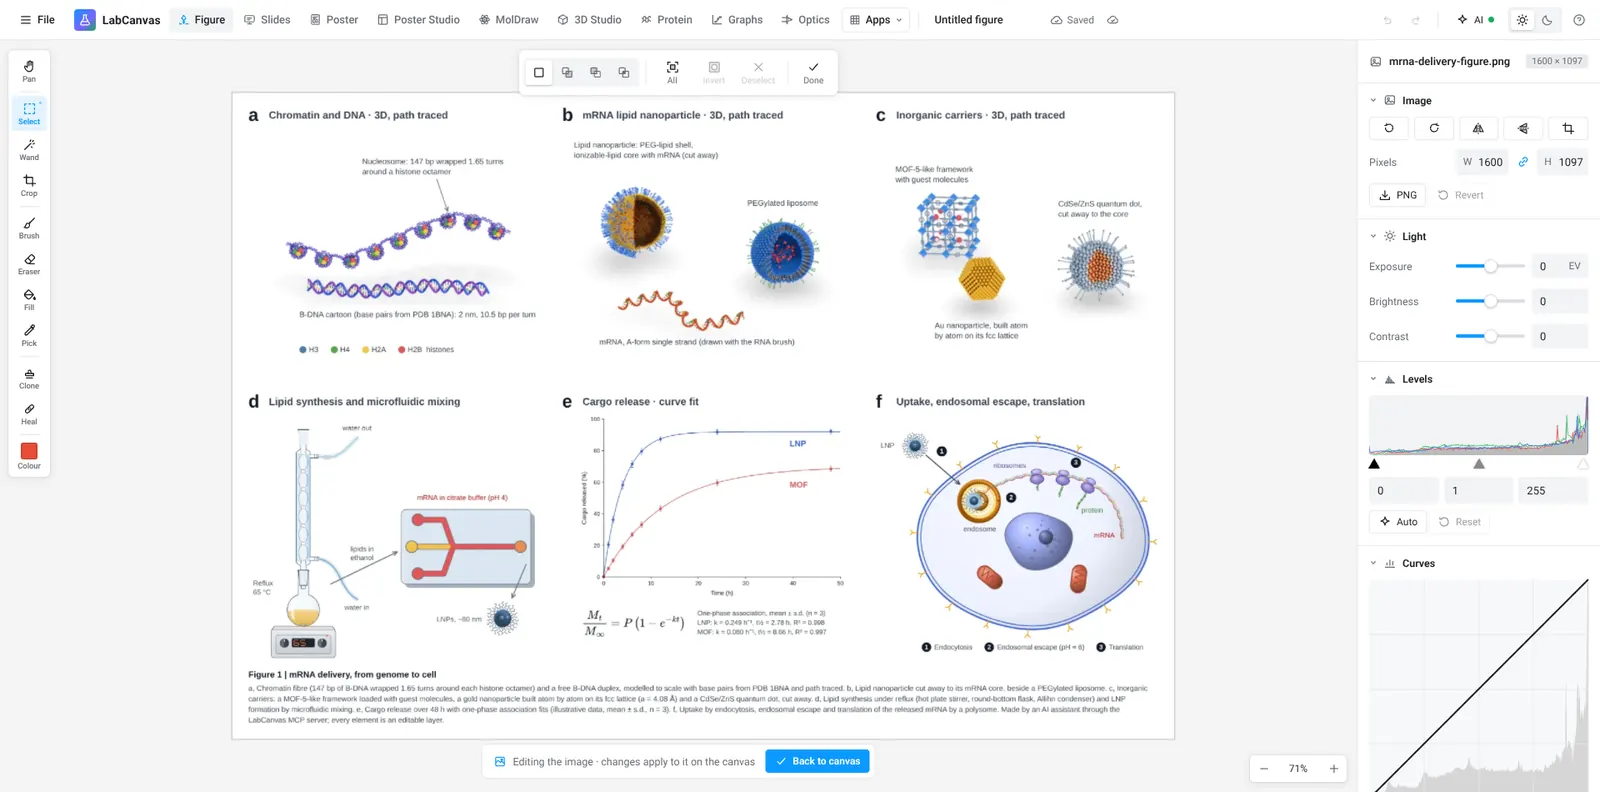
The LabCanvas Pixel editor edits the raster images in a figure, such as micrographs, gels and photos, without leaving the figure. It has crop, levels, curves and exposure, false-colour lookup tables, healing and clone stamp, selections and masks, and it keeps a log of every edit for your methods section. The edits flow back into the figure layer.
What it is for
- Micrographs: crop to the region of interest, set levels so the signal fills the range, apply a lookup table.
- Multi-panel figures: apply the same adjustments to every panel so the images stay comparable.
- Photos of setups and samples: straighten, crop, correct exposure, remove dust from the background.
Tools
| Tool | What it does |
|---|---|
| Crop and rotate | Frame the region of interest, straighten the image |
| Levels and curves | Set black and white points and the tone curve |
| Exposure | Brightness, contrast and exposure |
| Lookup tables | False-colour maps for single-channel images |
| Healing and clone stamp | Retouch photos of setups (not data) |
| Selections and masks | Limit an adjustment to part of a photo |
| Edit log | Every edit listed, for the methods section |
How to adjust a micrograph for a figure
- Place the image in your figure, right-click it and choose to edit it (or open the Pixel editor).
- Crop to the region of interest.
- Use Levels so the signal uses the full range without clipping.
- Apply a lookup table if the image is a single channel.
- Go back to the figure; the panel is updated. Copy the edit log into your methods.
Image integrity
Scientific images are data. Adjust the whole image evenly, keep the original file, never remove or add features in a data image, and describe the processing. The edit log makes the last step easy. The editorial guidelines explain how LabCanvas handles accuracy in its own content.
Frequently asked questions
Do I need to leave my figure to edit an image?
No. Right-click an image in the Figure editor and choose to edit it, or switch to the Pixel editor; the edits flow back into the figure layer.
Which adjustments are there?
Crop, rotate, levels, curves, exposure, brightness and contrast, and false-colour lookup tables, plus healing, clone stamp, selections and masks.
Is it acceptable to edit microscopy images for a paper?
Journals accept adjustments applied to the whole image (levels, contrast, colour maps) that do not hide or change features; retouching parts of a data image is generally not acceptable. Check your journal’s image integrity policy and report the adjustments in the methods.
What is the edit log for?
It lists every edit applied to an image, so you can describe the processing in your methods section and repeat it on other images.
Can I edit several panels the same way?
Yes. Apply the same adjustments to every panel so that the images stay comparable, as journals expect.
Try it in LabCanvas
Every app is free to start in your browser. Create an account and begin.
Start Pixel editor free in your browserKeep reading

ImageJ vs LabCanvas Image Analysis: an honest comparison
ImageJ/Fiji or LabCanvas Image Analysis? Six everyday jobs done in both, six newer ones (macros, vendor files, 3D, StarDist, big images) and which to use.
LabCanvas Image Analysis: measure microscopy images, western blots and gels in your browser
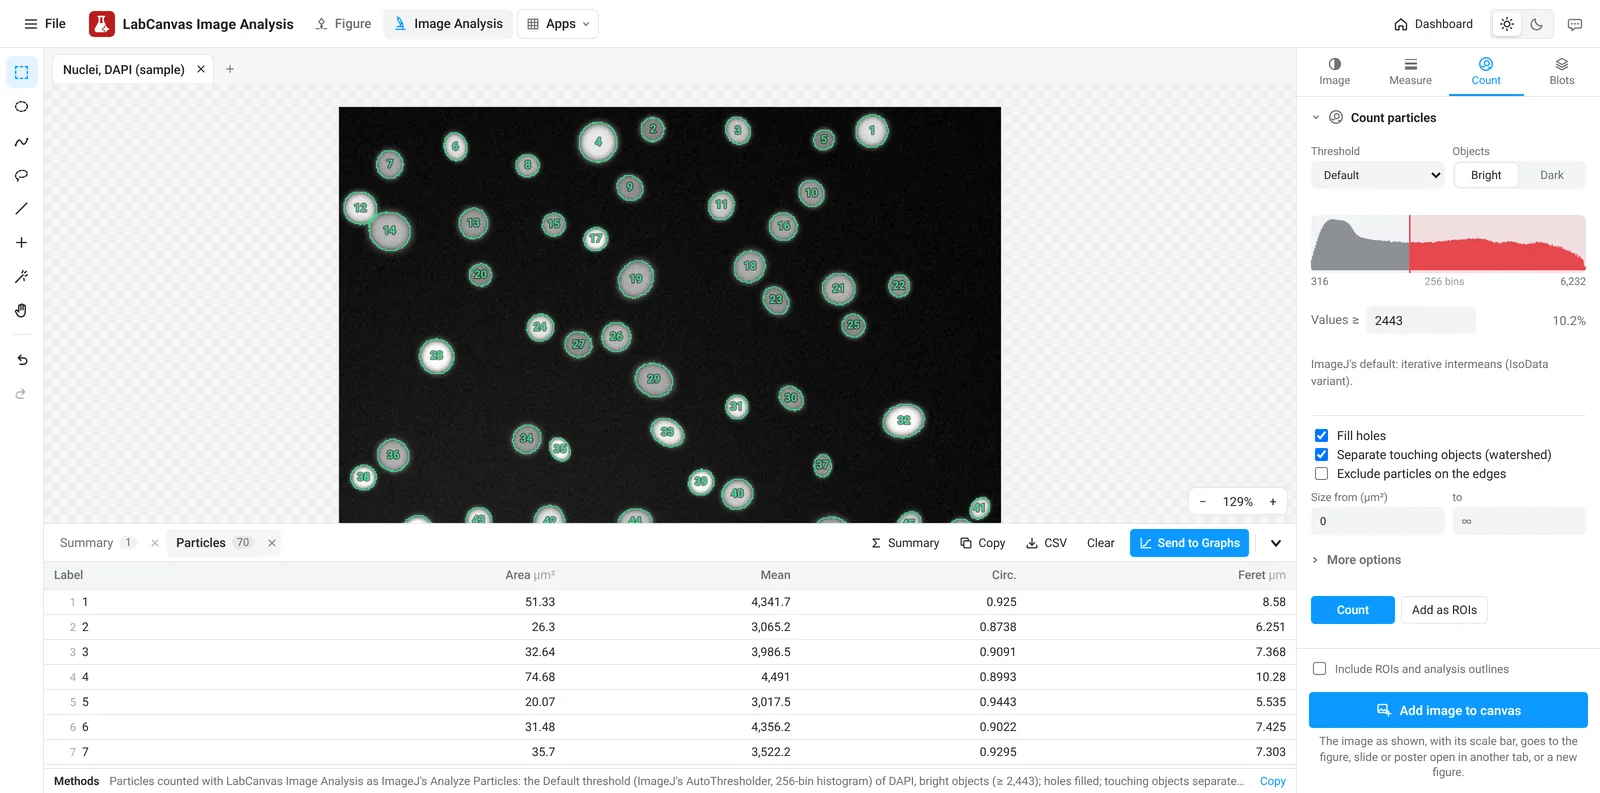
How to measure images in LabCanvas Image Analysis: guided assays (nuclear translocation, spots per cell, wound healing, FRAP, calcium, tracking, branching), western blots with a ladder and total-protein normalisation, cell counting with a trainable classifier, ROIs with ImageJ definitions, on the raw pixel values, with results sent to Graphs.
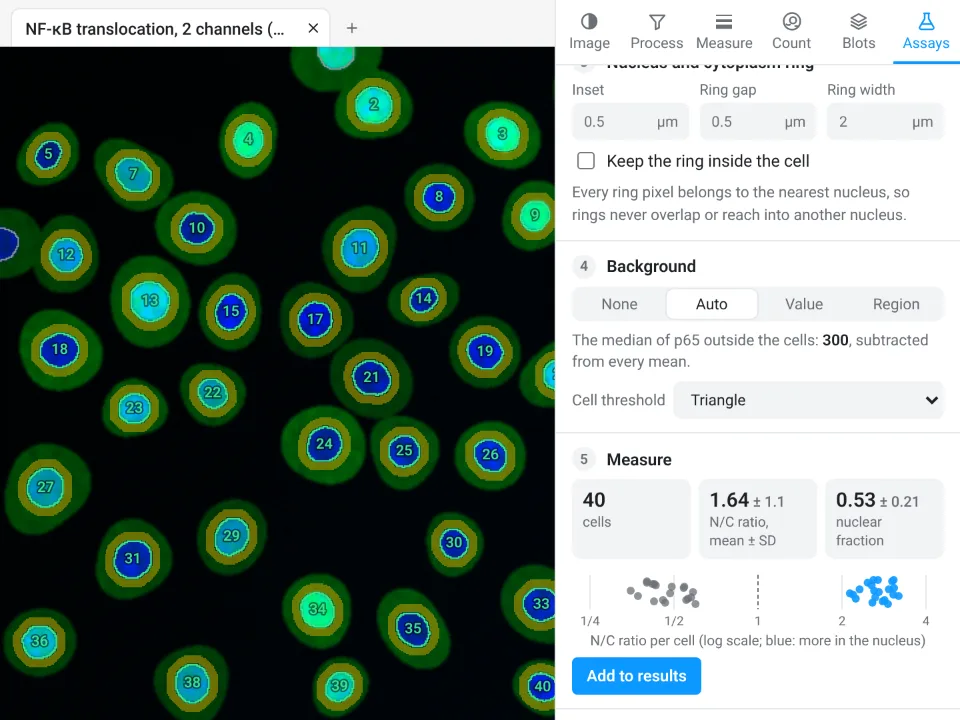
Image Analysis in LabCanvas: a complete guide to every tool and setting, with examples
Every tool in LabCanvas Image Analysis, tab by tab, with its settings and a real example: image check, display and scale, stacks and Z projection, background subtraction, filters, thresholds and binary operations, ROIs and Set measurements, Analyze Particles, a pixel classifier, spots, cell counter, western blot densitometry, colocalisation, colour deconvolution and eleven guided assays.