LabCanvas Optics: draw optical setups with the beam path simulated live
How to build optical setup diagrams in LabCanvas Optics: lasers, lenses, mirrors, beam splitters, gratings and detectors on a breadboard, rays and beams traced as you move parts, interference, ready-made setups and clean schematics for figures.
Contents
LabCanvas Optics is an app for optical setups: place lasers, lenses, mirrors, beam splitters, gratings and detectors on a breadboard and the beam path is traced live as you move them. It is a drawing tool for clean setup schematics and a quick simulator for checking that a layout works. Setups go into figures as editable vector drawings.
Ready-made setups
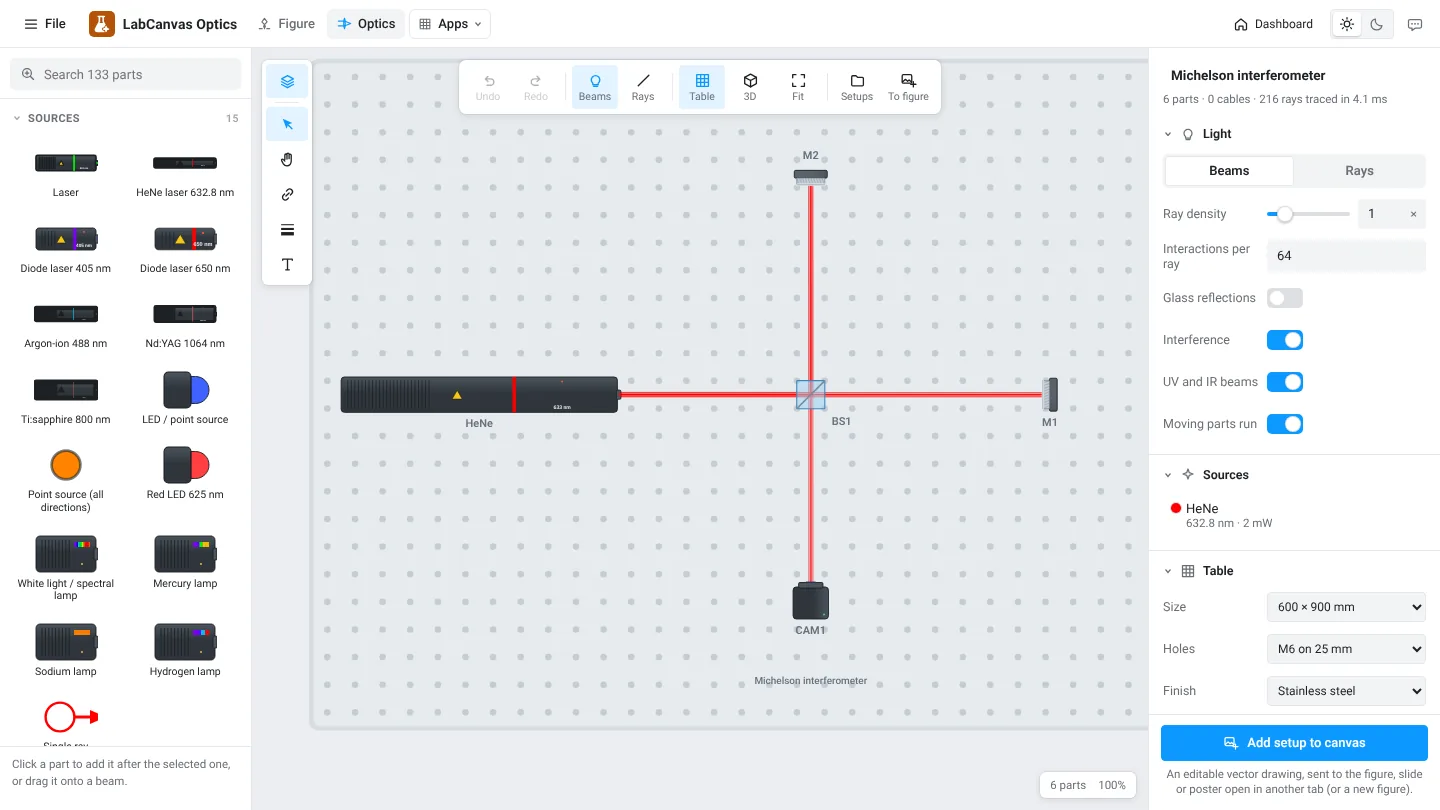
Open an example and change it, or start with an empty table.
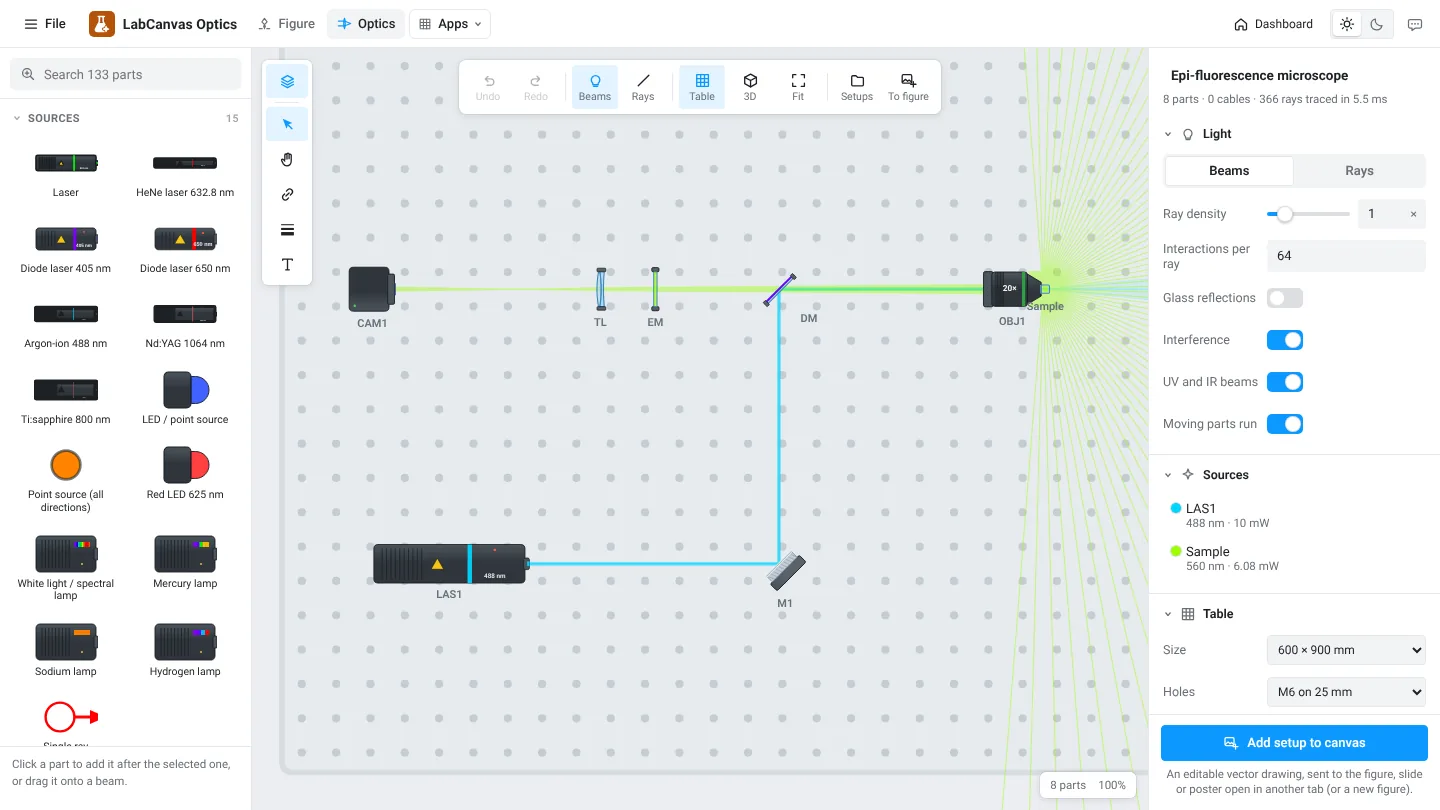
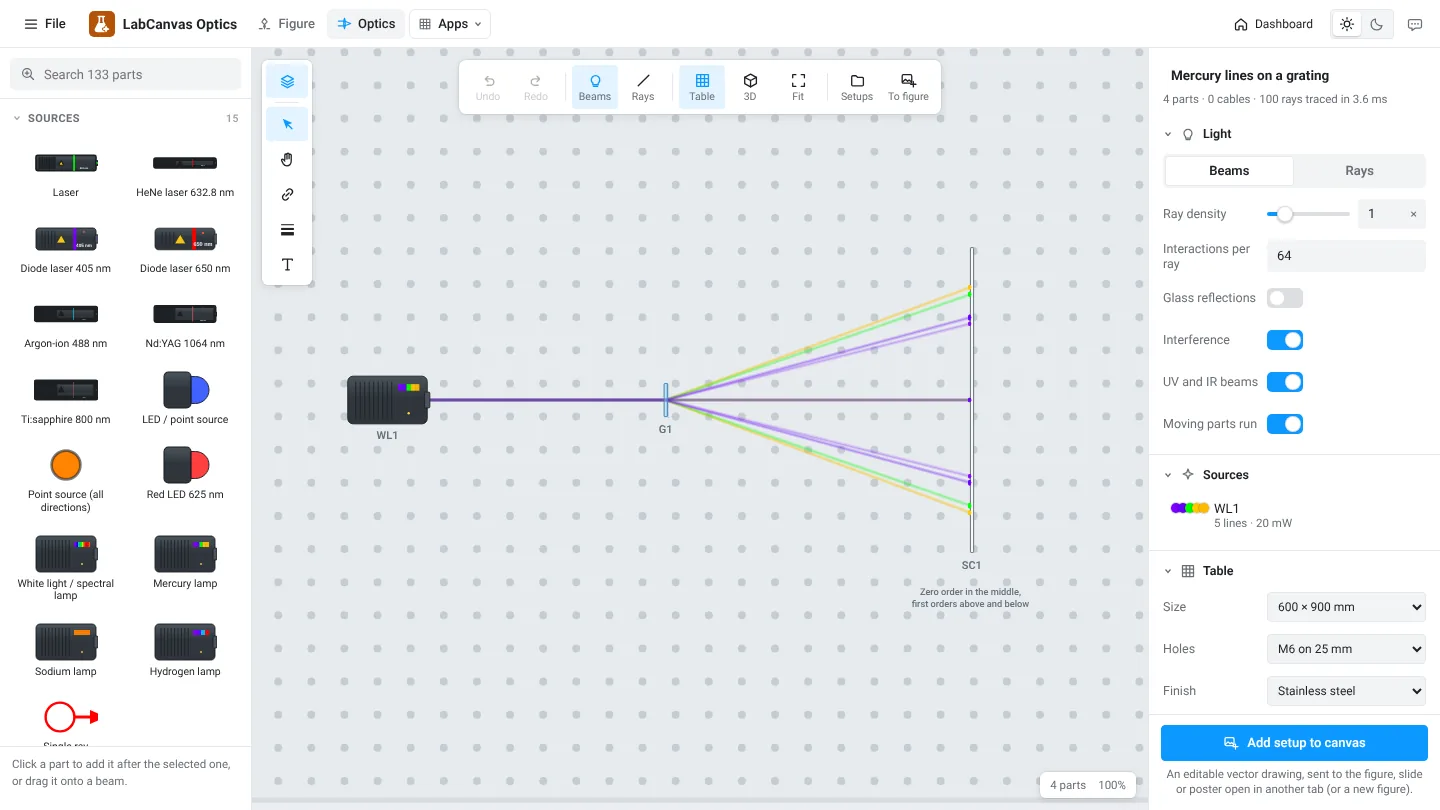
Other examples: Mach–Zehnder interferometer, Keplerian beam expander, spatial filter, prism spectrum, polarization with a half-wave plate and a polarizing beam splitter, fibre coupling, frequency doubling from 1064 to 532 nm, galvo scanning and a double slit.
Parts
| Group | Examples |
|---|---|
| Sources | HeNe 632.8 nm, diode lasers, argon-ion, Nd:YAG, Ti:sapphire, LEDs, mercury and sodium lamps |
| Lenses | Plano-convex, bi-convex, aspheres, achromatic doublets, cylindrical and ball lenses, objectives, axicons |
| Mirrors | Metal and dielectric, spherical, parabolic, retroreflectors, galvo and polygon scanners, DMDs |
| Splitters and prisms | Cubes, plates, pellicles, polarizing beam splitters, dispersive and right-angle prisms, gratings |
| Filters and apertures | Iris, slits and pinholes, ND and colour filters, long-pass and laser-line filters |
| Detectors | Photodiodes, quadrant photodiodes, power meters, cameras, spectrometers |
| Electronics | Amplifiers, lock-in amplifiers, PID controllers, oscilloscopes, signal generators |
How to draw a setup
- Open Optics and pick an example or an empty table.
- Click a part in the left panel to add it after the selected one, or drag it onto a beam.
- Move and rotate parts; the beams follow live. Switch between Beams and Rays.
- Label parts and add dimension lines, arrows and enclosures.
- Click Add setup to canvas to send it to your figure.
Beams, rays and interference
The Beams view draws beams as coloured bands, as in a paper schematic. The Rays view shows the individual rays, useful for checking focusing and aberrations. With coherent sources and Interference on, the camera in an interferometer shows fringes that move when a mirror moves.
Frequently asked questions
What does LabCanvas Optics simulate?
It traces rays and beams through the parts as you place them: refraction in lenses and prisms, reflection, splitting, diffraction by gratings and slits, filters and absorption, with interference for coherent sources.
Which parts are there?
Over 130: lasers and lamps, lenses and objectives, mirrors, beam splitters, prisms, gratings, filters, apertures, modulators, detectors such as photodiodes, cameras and spectrometers, fibre couplers, and electronics such as amplifiers, lock-ins and oscilloscopes.
Are there example setups?
Yes: a Michelson and a Mach–Zehnder interferometer, a beam expander, a spatial filter, a prism spectrum, mercury lines on a grating, an epi-fluorescence microscope, polarization optics, fibre coupling, frequency doubling, galvo scanning and a double slit.
How do I put the setup in my paper?
Click Add setup to canvas. It becomes an editable vector drawing in the figure, slide or poster open in another tab, or in a new figure.
Is there a 3D view?
Yes. Switch to 3D to see the setup on the table in perspective.
Try it in LabCanvas
Every app is free to start in your browser. Create an account and begin.
Start Optics free in your browserKeep reading

ImageJ vs LabCanvas Image Analysis: an honest comparison
ImageJ/Fiji or LabCanvas Image Analysis? Six everyday jobs done in both, six newer ones (macros, vendor files, 3D, StarDist, big images) and which to use.
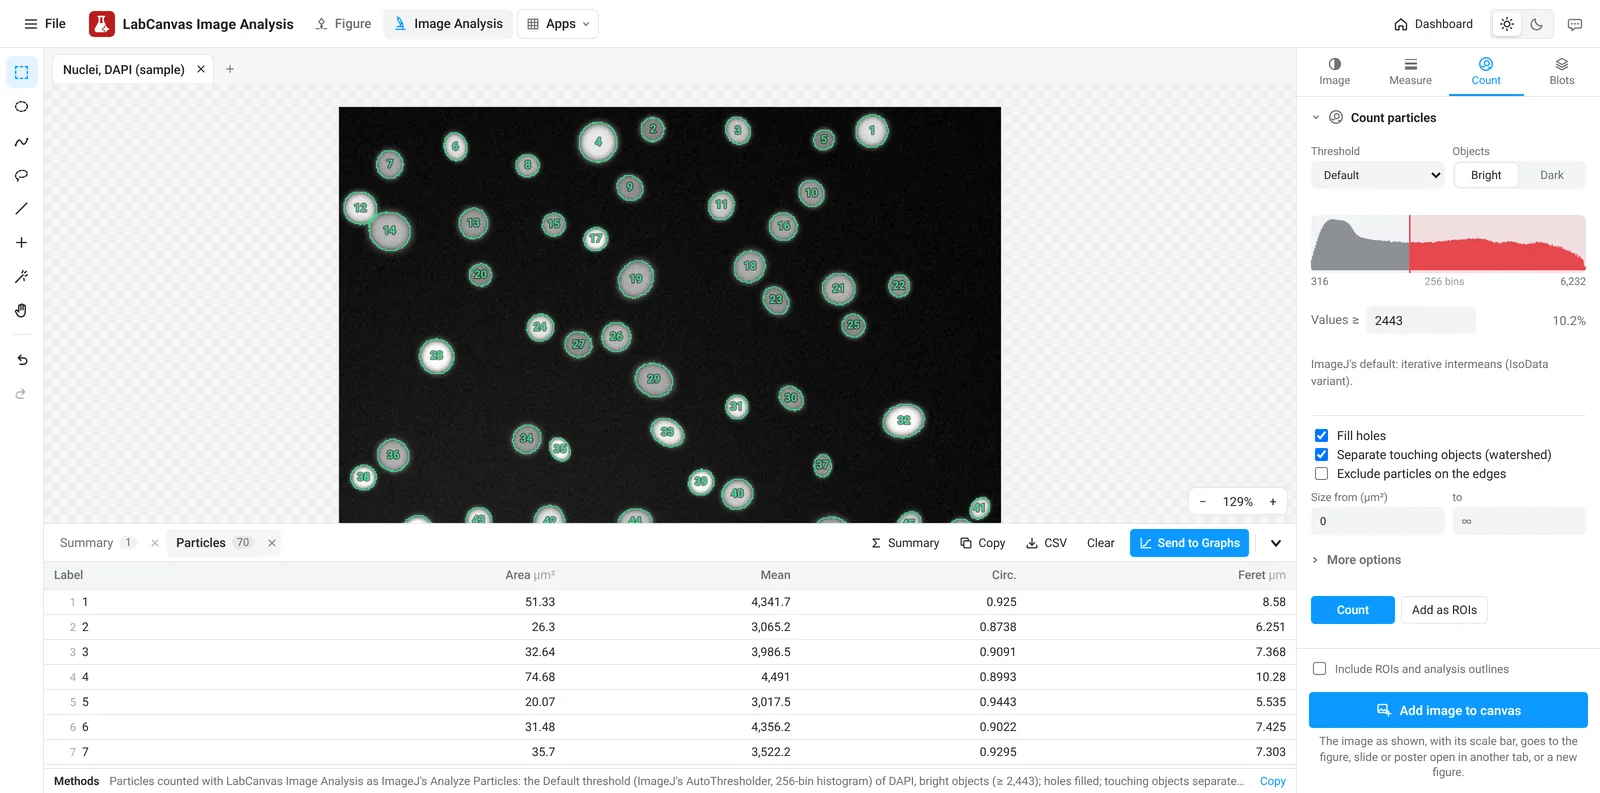
LabCanvas Image Analysis: measure microscopy images, western blots and gels in your browser
How to measure images in LabCanvas Image Analysis: guided assays (nuclear translocation, spots per cell, wound healing, FRAP, calcium, tracking, branching), western blots with a ladder and total-protein normalisation, cell counting with a trainable classifier, ROIs with ImageJ definitions, on the raw pixel values, with results sent to Graphs.
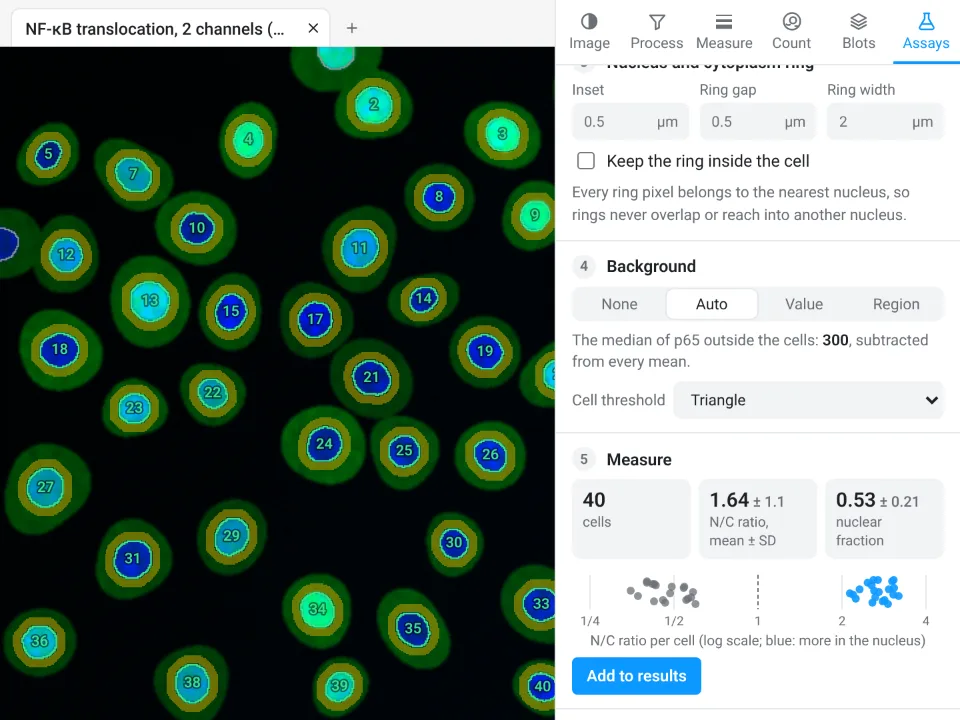
Image Analysis in LabCanvas: a complete guide to every tool and setting, with examples
Every tool in LabCanvas Image Analysis, tab by tab, with its settings and a real example: image check, display and scale, stacks and Z projection, background subtraction, filters, thresholds and binary operations, ROIs and Set measurements, Analyze Particles, a pixel classifier, spots, cell counter, western blot densitometry, colocalisation, colour deconvolution and eleven guided assays.