LabCanvas Slides: scientific presentations built from editable figures
How to build lab meetings, conference talks and lectures in LabCanvas Slides: a slide strip, layouts and themes, transitions and motion paths, speaker notes, full-screen presenting and a vector PDF of the deck.
Contents
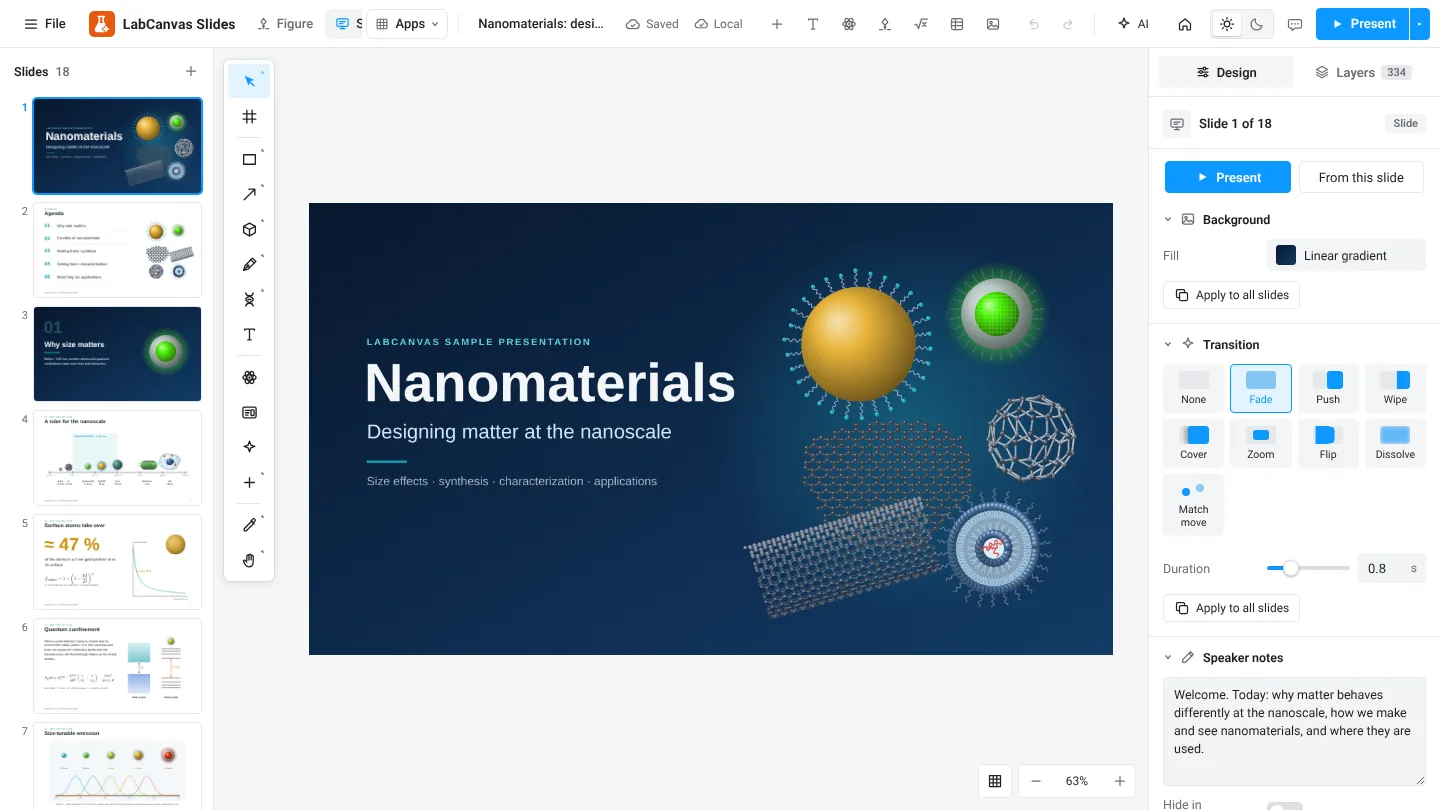
LabCanvas Slides is a presentation app built on the LabCanvas Figure editor. Every drawing tool, science object, equation and graph works on a slide, so the figures in a talk are the same editable figures as in the paper. It has a PowerPoint-style slide strip, layouts and themes, transitions with match move and motion paths, speaker notes, full-screen presenting and export of the whole deck as one vector PDF.
Why build talks on a figure editor
Scientific talks are mostly figures. In a usual workflow the figure is made in one program and pasted into PowerPoint as a picture, so every correction means going back, exporting again and replacing the picture. In Slides the figure stays a figure: change a colour, move a label or update a graph on the slide itself.
What is in the app
| Part | What it does |
|---|---|
| Slide strip | Add (Ctrl+M), duplicate, reorder and hide slides |
| Layouts and themes | Title, section, content and picture layouts; colour themes for the deck |
| Transitions | Fade, push, wipe, cover, zoom, flip, dissolve and match move |
| Builds and motion paths | Objects appear in steps and can travel along a path |
| Speaker notes | Notes per slide, shown while you present |
| Export | The whole deck as one vector PDF, or a slide as PNG |
How to build a talk
- Open Slides from the dashboard or the Apps menu.
- Add slides with Ctrl+M and pick a layout.
- Paste figures from the Figure editor, or draw on the slide with the same tools and Library.
- Choose a transition and write speaker notes in the slide panel.
- Press F5 to present, or export the deck as one PDF for the conference computer.
Figures that suit slides
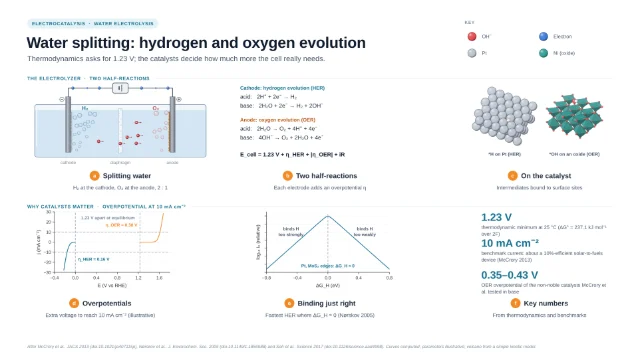
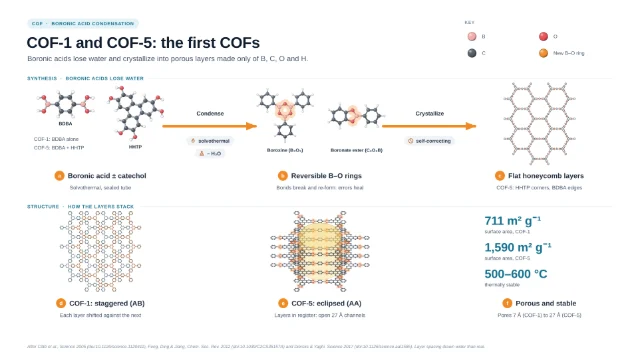
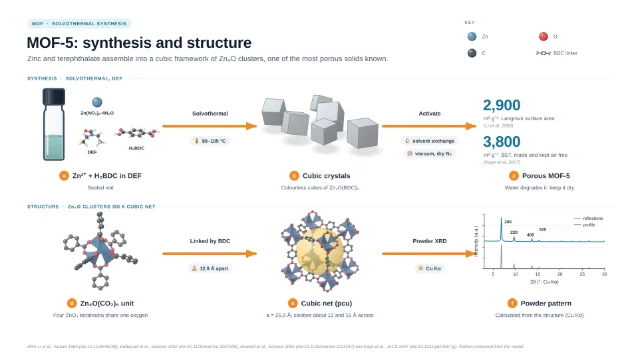
Graphical abstracts and schematics read well from the back of a room. Start from a template and simplify it for the slide.
Tips for scientific talks
- One message per slide: a title that states the finding, then the figure that shows it.
- Build complex figures in steps so the audience follows the logic.
- Use match move between two slides that show the same object to keep the viewer oriented.
- Export a PDF backup in case the conference computer has no internet connection.
Frequently asked questions
Can I open PowerPoint files in LabCanvas Slides?
Slides is its own presentation app built on the LabCanvas editor. Build the deck in LabCanvas and export it as one vector PDF, which every computer and projector can show.
Which transitions are there?
None, fade, push, wipe, cover, zoom, flip, dissolve and match move, which moves objects that appear on both slides into their new place. Objects can also follow a motion path.
How do I present?
Press F5 or click Present. Full-screen presenting shows the slides with their transitions; speaker notes are written per slide in the right panel.
Can I reuse a figure from the Figure editor?
Yes. Copy it in the Figure editor and paste it on a slide with Ctrl+V. It stays a vector figure with editable layers, not a flat picture.
Is there a sample presentation?
Yes: open Slides with the nanomaterials sample, an 18-slide deck on designing matter at the nanoscale, and change it into your own.
Try it in LabCanvas
Every app is free to start in your browser. Create an account and begin.
Start Slides free in your browserKeep reading

ImageJ vs LabCanvas Image Analysis: an honest comparison
ImageJ/Fiji or LabCanvas Image Analysis? Six everyday jobs done in both, six newer ones (macros, vendor files, 3D, StarDist, big images) and which to use.
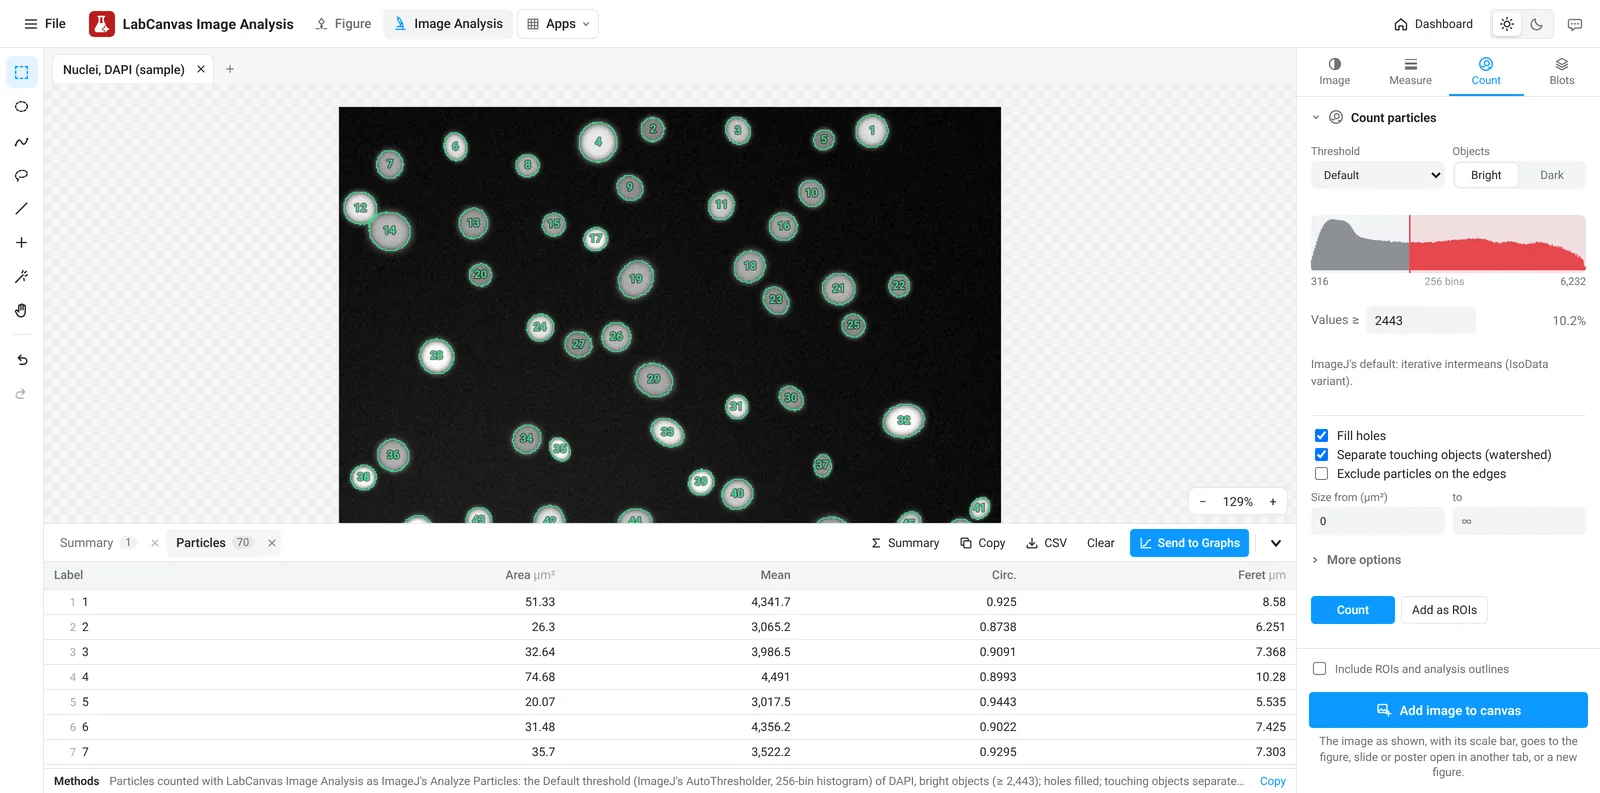
LabCanvas Image Analysis: measure microscopy images, western blots and gels in your browser
How to measure images in LabCanvas Image Analysis: guided assays (nuclear translocation, spots per cell, wound healing, FRAP, calcium, tracking, branching), western blots with a ladder and total-protein normalisation, cell counting with a trainable classifier, ROIs with ImageJ definitions, on the raw pixel values, with results sent to Graphs.
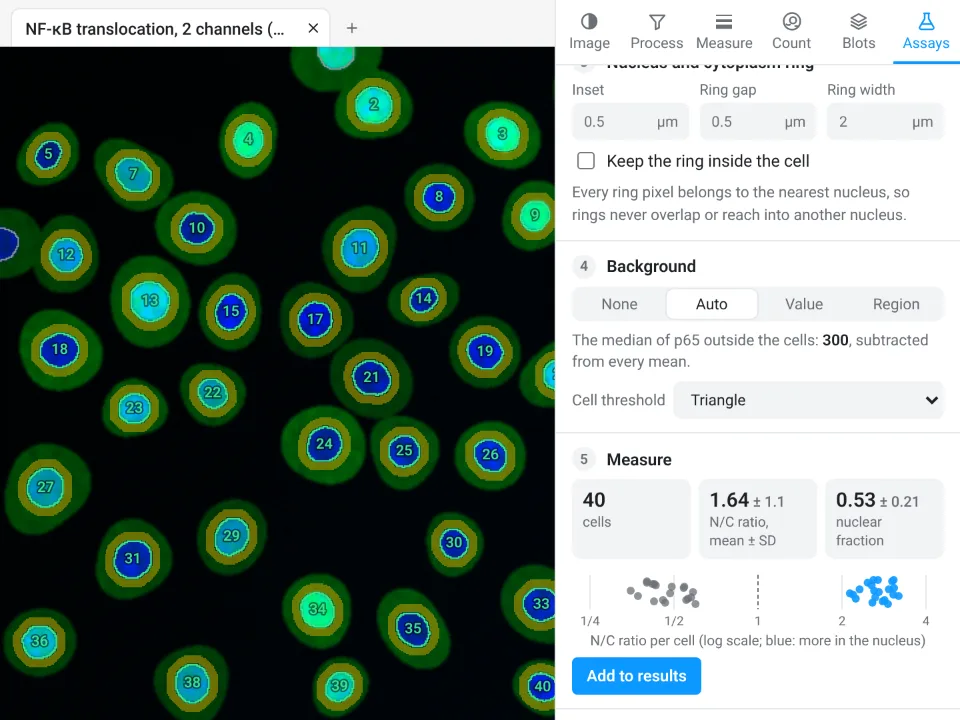
Image Analysis in LabCanvas: a complete guide to every tool and setting, with examples
Every tool in LabCanvas Image Analysis, tab by tab, with its settings and a real example: image check, display and scale, stacks and Z projection, background subtraction, filters, thresholds and binary operations, ROIs and Set measurements, Analyze Particles, a pixel classifier, spots, cell counter, western blot densitometry, colocalisation, colour deconvolution and eleven guided assays.