A free GraphPad Prism alternative: graphs and statistics in your browser
Looking for a free GraphPad Prism alternative? What LabCanvas Graphs does (data tables, t tests, ANOVA, curve fits, survival, cluster analysis, 70 graph types checked against SciPy), what it does not, and when Prism is still the better choice.
Contents
If you are looking for a GraphPad Prism alternative, you probably want the Prism way of working (data tables, a test, a graph with significance brackets) without a desktop licence, or you want your graphs to go straight into a figure, slide or poster. GraphPad Prism is the standard tool for this in many biology and pharmacology labs, and for good reason. LabCanvas Graphs & statistics follows the same model in the browser. This page sets out honestly what it covers, what it does not, and when Prism is still the better choice.
The short answer
| If you mainly need | Better fit | Why |
|---|---|---|
| Column, XY, grouped, survival and contingency tables with t tests, ANOVA, regression and survival tests | Either | Both work from typed data tables; LabCanvas runs in the browser with nothing to install |
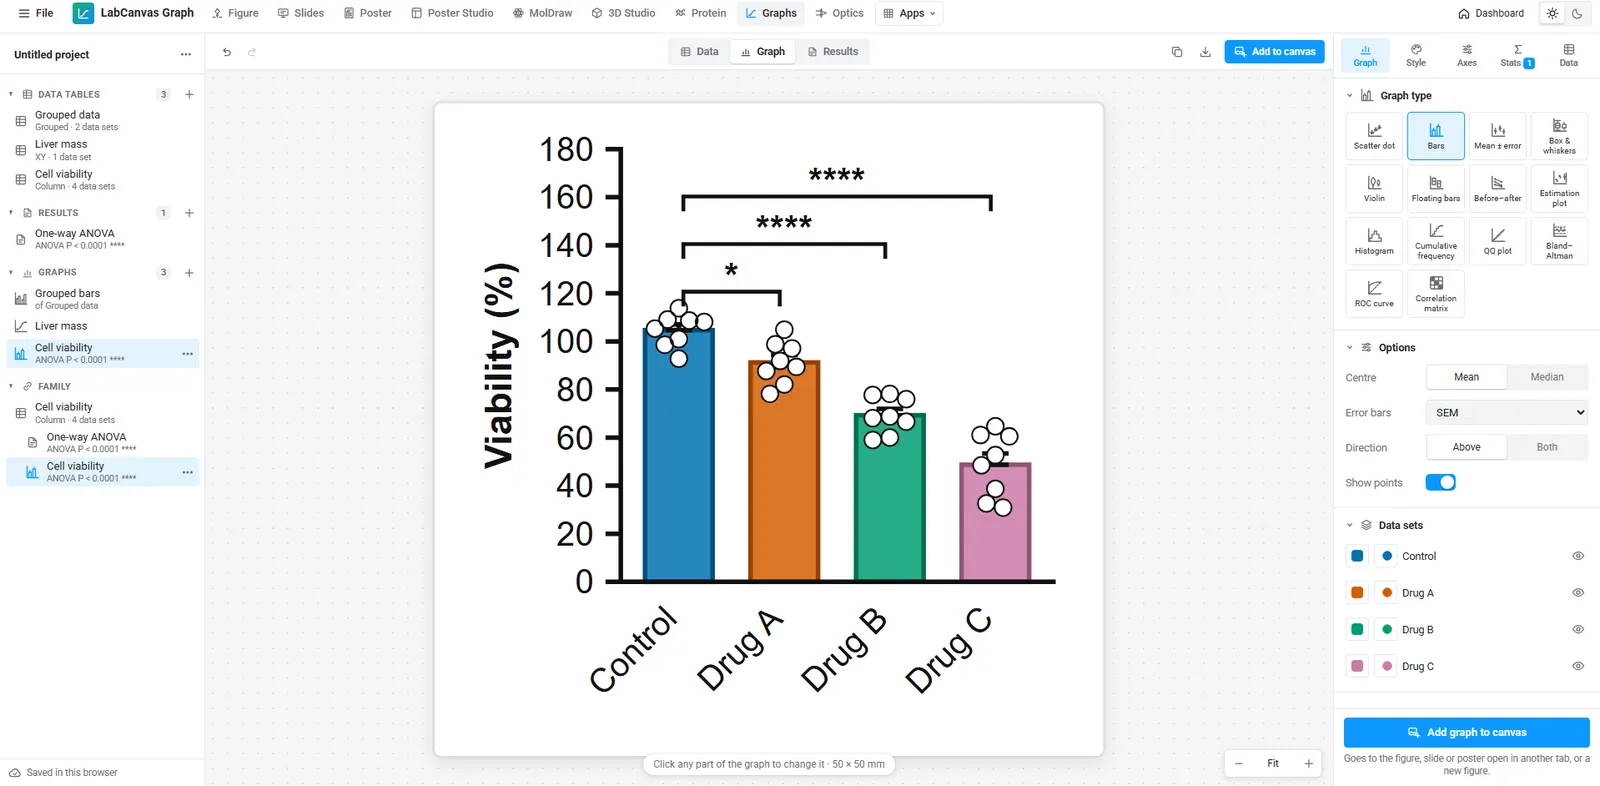
| Graphs that go into a figure, slide or poster and stay linked to their data | LabCanvas | Add to figure places the graph as editable vectors in the figure editor; a corrected value updates the figure |
| Statistics you can check against open-source references | LabCanvas | Every analysis is tested against SciPy, statsmodels, lifelines and R (more than 42,000 automated checks) (how it is validated) |
| Reopening existing Prism projects with their graphs and analyses | Prism | LabCanvas imports the data tables of .prism and .pzfx files (and saves tables as .pzfx), but not Prism's graphs or analyses |
| The exact analyses and reports your lab, journal or regulator already expects from Prism | Prism | Established workflows and shared files matter more than any one feature |
| Plans, prices and licence terms | Check each | See GraphPad’s site for Prism and the LabCanvas pricing page |
Feature by feature
| Feature | LabCanvas Graphs & statistics |
|---|---|
| Data tables | Column, XY, grouped, survival, contingency, parts of whole, nested and multiple variables; values as replicates or as mean with SD/SEM and N; paste from Excel, or import CSV, Excel (.xlsx) and Prism (.prism and .pzfx) files |
| Compare two groups | Unpaired, Welch and paired t tests with effect sizes, Mann–Whitney and Wilcoxon with Hodges–Lehmann estimates, two-sample Kolmogorov–Smirnov test, nested t test |
| Compare several groups | One-, two- and three-way ANOVA, repeated measures and mixed-effects models, nested ANOVA, Welch and Brown–Forsythe ANOVA, Kruskal–Wallis, Friedman; Tukey, Dunnett, Šidák, Holm–Šidák, Games–Howell, Dunnett T3 and other post-hoc tests |
| Curve fitting | 76 built-in equations (dose–response incl. 5PL, biphasic, bell-shaped, operational model, Gaddum/Schild and allosteric EC50 shifts; saturation, competitive and kinetic binding; enzyme kinetics and inhibition incl. Morrison Ki; exponential, growth incl. Gompertz and Weibull, Boltzmann, peaks, sine waves, polynomials; 4PL and 5PL standard curves) or your own; weighting, constraints, shared parameters across data sets, model comparison by F test or AICc, profile-likelihood CIs, confidence and prediction bands, ROUT outlier removal, residual plots |
| Standard curves | Interpolate unknowns (ELISA, protein assays) with 95% CIs, from any curve, line or spline |
| Regression | Simple and multiple linear, logistic, Poisson, Deming; compare slopes and intercepts; correlation matrices (Pearson, Spearman, Kendall); PCA |
| Survival | Kaplan–Meier curves with numbers at risk, log-rank (incl. trend and pairwise), median survival with CI, Cox proportional hazards regression (Efron, Breslow or exact ties) with predicted survival curves for chosen covariate values |
| Contingency | Chi-square (incl. trend), Fisher’s exact test, odds and risk ratios, sensitivity and specificity, McNemar, Cohen’s kappa (unweighted and weighted) for rater agreement |
| Cluster analysis | Hierarchical clustering (seven distances, seven linkage methods) drawn as a clustered heat map with dendrograms; k-means with elbow and silhouette plots |
| Simulation | Simulate XY data from any equation with Gaussian or Poisson scatter, column data from six distributions, or a family of theoretical curves; Monte Carlo simulation of any analysis (power, bias and spread of fitted values) |
| More | Outliers (ROUT, Grubbs), normality tests, area under curve, transforms and normalization, frequency distributions, false discovery rate, sample size and power |
| Graph types | About 70, including nested scatter, residual, forest, PCA plots and clustered heat maps (see them all) |
| Axes and styling | Linear, log, ln, probability and logit axes, axis breaks; hatched and dotted bar fills for black-and-white print; values or n written on bars; copy formatting from one graph to another |
| Layouts | Several graphs on one page in a grid, with panel letters (A, B, C…), exported as one picture |
| Export | PDF (600 dpi), TIFF (300 to 1200 dpi) and PNG at journal sizes; results to Excel |
| Significance | Brackets and stars placed from the test results |
| Batch work | Apply an analysis and its graph to every similar table in one step, import many files at once, and compare the key numbers of all of them side by side (copy or CSV) |
| In a figure | Graphs go into the figure editor, Slides and Research Poster as editable vectors linked to their data |
| Runs on | Any modern browser on Windows, macOS, Linux or a Chromebook |
| Price | Free with an account (up to 3 designs); downloads and unlimited designs with LabCanvas Pro |
A one-way ANOVA, step by step
- Open Graphs & statistics and choose Bars with points (a column table).
- Paste your values, one column per group, straight from Excel.
- In the Stats tab choose one-way ANOVA with Tukey (all pairs) or Dunnett (each group against control).
- Significance brackets appear on the graph; set their style and which comparisons to show.
- Click Add to figure to put the graph in a figure with your images and schematics, still linked to the data.
When Prism may still be the better choice
- You have years of Prism projects whose graphs, analyses and templates you reopen and rerun (LabCanvas brings in their data tables only).
- Your lab, core facility or regulator expects Prism output in a particular format.
- You need an analysis LabCanvas does not offer. Check the Graphs guide for the full list before you move.
Free calculators for single questions
For one calculation you do not need a project at all: the IC50 / EC50 calculator, ELISA standard curve, qPCR ΔΔCt and cell doubling time calculators run in the browser with no account, and each page shows the method and a worked example.
Frequently asked questions
Is there a free alternative to GraphPad Prism?
LabCanvas Graphs & statistics works the same way (typed data tables, analyses and graphs in one project) and runs in the browser. Every app is free to use with an account, up to 3 designs; downloads and unlimited designs are part of LabCanvas Pro. For a single calculation, the free tools such as the IC50 calculator need no account.
Can LabCanvas run ANOVA with post-hoc tests?
Yes: one-, two- and three-way ANOVA, repeated measures (with a mixed-effects model when values are missing), nested ANOVA, Welch and Brown–Forsythe ANOVA, Kruskal–Wallis and Friedman, with Tukey, Dunnett, Šidák, Holm–Šidák, Games–Howell, Dunnett T3 and other post-hoc comparisons. Significance brackets are drawn on the graph from the test results.
Are the statistics accurate?
Every analysis is checked against SciPy, statsmodels, lifelines and R in more than 42,000 automated tests, and every graph type is drawn from reference data and read back point by point in 3,473 more.
Can I open my Prism files (.prism and .pzfx)?
Yes, the data tables: File › Import data reads Prism 10 project files (.prism) and Prism XML files (.pzfx): column, XY, grouped, survival, contingency, parts of whole, nested and multiple-variables tables, with replicates, mean ± SD/SEM/CV and N, titles and excluded values; and Excel .xlsx workbooks. Graphs and analyses inside a Prism file are not imported (Prism keeps graphs in a closed format); redo them in LabCanvas. You can also save your tables as .pzfx for colleagues who use Prism.
Can I fit a dose–response curve and get the IC50?
Yes. Nonlinear regression includes four-parameter dose–response (log(agonist) and log(inhibitor)) with the IC50 or EC50 and its confidence interval. The free IC50 calculator does the same for one curve without an account.
Does LabCanvas do cluster analysis and simulations like Prism?
Yes. Hierarchical clustering draws a clustered heat map with dendrograms (seven distances, seven linkage methods, cut into clusters by number or height), and k-means comes with elbow and silhouette plots. You can simulate XY data from any equation, column data from a distribution or a family of theoretical curves, and run a Monte Carlo simulation of any analysis to estimate the power of a design.
Try it in LabCanvas
Every app is free to start in your browser. Create an account and begin.
Open the LabCanvas dashboardKeep reading

ImageJ vs LabCanvas Image Analysis: an honest comparison
ImageJ/Fiji or LabCanvas Image Analysis? Six everyday jobs done in both, six newer ones (macros, vendor files, 3D, StarDist, big images) and which to use.
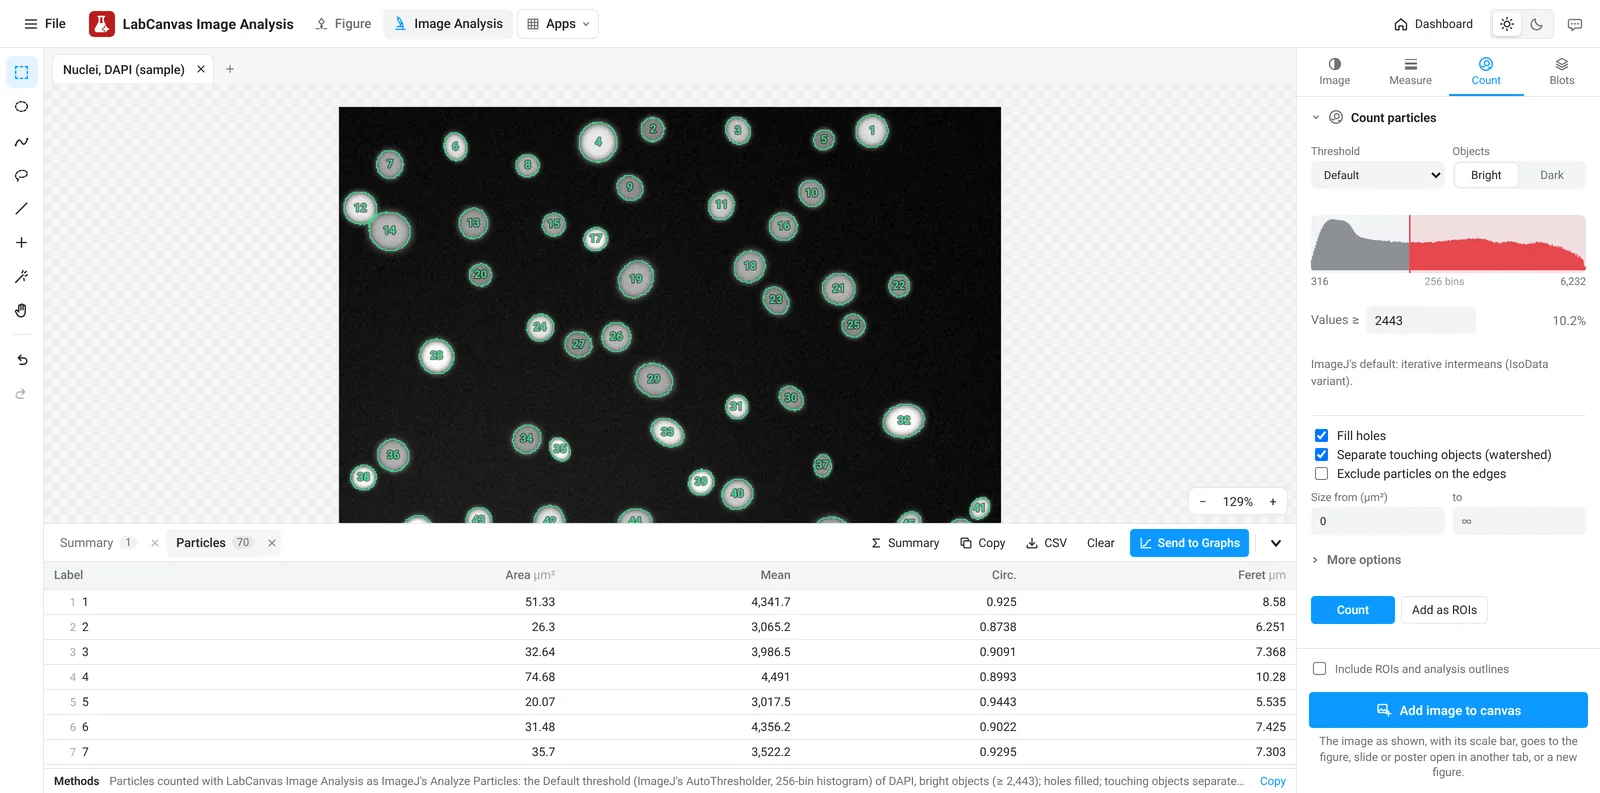
LabCanvas Image Analysis: measure microscopy images, western blots and gels in your browser
How to measure images in LabCanvas Image Analysis: guided assays (nuclear translocation, spots per cell, wound healing, FRAP, calcium, tracking, branching), western blots with a ladder and total-protein normalisation, cell counting with a trainable classifier, ROIs with ImageJ definitions, on the raw pixel values, with results sent to Graphs.
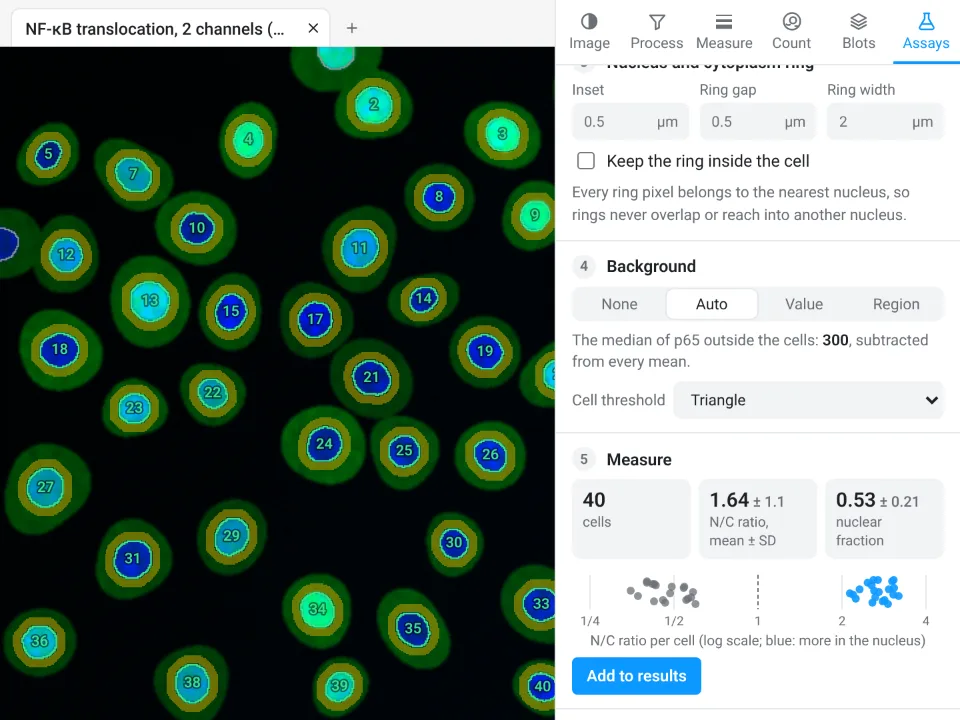
Image Analysis in LabCanvas: a complete guide to every tool and setting, with examples
Every tool in LabCanvas Image Analysis, tab by tab, with its settings and a real example: image check, display and scale, stacks and Z projection, background subtraction, filters, thresholds and binary operations, ROIs and Set measurements, Analyze Particles, a pixel classifier, spots, cell counter, western blot densitometry, colocalisation, colour deconvolution and eleven guided assays.