How to set the scale and add a scale bar in ImageJ (with a calibration image to practise on)
Set the scale in ImageJ (Analyze › Set Scale) from a micrometer, scale bar or pixel size, add a scale bar, and practise on a free calibration image.

Contents
To set the scale in ImageJ, draw a straight line along something of known length (a stage micrometer or a scale bar), choose Analyze › Set Scale…, type the Known distance and the Unit of length, and click OK: lengths and areas are then in µm instead of pixels. To add a scale bar, choose Analyze › Tools › Scale Bar…. The scale itself is one number, the pixel size:
For example,
This guide gives the full steps in ImageJ and Fiji, three ways to find the pixel size, and a synthetic calibration image to practise on.
Three ways to get the pixel size
| Route | When to use it | How |
|---|---|---|
| From the file | The file came straight from the microscope as TIFF, OME-TIFF or the maker's own format | Image › Properties… or Image › Show Info…; in Fiji, Bio-Formats reads .czi, .nd2, .lif and similar files with their pixel size |
| From a stage micrometer | Always, once per objective and camera setup, to check the real value | Photograph the micrometer, draw a line along a known distance, Set Scale |
| From the camera and the optics | You know the camera's pixel size and the total magnification | Pixel size = camera pixel × binning ÷ (objective × any camera adapter or extra magnification) |
The camera route in numbers, for a camera with 6.5 µm pixels and no adapter (a common size in scientific CMOS cameras; take yours from the data sheet):
| Objective | Pixel size (no binning) | With 2 × 2 binning |
|---|---|---|
| 10× | 0.65 µm | 1.3 µm |
| 20× | 0.325 µm | 0.65 µm |
| 40× | 0.1625 µm | 0.325 µm |
| 60× | 0.1083 µm | 0.2167 µm |
| 100× | 0.065 µm | 0.13 µm |
A 0.5× camera adapter doubles every value. The nominal magnification is close but not exact, which is why the micrometer is the reference: it measures what your microscope really does. The microscope pixel size calculator does these sums for any camera, objective and binning, from a micrometer measurement, or from an SEM field width (pixel size = horizontal field width ÷ image width in pixels), and checks the pixel against the resolution of the objective.
A calibration image to practise on
Many people search for a "calibration image for ImageJ". The useful one is a photograph of a stage micrometer taken on your microscope, with the same objective, camera adapter, camera and binning as the images you want to measure. An image from another microscope cannot calibrate yours.
To learn the steps first, download our practice image: stage-micrometer-practice.png (2048 × 1536 pixels, 8-bit, 1.9 MB). It is synthetic, generated for these guides and labelled as such in the picture, not a photograph. It models a 1 mm stage micrometer with 100 divisions of 10 µm (longer ticks every 50 and 100 µm) seen through a 10× objective on a camera with 6.5 µm pixels, with the blur of the optics, slightly uneven light, a little dust, camera noise and a tilt of about a degree. The file carries no pixel size, so it opens in pixels, as a phone photo or a screenshot would. Its true pixel size is 0.65 µm: 1 mm spans 1,538.5 pixels. Set the scale from it and you should get within a fraction of a percent of that.
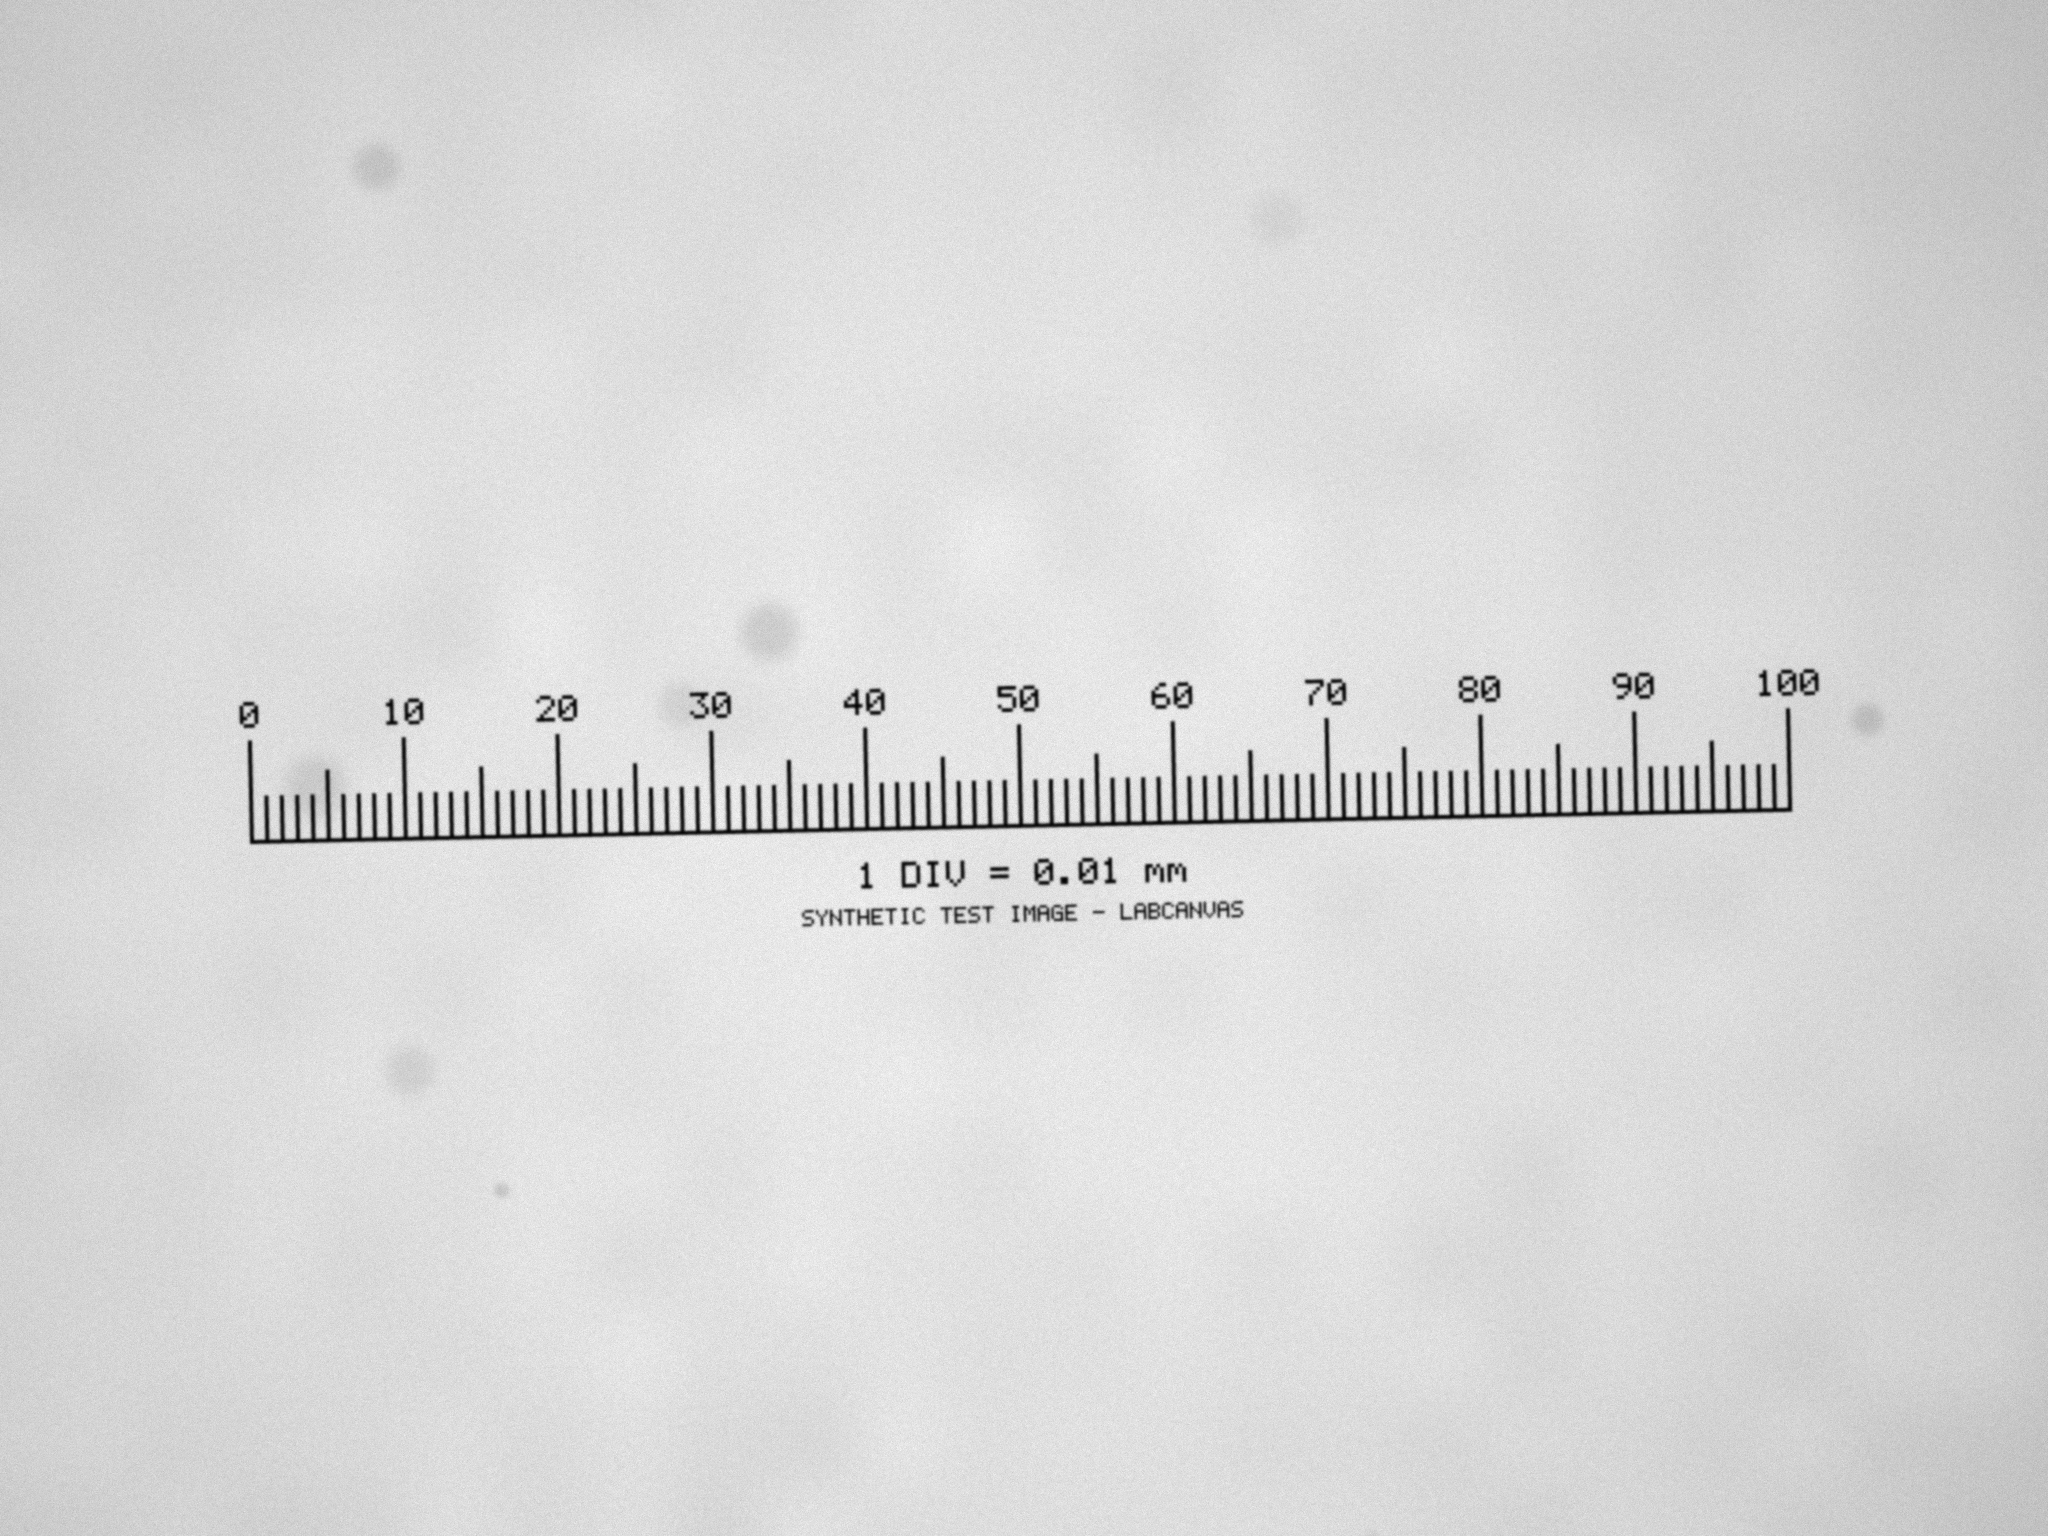
In ImageJ (or Fiji): Set Scale step by step
These commands are part of ImageJ 1.x, so they are the same in plain ImageJ and in Fiji.
From a stage micrometer or a scale bar
- Open the calibration image (File › Open…): the micrometer photographed with the objective, adapter and binning you will use, or the image that carries the scale bar.
- Zoom in (the + and − keys, or the magnifying glass) so that you can place the ends of the line on the marks precisely.
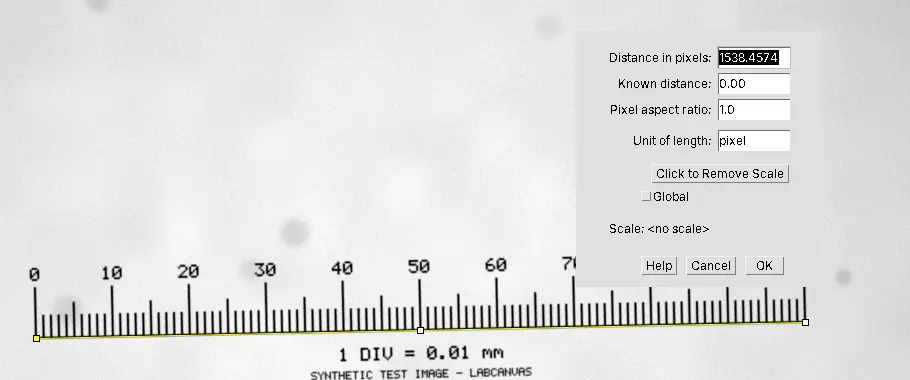
- Draw the line with the Straight Line tool, from the centre of one tick to the centre of another, as far apart as the image allows: on the practice image, from 0 to 100 divisions (1,000 µm). Holding Shift keeps the line horizontal; do not use it if the micrometer is tilted, follow the scale instead.
- Analyze › Set Scale…. Distance in pixels is filled in from the line. Type the Known distance (1000) and the Unit of length (um, which ImageJ shows as µm). Leave Pixel aspect ratio at 1.0 for square pixels.
- Leave Global unticked unless every image you will open shares this pixel size (see below). Click OK.
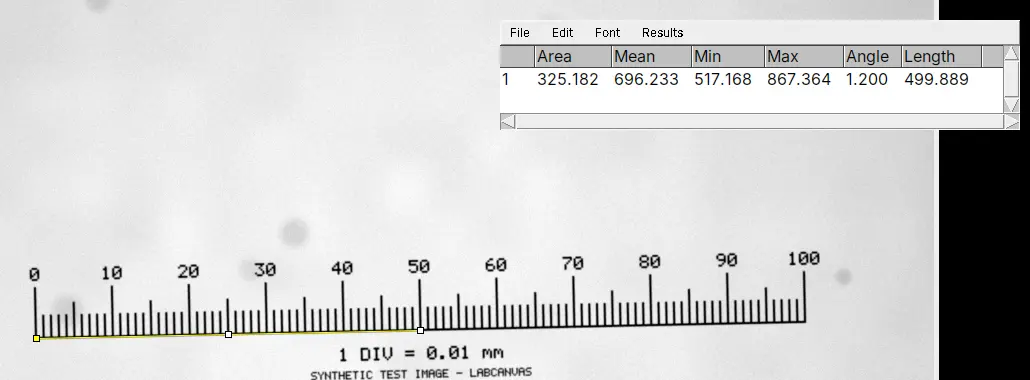
- Check it: Image › Properties… shows the Pixel width and Pixel height (about 0.65 µm on the practice image). Draw a line over 50 divisions and press Ctrl M (Analyze › Measure): Length should read close to 500.
On the 16-bit TIFF version of the practice micrometer, a line on the centres of the 0 and 100 ticks is 1,538.46 pixels long, so Set Scale gives 1.5385 pixels per µm, or 0.6500 µm per pixel against the true 0.65.
For a scale bar burnt into an image, the steps are the same: draw the line along the bar from one end to the other and type the length written on it. Bars are short, so this is less precise than a micrometer (see the pitfalls).
From a known pixel size
If you know the pixel size (from the camera, the microscope software or the calculator), choose Analyze › Set Scale…, type 1 as Distance in pixels, the pixel size as Known distance (for example 0.65) and the unit, and click OK. Or open Image › Properties… and type the Unit of length, Pixel width and Pixel height there; it also holds Voxel depth, the step between the slices of a Z-stack.
Global, Image › Properties and "(G)"
The Global box, in both Set Scale and Image › Properties, applies the scale to all images instead of only the active one, and ImageJ adds (G) to the image title bars. It is handy for a series taken with one setup and a trap for anything else: an image from another objective opened later in the session silently gets the same scale. If you see (G) and did not mean to, open Set Scale, untick Global and set each image's own scale.
Removing or checking a scale
Analyze › Set Scale… has a Click to Remove Scale button, which returns the image to pixels. Image › Show Info… lists the resolution in pixels per unit. Note that Analyze › Calibrate… is something else: it calibrates intensities (for example to optical density), not sizes.
Add a scale bar in ImageJ
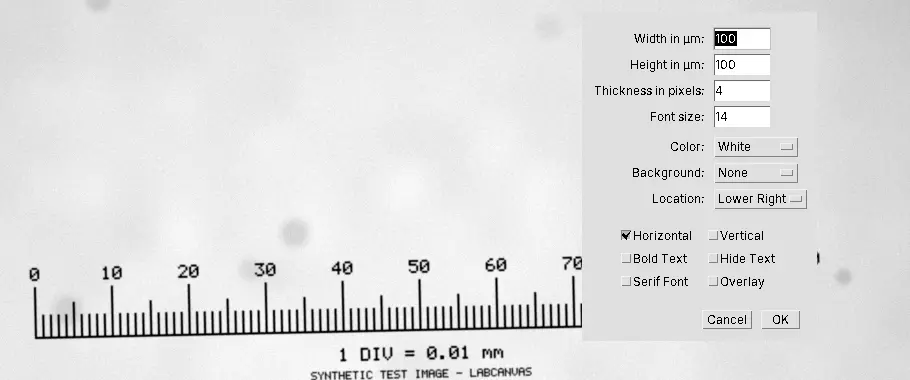
Set the scale first, then choose Analyze › Tools › Scale Bar…:
| Setting | What to choose |
|---|---|
| Width in µm | A round length that is 10–20% of the image width: 10, 20, 50, 100 or 200 µm |
| Thickness in pixels, Font size | Large enough to stay readable when the figure is shrunk to a column width |
| Color, Background | White on dark images, black on light ones; a background box only if the image behind is busy |
| Location | Lower Right (or Upper Right, Lower Left, Upper Left, At Selection to place it where a selection is) |
| Horizontal, Vertical | A horizontal bar, a vertical one or both |
| Bold Text, Hide Text, Serif Font | Hide Text when the length goes in the figure legend instead |
| Overlay | Ticked: the bar is drawn over the image without changing its pixels |
| Label all slices | For stacks: the bar on every slice |
Keep Overlay ticked on the image you measure. For a figure, Image › Overlay › Flatten makes an RGB copy with the bar drawn in; measure the original, never the flattened copy. Save your images as TIFF so that the scale stays with them.
Why a JPEG of a figure loses the scale
ImageJ keeps the pixel size in the TIFF file. A JPEG or a PNG keeps only the pixels, so an image saved that way, a screenshot or a panel copied out of a slide or a paper opens in pixels. Even if it did carry the original pixel size, it would be wrong: a figure has been resized, so one pixel of the JPEG no longer covers what one camera pixel did, and a DPI value in the file is a print size, not a size in the specimen. The only scale left is the one drawn in the picture: set it from the scale bar as above. JPEG compression also changes the pixel values, so use such a picture for sizes at most, never for intensities, and go back to the original file whenever you can.
Pitfalls
- The wrong setup. A micrometer image taken with another objective, another camera adapter or another binning gives the wrong scale. Make one calibration image per objective and setup, name it after them, and repeat it after the microscope is serviced.
- A short line. One pixel of error on a line 154 pixels long (100 µm at 0.65 µm per pixel) is 0.65%; on the whole 1,538-pixel millimetre it is 0.065%. Use the longest distance you can, end to end on the centres of the marks.
- Global left on. The (G) in the title bar is the warning sign.
- A resized image. Any image scaled after acquisition, by you or by the program that exported it, needs its scale set again.
- A scale bar as the reference. A bar drawn by someone else is only as accurate as its drawing, and a 50-pixel bar gives 2% per pixel of error. Prefer the original file or a micrometer.
- Analyze › Calibrate instead of Set Scale. Calibrate is for intensities.
- Z is a separate number. For stacks, check Voxel depth in Image › Properties…; the stage step is not the XY pixel size.
Reporting it
A methods sentence to copy, with the parts in brackets filled in:
Images were spatially calibrated in [Fiji (ImageJ 1.54)] using a stage micrometer ([1 mm, 0.01 mm divisions]) imaged with the same [10×] objective, camera and binning ([0.650] µm per pixel, set with Analyze › Set Scale from a [1,000] µm distance). Scale bars, [100] µm, were added with Analyze › Tools › Scale Bar.
Cite ImageJ (Schneider et al. 2012) or Fiji (Schindelin et al. 2012). In figures, put a scale bar in every image panel (or one per row when the panels share a scale) and give its length in the legend; the figure panel maker lays calibrated panels out together.
Next: measure lengths and areas on the calibrated image, or see how a calibrated SEM image gives grain sizes.
An easier way: set the scale in LabCanvas
LabCanvas Image Analysis does the same in the browser, with nothing to install. A TIFF from ImageJ or an OME-TIFF opens already calibrated, and Image › Scale says whether the scale came from the file or was set by hand.
- Draw a line along the known distance with the Line tool (L).
- In Image › Scale, type the Known distance, pick the Unit (µm, nm, mm, cm, m or Å) and click Set scale; or type the pixel size into Or pixel size.
- Tick Scale bar and choose its Length, Position, Thickness, Text size, white or black, and Label.
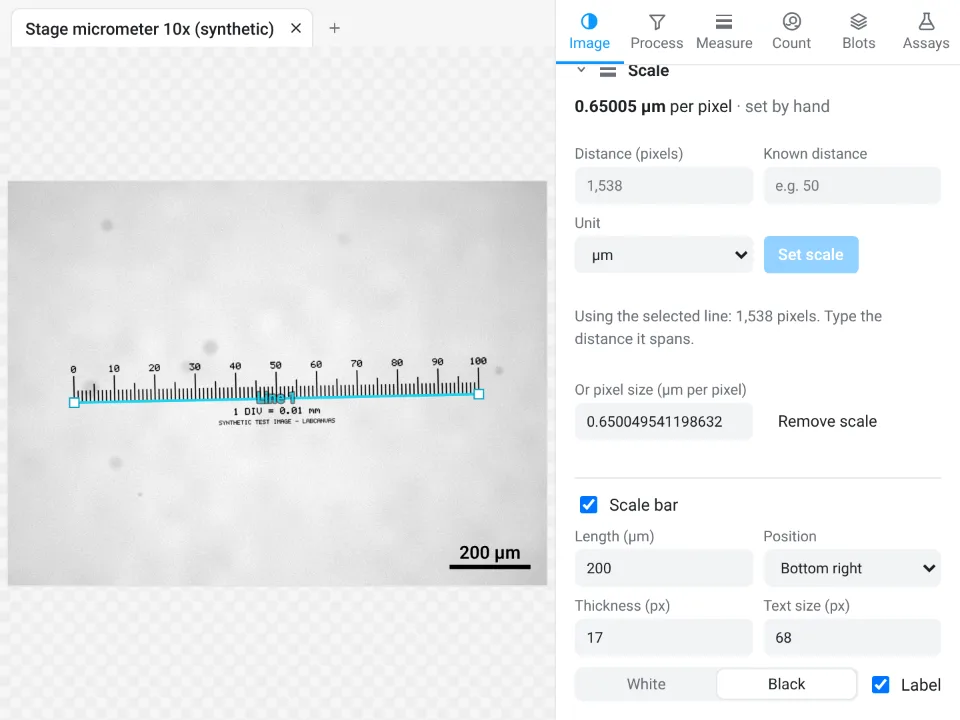
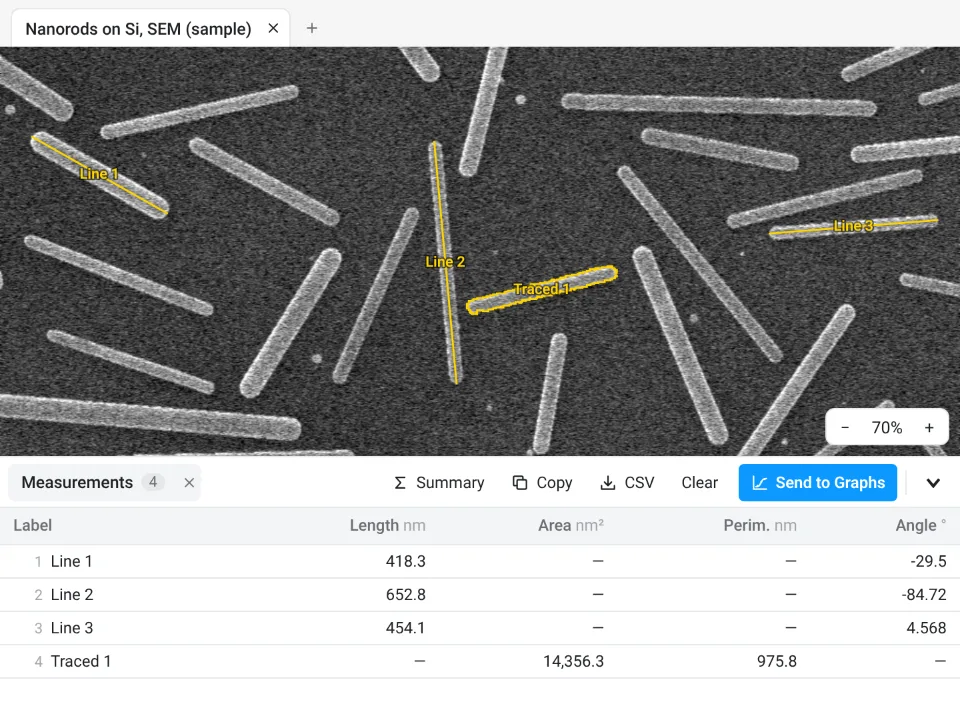
On the practice micrometer in its 16-bit TIFF form, the line from 0 to 100 divisions measures 1,538 pixels in LabCanvas and the scale comes out at 0.65005 µm per pixel; ImageJ gave 1,538.46 pixels and 0.6500 µm per pixel. Both are within 0.01% of the true 0.65 µm.
Why it is a good choice for calibration:
- Nothing to install: it runs in the browser on any computer or tablet.
- No Global switch to forget: each image keeps its own scale, and with several images open the image check's Open images table flags images whose pixel sizes differ.
- Every length and area is then in µm and µm², each results table states the pixel size in its methods sentence, and the scale bar goes with the image to Add to a figure, free with a LabCanvas account (Download PNG is part of Pro); every measurement is checked in more than 4,000 automated tests.
ImageJ and Fiji remain the choice for files in a maker's own format (Fiji's Bio-Formats reads the pixel size from .czi, .nd2 or .lif; LabCanvas needs a TIFF export, and OME-TIFF keeps the scale) and for macros that calibrate thousands of files. Open Image Analysis.
ImageJ and Fiji are independent open-source projects; LabCanvas is not affiliated with them.
References
- Schneider CA, Rasband WS, Eliceiri KW (2012). NIH Image to ImageJ: 25 years of image analysis. Nature Methods 9, 671–675. doi:10.1038/nmeth.2089
- Schindelin J, Arganda-Carreras I, Frise E, et al. (2012). Fiji: an open-source platform for biological-image analysis. Nature Methods 9, 676–682. doi:10.1038/nmeth.2019
Frequently asked questions
How do I set the scale in ImageJ?
Draw a straight line along something of known length in the image (a stage micrometer photographed with the same objective, or a scale bar), then choose Analyze › Set Scale…. Distance in pixels is filled in from the line; type the Known distance and the Unit of length (um gives µm), keep Pixel aspect ratio at 1 and click OK. Lengths and areas are then measured in that unit.
Where can I get a calibration image for ImageJ?
You make it: photograph a stage micrometer (a slide with a ruled scale, often 1 mm in 100 divisions) on your own microscope, with the same objective, camera adapter, camera and binning as the images you will measure. A calibration image from someone else's microscope does not calibrate yours. A synthetic practice image, like the one on this page, is only for learning the steps.
How do I convert pixels to micrometers?
Multiply a length in pixels by the pixel size (µm per pixel), and an area in pixels by the pixel size squared. The pixel size is the known distance divided by its length in pixels, or the camera pixel size × binning ÷ total magnification: a 6.5 µm camera pixel behind a 10× objective covers 0.65 µm.
What does Global do in Set Scale?
With Global ticked, the scale applies to all images, not only the active one, and "(G)" appears in the title bars. That saves time when every image shares one pixel size, but if you then open an image taken with another objective it silently gets the wrong scale. Untick Global when your images differ.
Why does my image have no scale in ImageJ?
ImageJ keeps the scale in TIFF files; JPEG and PNG files keep only the pixels. Screenshots, images exported from slides or papers, and files resized after acquisition have no usable pixel size. Files in a microscope maker's format (.czi, .nd2, .lif) carry it, and Fiji reads it with Bio-Formats. Check Image › Properties….
How do I add a scale bar in ImageJ?
Set the scale first, then choose Analyze › Tools › Scale Bar…. Set the Width in your unit (a round number such as 50 or 100 µm), Thickness in pixels, Font size, Color, Background and Location, and tick Overlay so that the bar does not change the pixels. Image › Overlay › Flatten makes a copy with the bar drawn in, for a figure.
Try it in LabCanvas
Every app is free to start in your browser. Create an account and begin.
Start Image Analysis free in your browserKeep reading

ImageJ vs LabCanvas Image Analysis: an honest comparison
ImageJ/Fiji or LabCanvas Image Analysis? Six everyday jobs done in both, six newer ones (macros, vendor files, 3D, StarDist, big images) and which to use.

How to use ImageJ: a beginner's tutorial for the 10 everyday jobs (2026)
How to use ImageJ and Fiji: get started, open an image, then 10 everyday jobs (scale, measure, threshold, count, background, blots) with exact menu paths.
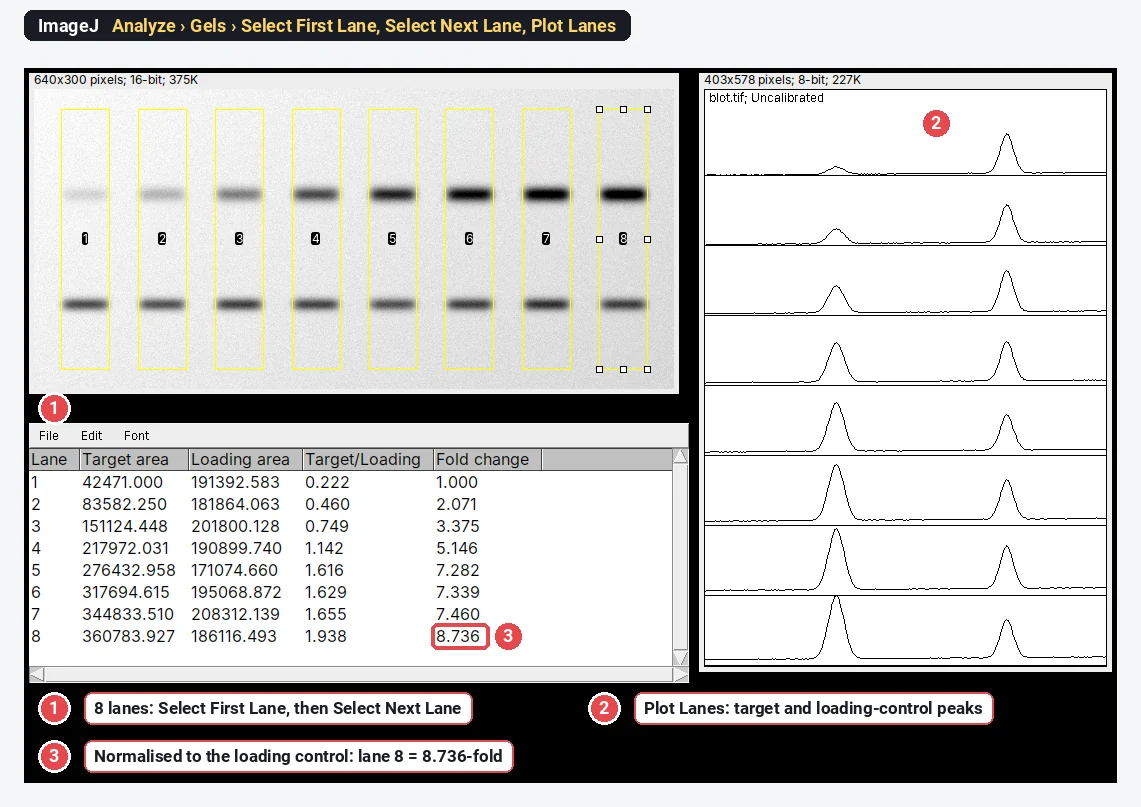
Western blot quantification in ImageJ, step by step (and the 3-click way)
Quantify a western blot in ImageJ with Analyze › Gels, normalise to a loading control or total protein, and get fold change. Plus a 3-click way.