How to use ImageJ: a beginner's tutorial for the 10 everyday jobs (2026)
How to use ImageJ and Fiji: get started, open an image, then 10 everyday jobs (scale, measure, threshold, count, background, blots) with exact menu paths.

Contents
To use ImageJ, download Fiji (the free distribution of ImageJ that comes with plugins), open your image with File › Open…, set its scale with Analyze › Set Scale…, outline what you want to measure with a selection tool and choose Analyze › Measure (Ctrl+M): the numbers appear in a Results table. That loop covers most lab work. The ten recipes below give the exact menu path for each everyday job, with a link to a full guide for each.
What ImageJ and Fiji are
- ImageJ (also written ImageJ 1.x or ImageJ1) is a Java program for processing and analysing scientific images. Wayne Rasband wrote it at the US National Institutes of Health (NIH) as the successor of NIH Image, and it has been developed continuously since 1997. It is public-domain software: free for anyone, for any use.
- ImageJ2 is a rewrite of ImageJ for multidimensional data (any number of channels, slices and time points), with ImageJ 1.x kept inside it so that old plugins and macros still run. It is open source under a BSD licence.
- Fiji ("Fiji Is Just ImageJ") is a "batteries-included" distribution of ImageJ: ImageJ2 and ImageJ 1.x plus many plugins for life-science image analysis (Bio-Formats for microscope files, TrackMate for tracking, Cell Counter, Auto Threshold and many more), with an updater that keeps them current. It is open source under the GNU General Public License.
All three are free. The core menus (File, Edit, Image, Process, Analyze) are the same in ImageJ and Fiji, so every menu path below works in both unless it says otherwise. Download Fiji unless you have a reason not to, such as a lab macro written for plain ImageJ.
Getting started
Download and open an image
- Fiji: download it from fiji.sc for Windows, macOS or Linux. It is a portable application: there is no installer; unpack the archive and double-click the Fiji launcher.
- ImageJ 1.x: download it from imagej.net/ij, choosing the build for your system.
- Open an image with File › Open… or by dropping the file on the ImageJ window. To practise, File › Open Samples has small example images such as Blobs.
- Files in a microscope maker's format (.czi, .nd2, .lif and others) open in Fiji through File › Import › Bio-Formats; plain ImageJ needs the Bio-Formats plugin added.
The ImageJ window
The main window is small: a menu bar, a toolbar and a status bar. The toolbar holds the selection tools (rectangle, oval, polygon, freehand, straight line, angle, point and wand), then text, zoom (magnifying glass), scrolling and the colour picker. A tool with a small triangle in its corner has variants: right-click it to choose one (a segmented or freehand line, or the multi-point tool). Double-click a tool to open its options. When the pointer is over an image, the status bar shows its x, y position and the pixel value.
Before you measure anything, check what you opened: Image › Type shows the bit depth (8-bit, 16-bit, 32-bit or RGB Color), Image › Properties… shows the pixel size, and Image › Show Info… shows the metadata. Can't find a command? Press L for the Command Finder and type part of its name.

The 10 everyday jobs
1. Set the scale and add a scale bar
- With the straight-line tool, draw a line along a scale bar or a stage micrometer photographed at the same magnification.
- Analyze › Set Scale…: Distance in pixels is filled in from your line; type the Known distance and the Unit of length (for example µm). Tick Global to use the same scale for every image you open in this session.
- Analyze › Tools › Scale Bar… draws the bar, with its width, colour and position.
If the file came from the microscope as a TIFF, it may already carry its pixel size: look in Image › Properties… first. Full guide: how to set the scale and add a scale bar in ImageJ.
2. Measure length and area
- Set the scale (job 1), or the results will be in pixels.
- For a length, draw a straight, segmented or freehand line; for an area, draw a rectangle, oval, polygon or freehand outline, or click an object with the wand tool.
- Analyze › Measure (Ctrl+M). Lines give their Length, areas their Area; choose the other columns in Analyze › Set Measurements….
Full guide: how to measure length and area in ImageJ.
3. Measure fluorescence intensity (Mean, IntDen)
- Analyze › Set Measurements…: tick Area, Mean gray value and Integrated density.
- Outline the cell and Measure; then draw a region of background next to it and Measure again.
- Read the columns: Mean is the average pixel value, IntDen is Area × Mean and RawIntDen is the sum of the pixel values. Corrected total cell fluorescence is IntDen − Area × mean background.
Measure the original file, never an RGB snapshot or a JPEG. Full guide: Mean vs IntDen vs RawIntDen in ImageJ.
4. Threshold an image
- Image › Adjust › Threshold… (Ctrl+Shift+T). Pick a method from the list (Default, Otsu, Li, Triangle and others) and tick Dark background for fluorescence; the selected pixels turn red.
- Click Apply, or use Process › Binary › Convert to Mask, to make a black-and-white mask for counting.
- In Fiji, Image › Adjust › Auto Threshold with the method set to Try all shows every method side by side, so you can compare them on your image.
Full guide: ImageJ threshold methods compared.
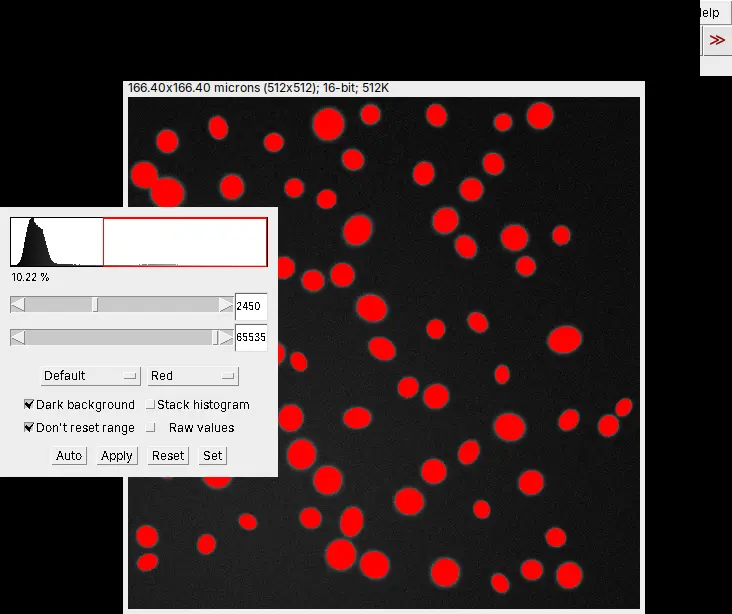
5. Count and measure particles (Analyze Particles)
- Threshold the image (job 4). On the mask, Process › Binary › Watershed splits touching round particles.
- Analyze › Analyze Particles…: set a Size range to drop specks and a Circularity range (0.00 to 1.00), choose Show: Outlines, and tick Display results, Summarize, Exclude on edges and Include holes as needed.
- The Results table has one row per particle; the Summary window gives the count, total area, average size and the area fraction.
Full guide: Analyze Particles in ImageJ, explained.
6. Count cells
- Automatic: Image › Type › 8-bit, threshold the nuclei or cells (job 4), Process › Binary › Watershed, then Analyze Particles with a minimum size that drops debris (job 5).
- Manual, in Fiji: Plugins › Analyze › Cell Counter › Cell Counter, with a counter type for each category you click.
- Manual, in plain ImageJ 1.x (it has no Cell Counter plugin): choose the multi-point tool and click each cell. Edit › Options › Point Tool… has a Counter list for separate categories and shows the count of each, and Analyze › Measure lists every point with its counter.
Full guide: how to count cells in ImageJ.
7. Subtract the background
- Process › Subtract Background…
- Set the Rolling ball radius (in pixels; 50 by default) to at least the radius of the largest object that is not background. Tick Light background for dark objects on a light background, or Sliding paraboloid for the alternative algorithm, and use Preview.
- Click OK. It changes the pixel values, so run it on a copy (Image › Duplicate…) and keep the original.
Full guide: rolling-ball background subtraction: choosing the radius.
8. Merge or split channels
- Image › Color › Merge Channels…: choose an image for each colour (red, green, blue, grey, cyan, magenta or yellow) and tick Create composite to keep the channels separate and adjustable.
- Image › Color › Split Channels does the reverse: one image per channel.
- Image › Color › Channels Tool… shows or hides channels in a composite; Image › Color › Stack to RGB flattens it into a picture for a figure (do not measure that picture).
Full guide: merge, split and overlay channels in ImageJ.
9. Measure many regions with the ROI Manager
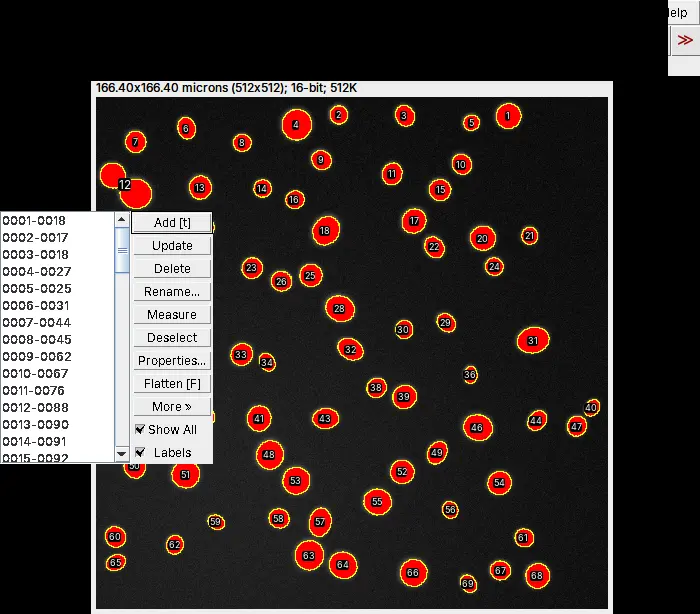
- Analyze › Tools › ROI Manager…; draw a selection and press t (or click Add) for each region.
- Measure in the ROI Manager measures every region (or the selected ones) on the current image; More › Multi Measure measures them on every slice.
- More › Save… saves one region as a .roi file, or all of them as a .zip ROI set (usually RoiSet.zip), so you can measure the same regions again later.
Full guide: the ROI Manager in ImageJ.
10. Quantify a western blot
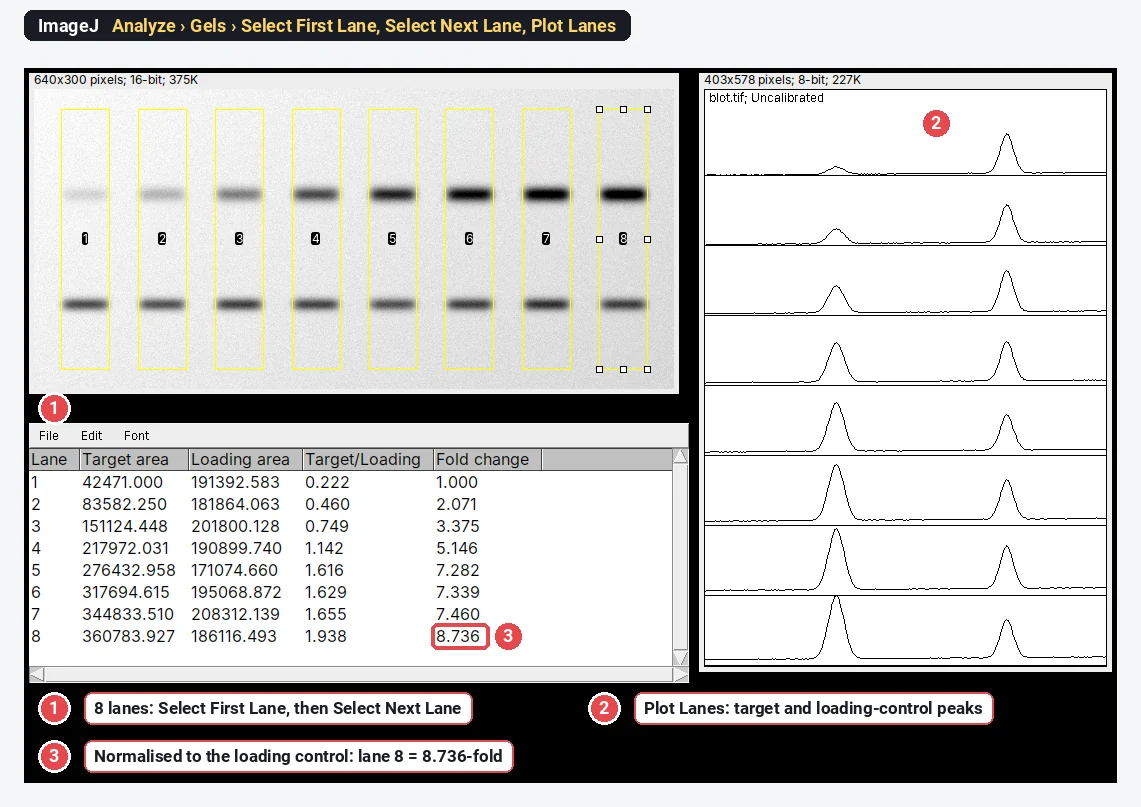
- Draw a rectangle around the first lane and choose Analyze › Gels › Select First Lane (shortcut 1); move the rectangle to each next lane and choose Select Next Lane (2).
- Analyze › Gels › Plot Lanes (3) draws one profile per lane. Close each band's peak with a straight line across its base, then click inside each peak with the wand tool: the peak areas go to the Results table (Analyze › Gels › Label Peaks labels them as a percentage of the total).
- In a spreadsheet, divide each band by its loading control, then by the control lane, for the fold change.
Full guide: western blot quantification in ImageJ, step by step.
Beginner mistakes, and how to spot them
- Measuring a picture instead of the data. An RGB snapshot, a JPEG or an image copied from a slide has lost its raw values and often its scale. If Image › Type says RGB Color for a fluorescence image, go back to the original file.
- A scale that does not belong to the image. A Global scale set for one objective stays on for every image you open in that session; the title bar shows (G) as a reminder.
- Changing the data while adjusting the display. Image › Adjust › Brightness/Contrast… only changes the display until you click Apply; after that, the pixel values are changed. Adjust for viewing; measure on the original.
- Saturated pixels. Pixels at the top value (255 in an 8-bit image) cannot show how bright the sample really was, so intensities are underestimated. Check the histogram (Analyze › Histogram) before you measure.
- Measuring the mask. After Convert to Mask, every object pixel has the same value, so the Mean is meaningless. Measure the regions on the original image, or set Redirect to in Analyze › Set Measurements….
- Not saving the regions. Save the ROI set (job 9) with the results, so that you, or a reviewer, can repeat the measurement.
Reporting what you did
Name the program, its version (Help › About ImageJ…), the settings and the paper to cite: Schneider et al. (2012) for ImageJ, Schindelin et al. (2012) for Fiji, plus any plugin's own paper. How to cite ImageJ and Fiji has the details. A methods sentence to adapt:
Images were analysed in Fiji (ImageJ [version]; Schindelin et al., 2012). The scale was set from [the image metadata / a stage micrometer] ([pixel size] µm per pixel). Background was subtracted with a rolling ball of [radius] pixels, nuclei were segmented with the [Otsu] threshold and separated by watershed, and objects larger than [size] µm² were counted with Analyze Particles.
To show the result, plot one value per image or per cell with the spread, not only a bar of means. For the image panel, keep the scale bar, use the same display settings for images you compare, and say so in the legend; the multi-panel figure maker lays the panels out.
Each recipe above has its full guide. To see where ImageJ sits next to Fiji, CellProfiler, QuPath and the others, read the best ImageJ alternatives.
An easier way: the everyday jobs in LabCanvas
If you would rather not install Java and find plugins, LabCanvas Image Analysis does these jobs in a web browser, under the names and measurement definitions you have just read (Area, Mean, IntDen, RawIntDen, Feret and the rest).
- Open the image (drop the file, or click a sample). TIFF stacks and hyperstacks keep their scale, and ImageJ's .roi files and RoiSet.zip open unchanged.
- Set the scale in Image › Scale, or use the pixel size from the file.
- Measure drawn regions in the Measure tab (the ROI list, Measure, Set measurements); count in Count › Count particles, or click Find nuclei.
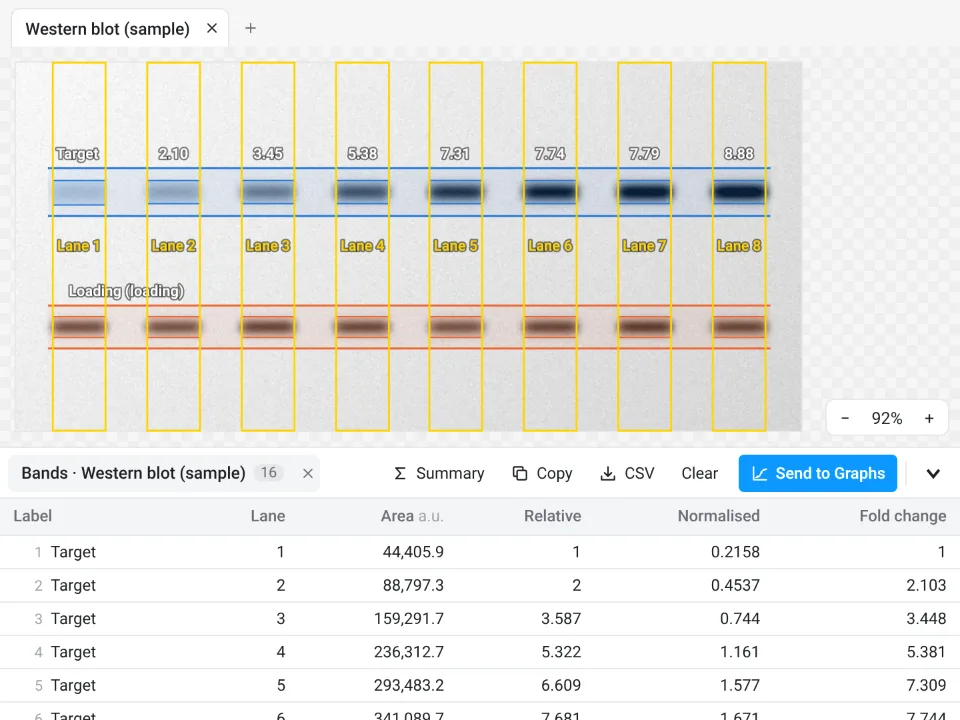
- Use the Blots tab for western blots and the Assays tab for colonies, tracking, wound healing and the other guided measurements.
- Send to Graphs turns any results table into a graph with statistics.
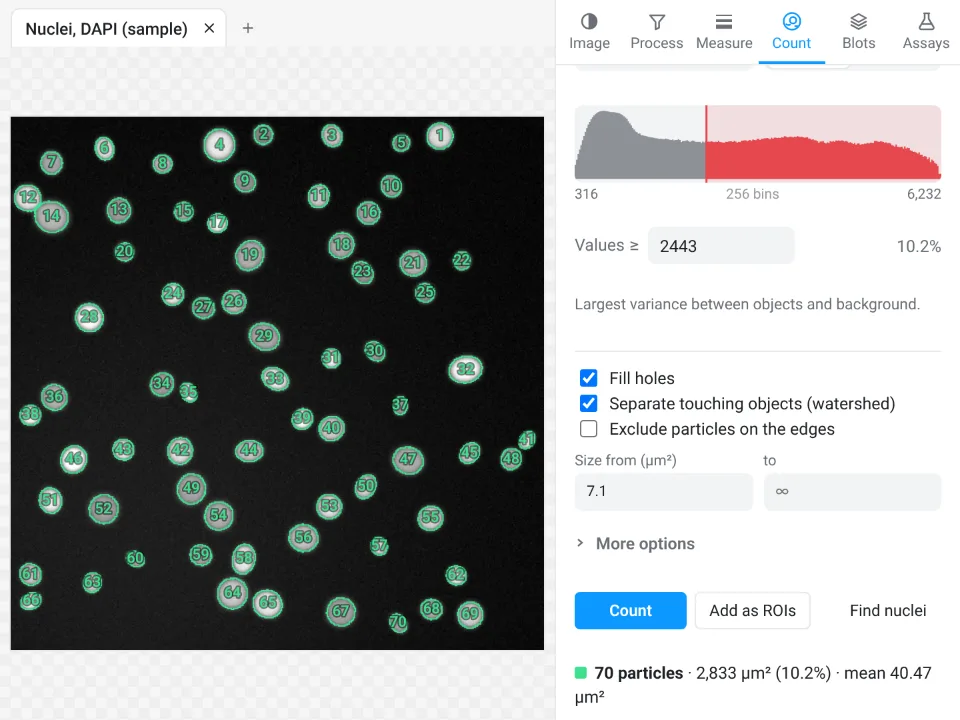
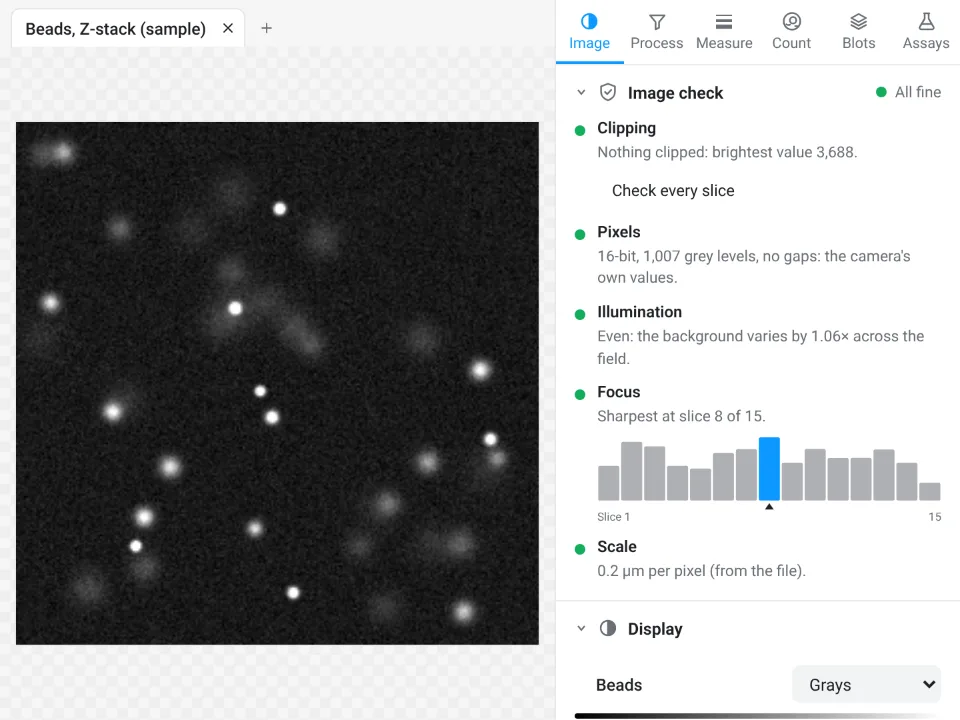
On the nuclei sample in the picture at the top of this article, ImageJ counts 70 nuclei with an average size of 40.394 µm²; LabCanvas Count particles (Otsu, watershed) also counts 70, mean area 40.47 µm², 10.2% of the field.
Why it is a good choice for everyday measurements:
- Nothing to install: it runs in the browser on any computer or tablet.
- An image check before you measure: clipped pixels, JPEG compression, gaps in the histogram, uneven illumination and focus are flagged when the image opens.
- Guided assays instead of plugins and macros, from colony counts to Sholl analysis.
- Results into Graphs and figures: a graph with statistics from any table, the image with its scale bar into a figure, and a methods sentence to copy.
- Free with a LabCanvas account; downloading files (CSV, TIFF, PNG) is part of LabCanvas Pro. Every measurement is checked in more than 4,000 automated tests.
ImageJ and Fiji still do what it does not: plugins, macros and scripting, 3D object analysis, deep-learning segmentation (StarDist, Cellpose), every vendor file format through Bio-Formats, DICOM, and very large datasets. Open Image Analysis to try the jobs on a sample. ImageJ and Fiji are independent open-source projects; LabCanvas is not affiliated with them.
References
- Schneider CA, Rasband WS, Eliceiri KW (2012). NIH Image to ImageJ: 25 years of image analysis. Nature Methods 9, 671–675. doi:10.1038/nmeth.2089
- Schindelin J, Arganda-Carreras I, Frise E, et al. (2012). Fiji: an open-source platform for biological-image analysis. Nature Methods 9, 676–682. doi:10.1038/nmeth.2019
- Rueden CT, Schindelin J, Hiner MC, et al. (2017). ImageJ2: ImageJ for the next generation of scientific image data. BMC Bioinformatics 18, 529. doi:10.1186/s12859-017-1934-z
Frequently asked questions
Is ImageJ hard to learn?
The basics take an afternoon: open an image, set the scale, draw a selection and press Analyze › Measure. What takes longer is knowing which of the many menus holds a command (press L for the Command Finder and type part of its name), choosing a threshold method, and finding the right plugin for a specialised job. The ten recipes in this tutorial cover most everyday lab work.
Is ImageJ a coding language?
No. ImageJ is a program with menus and tools that you use by pointing and clicking. It has its own macro language for repeating steps, and Fiji's Script Editor (File › New › Script…) also runs Python (Jython), Groovy and JavaScript, but you do not need any of them to measure images. Plugins › Macros › Record… writes the macro for you while you click, if you ever want one.
Is ImageJ free?
Yes. ImageJ 1.x was written at the US National Institutes of Health and is in the public domain, so anyone may use it for any purpose. Fiji is open source under the GNU General Public License and ImageJ2 under a BSD licence; both are free to download and use, with no licence key and no account.
Should I download ImageJ or Fiji?
Fiji, for most people. It is ImageJ with ImageJ2 and a large set of plugins included (Bio-Formats for microscope files, TrackMate, Cell Counter, Auto Threshold and others), and an updater. The core menus are the same in both. Plain ImageJ 1.x is a smaller download and suits a lab that runs macros written for it. ImageJ is still called ImageJ: ImageJ 1.x is still developed, ImageJ2 is its rewrite, and Fiji is a distribution of both.
What is ImageJ used for?
Measuring scientific images: lengths, areas and intensities in calibrated units, counting cells, nuclei, colonies and particles, western blot and gel densitometry, background subtraction, thresholding and segmentation, colocalisation, Z-stacks and time-lapse series. It is used across biology, medicine and materials science, from fluorescence micrographs to electron micrographs and photos of plates or leaves.
Try it in LabCanvas
Every app is free to start in your browser. Create an account and begin.
Start Image Analysis free in your browserKeep reading

ImageJ vs LabCanvas Image Analysis: an honest comparison
ImageJ/Fiji or LabCanvas Image Analysis? Six everyday jobs done in both, six newer ones (macros, vendor files, 3D, StarDist, big images) and which to use.

How to set the scale and add a scale bar in ImageJ (with a calibration image to practise on)
Set the scale in ImageJ (Analyze › Set Scale) from a micrometer, scale bar or pixel size, add a scale bar, and practise on a free calibration image.
Western blot quantification in ImageJ, step by step (and the 3-click way)
Quantify a western blot in ImageJ with Analyze › Gels, normalise to a loading control or total protein, and get fold change. Plus a 3-click way.