ImageJ threshold methods compared, with pictures
All 16 ImageJ auto threshold methods on one image, with the threshold and % area each gives, which method suits which image, and how to apply it.
Contents
To threshold an image in ImageJ, open Image › Adjust › Threshold… (Ctrl Shift T), pick a method from the list (Default, Otsu, Triangle, Li and the rest), tick Dark background if your objects are brighter than the background, check that the red overlay covers exactly your objects, then click Apply to make a black-and-white mask. ImageJ 1.54 offers 16 automatic methods plus Default, and on the same image they can disagree by a factor of more than 25: on our nuclei sample they select anywhere from 1.8% to 47.4% of the pixels.
This page shows every method on two images, gives the threshold value and the share of the image each one selects, and says which to choose for which kind of picture.
What is an automatic threshold?
A threshold is the grey value that splits an image into object and background: everything above it (or below it, for dark objects) becomes the object. An automatic method picks that value from the histogram, the count of pixels at each grey value, so it never looks at shapes, only at how the values are spread. That is why one method can be perfect for one image and useless for the next.
ImageJ works on a 256-bin histogram. An 8-bit image has one bin per value; a 16-bit image is binned from its minimum to its maximum (on the nuclei sample, 316 to 6232, so each bin is 23.1 grey values wide). The threshold is then reported back in the image's own values.
The 16 methods (plus Default) on one image
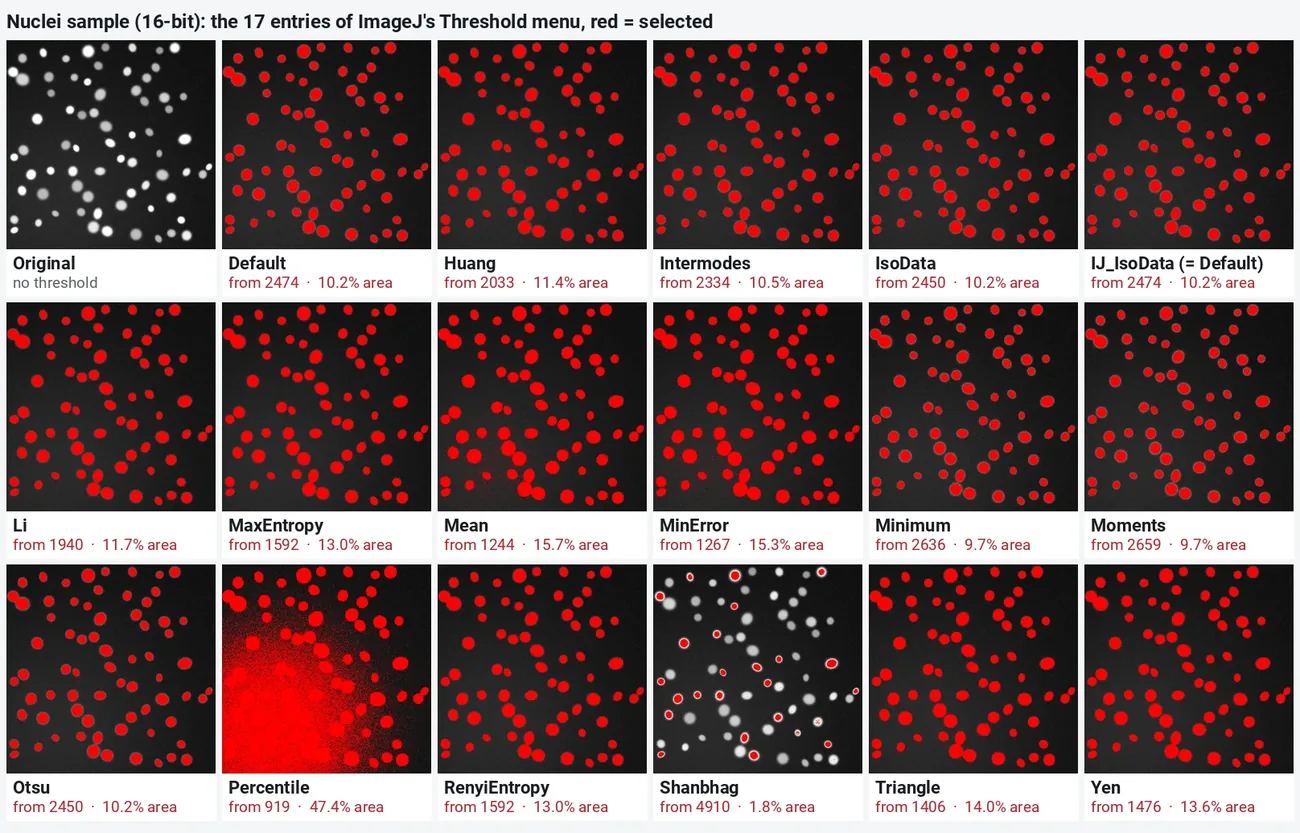
The test image is a synthetic nuclei sample: 70 nuclei, some bright and some dim, on a dark background that is a little brighter in the lower left (512 × 512 pixels, 16-bit, 0.325 µm per pixel). Each tile is ImageJ 1.54f's own mask for that method, drawn in red over the image, with the lower threshold and the share of the image selected (%Area):
| Method | Idea, in one line | Lower threshold | %Area |
|---|---|---|---|
| Default | ImageJ's variant of IsoData (iterative intermeans) | 2474 | 10.16 |
| IJ_IsoData | The same algorithm as Default, listed by name | 2474 | 10.16 |
| IsoData | Iterative intermeans (Ridler & Calvard) | 2450 | 10.22 |
| Otsu | Largest variance between the two classes (Otsu 1979) | 2450 | 10.22 |
| Intermodes | Midway between the two peaks of the smoothed histogram | 2334 | 10.52 |
| Minimum | The valley between the two smoothed peaks | 2636 | 9.72 |
| Moments | Keeps the first three moments of the histogram (Tsai) | 2659 | 9.66 |
| Huang | Fuzzy sets: least entropy of the memberships | 2033 | 11.38 |
| Li | Minimum cross entropy, iterative (Li & Tam 1998) | 1940 | 11.69 |
| MaxEntropy | Largest total entropy of the two classes (Kapur) | 1592 | 13.03 |
| RenyiEntropy | A combination of entropy thresholds | 1592 | 13.03 |
| Yen | Largest correlation between the classes | 1476 | 13.61 |
| Triangle | Farthest point from a line from the peak to the end | 1406 | 14.03 |
| MinError | Minimum error between two Gaussians (Kittler & Illingworth) | 1267 | 15.34 |
| Mean | The mean grey value | 1244 | 15.73 |
| Shanbhag | Information measure of fuzzy classes | 4910 | 1.78 |
| Percentile | Half of the pixels are objects | 919 | 47.43 |
Read the grid in three groups:
- The middle group (Default, IsoData, Otsu, Intermodes, Minimum, Moments): 9.7 to 10.5% of the image. They cut near the bottom of the nuclei's own peak, so every nucleus is in and the soft rim around it is out. For counting and measuring area, this is the group you want on this image.
- The generous group (Huang, Li, MaxEntropy, RenyiEntropy, Yen, Triangle, MinError, Mean): 11.4 to 15.7%. They cut lower, so the dim nuclei come out bigger and the blurred rims are counted as nucleus. Mean and MinError already reach into the brighter background at the lower left.
- The two that fail here: Percentile assumes half the image is object, which is only true for a few images; Shanbhag keeps only the brightest centres of the brightest nuclei.
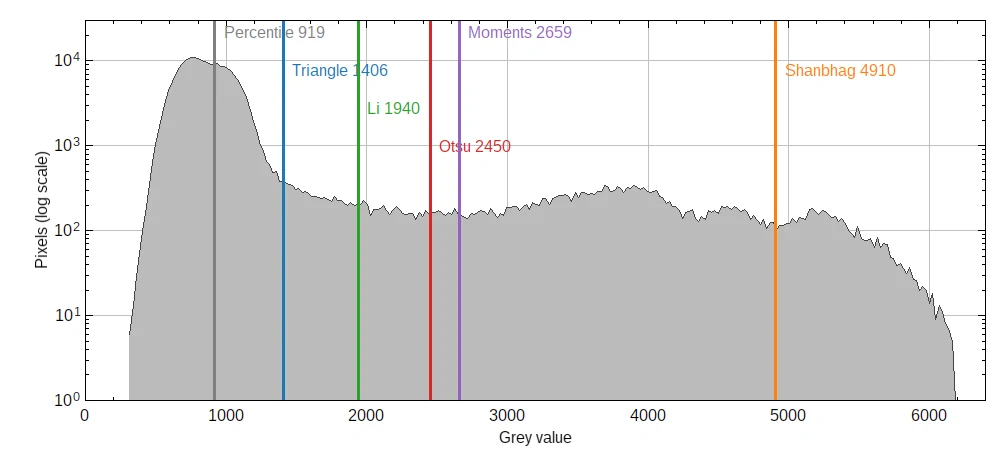
The histogram shows why. The background makes the big peak on the left; the nuclei are the long flat shoulder on the right. Methods that look for a valley between two peaks (Otsu, IsoData, Minimum) find the start of the shoulder; methods built for a skewed histogram (Triangle, Li) cut closer to the background peak:
A harder image: grain boundaries in an SEM picture
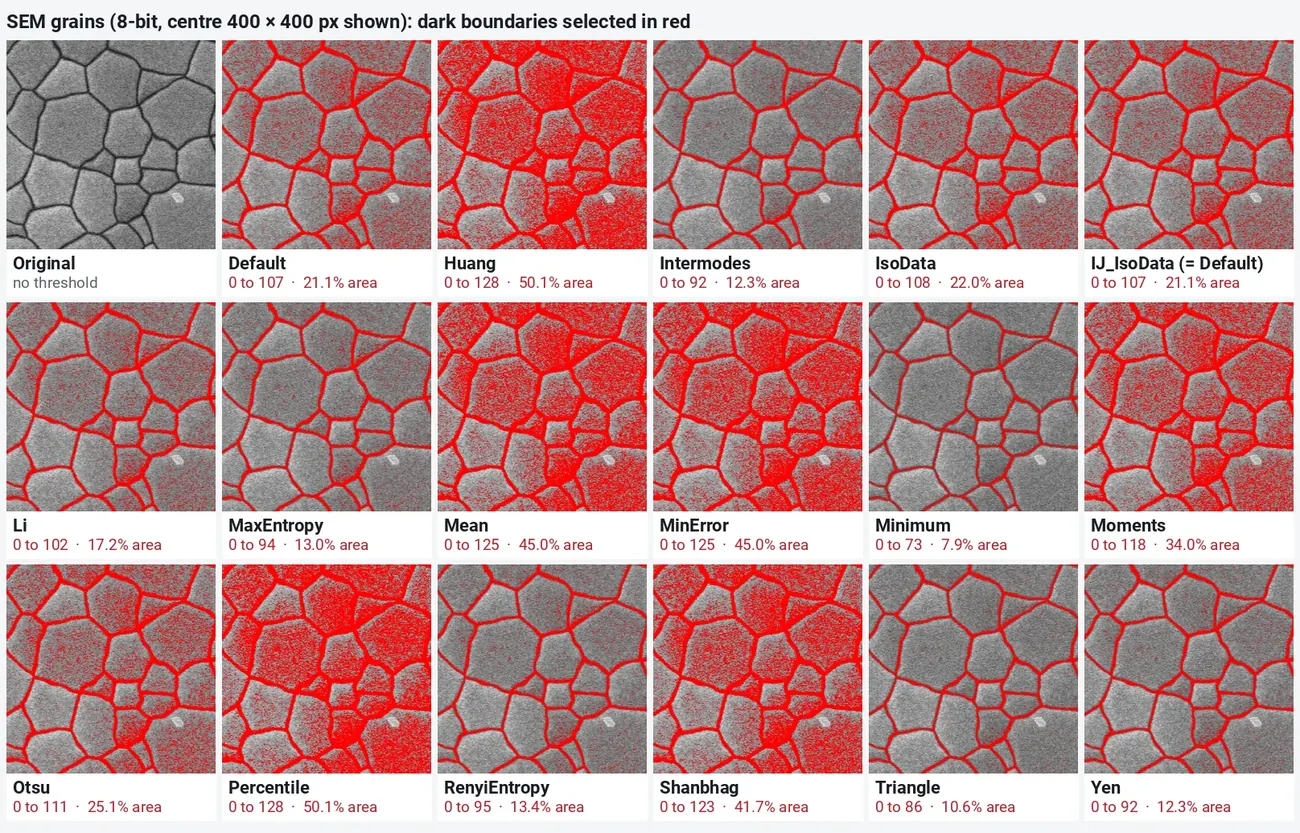
Nuclei on a dark field are the easy case. Grain boundaries are thin dark lines between grey grains of slightly different brightness, and only a few percent of the pixels are boundary. This is the synthetic perovskite-film SEM sample (1024 × 1024, 8-bit, 2.5 nm per pixel); here the objects are dark, so Dark background is off and the selection runs from 0 up to the threshold:
| Result | Methods (upper threshold, %Area) |
|---|---|
| Clean, closed boundaries | Triangle (86, 10.6%), Intermodes and Yen (92, 12.3%), MaxEntropy (94, 13.0%), RenyiEntropy (95, 13.4%) |
| Boundaries plus speckle in the darker grains | Li (102, 17.2%), Default (107, 21.1%), IsoData (108, 22.0%), Otsu (111, 25.1%) |
| Whole grains filled | Moments (118, 34.0%), Shanbhag (123, 41.7%), Mean and MinError (125, 45.0%), Huang and Percentile (128, 50.1%) |
| Boundaries broken | Minimum (73, 7.9%) |
Otsu, the usual first choice, selects twice the boundary area of Triangle here, because the darker grains overlap the boundaries in the histogram. On the anodic-alumina sample (dark round pores, 8-bit) the methods are closer: 32.2% (MinError) to 50.4% (Percentile), with Default, IsoData and Otsu all at 100 and 34.67%. The lesson is the same on every image: the method is a measurement setting, so choose it by looking, then keep it fixed.
How do I threshold an image in ImageJ?
These steps are the same in ImageJ 1.x and Fiji.
- Open the image. Thresholds work on one grey channel: for an RGB picture use Image › Type › 8-bit or split the channels first (Image › Color › Split Channels); for a colour stain use Image › Adjust › Color Threshold… instead.
- If the background is uneven, correct it first with Process › Subtract Background… (see rolling-ball background subtraction). No global method copes with a background that changes across the field.
- Image › Adjust › Threshold… (Ctrl Shift T). Pick the method in the left drop-down and the display mode in the right one (Red, B&W or Over/Under).
- Tick Dark background if the objects are brighter than the background (fluorescence, bright particles); untick it for dark objects (stained cells in brightfield, TEM particles, pores, grain boundaries).
- Check the red overlay. Zoom in on the dimmest objects and on the edges of the bright ones. If the method is close but not right, drag the sliders or click Set and type the lower and upper values; note them for your methods.
- Click Apply, or close the window and run Process › Binary › Convert to Mask. With Process › Binary › Options › Black background ticked, objects become white (255) on black (0).
- Clean the mask if needed (Process › Binary › Fill Holes, Watershed to split touching objects) and measure with Analyze › Analyze Particles….
Why does the Threshold window give a slightly different number than my macro?
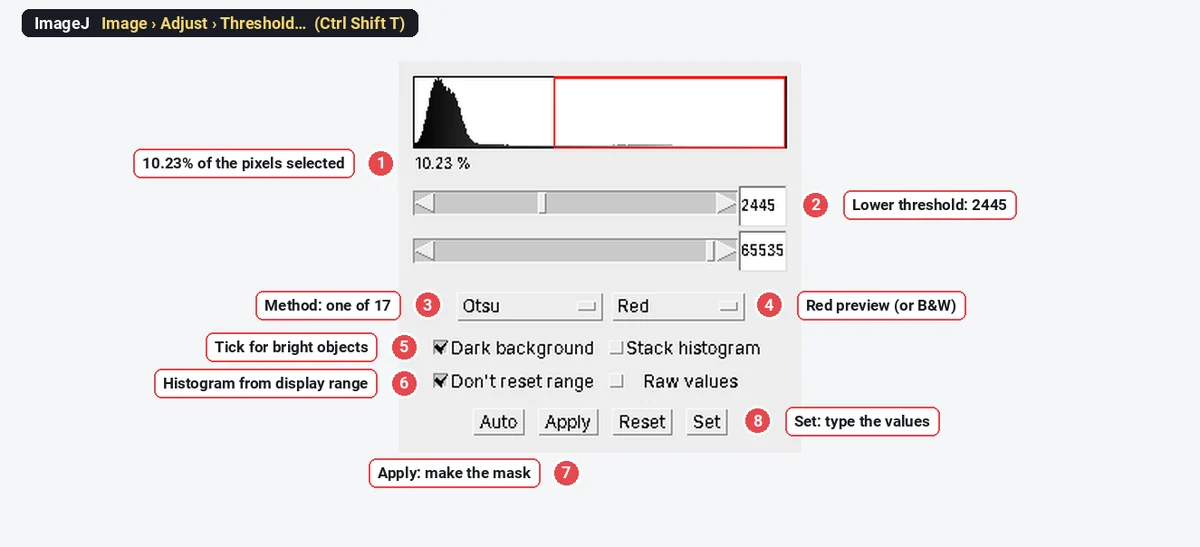
Don't reset range, ticked by default here, makes the window use the image's current display range when it builds the histogram of a 16-bit image. On the nuclei sample the window's Otsu came out at 2445 (10.23%), while setAutoThreshold("Otsu dark") in a macro, which bins the full range of the data, gave 2450 (10.22%). The difference is less than a bin and rarely matters, but if you want the window and your macro to agree, untick it, or record the macro from the window.
Apply, Convert to Mask or Create Selection?
Apply and Process › Binary › Convert to Mask both replace the image with an 8-bit mask, so do them on a duplicate (Image › Duplicate…) if you still need the intensities. Edit › Selection › Create Selection turns the thresholded pixels into a selection instead, which you can measure on the original image or add to the ROI Manager. Analyze › Analyze Particles also works directly on a thresholded image without applying it, and with Analyze › Set Measurements › Limit to threshold, Measure reports only the red pixels.
In a macro
The same choices in one line each, so a batch of images gets exactly the same treatment:
setAutoThreshold("Otsu dark");   // method, then "dark" for bright objects
setOption("BlackBackground", true);
run("Convert to Mask");
Add "16-bit" to the method string ("Otsu dark 16-bit") to compute the threshold on the full 16-bit histogram instead of 256 bins. getThreshold(lower, upper) returns the values to log. To pick one method for all images, compare a few images by eye first, then fix it: a different method per image makes the results incomparable.
Which threshold method should I use?
| Your image | Start with | Why |
|---|---|---|
| Fluorescent nuclei or cells, 5 to 40% of the field | Otsu, Default or Moments | Two clear populations; the cut lands at the foot of the object peak |
| Small, sparse or dim spots on a big dark background | Triangle, Li or MaxEntropy | Built for one large peak with a tail; keep dim objects |
| Dim objects you must not lose, area less important | Li, Huang | Cut low; check the background is not creeping in |
| Thin dark lines or boundaries (grains, membranes, cracks) | Triangle, Yen, MaxEntropy, Intermodes | Few pixels on one side of the cut |
| Dark particles or pores on a light field (TEM, SEM) | Default, Otsu or IsoData; MinError if they touch | Two well-separated peaks |
| Histogram with two clear peaks of similar size | Minimum, Intermodes | They look for the valley; they fail when there is no valley |
| You know the fraction in advance | Percentile (always 50%) | Rarely right for microscopy |
| Uneven background, overlapping brightness | None of them: subtract background, use a local threshold or a pixel classifier | One global value cannot fit |
Otsu vs Triangle
These two cover most images, so they are worth knowing apart. Otsu splits the histogram where the two classes are most different (largest variance between them); it is best when objects and background each make a clear peak and the objects cover a fair share of the image. Triangle draws a line from the top of the histogram's biggest peak to its far end and cuts where the histogram is farthest below that line; it is best when the background is one large peak and the objects are a thin tail, which is common for sparse spots, small particles and thin lines. On the nuclei sample Otsu cuts at 2450 (10.2% of the image) and keeps the nuclei crisp; Triangle cuts at 1406 (14.0%) and includes the blurred rims. On the SEM grains Triangle gives the cleaner boundaries (10.6%) and Otsu fills the darker grains with speckle (25.1%).
Try all methods at once (Fiji's Auto Threshold)
Fiji adds Image › Adjust › Auto Threshold, the Auto Threshold plugin by Gabriel Landini, from which ImageJ's built-in methods come. With the method set to Try all, it makes one montage of the image under every method, each tile labelled, which is the fastest way to choose. It also has options to ignore black or white pixels in the histogram, to treat objects as white on black, to use the stack histogram and to print the threshold values in the Log window. Fiji's Auto Local Threshold goes further: it computes a separate threshold around every pixel (Bernsen, Niblack, Phansalkar, Sauvola and others), which helps when the background is uneven.
Neither plugin is in plain ImageJ 1.x. There, the grid above is what you build by hand: choose each method in the Threshold window in turn, or loop over getList("threshold.methods") in a macro.
Pitfalls
- Dark background the wrong way round. The background turns red and Analyze Particles finds one huge particle. Flip the tick.
- Choosing a method per image. Each image then gets its own rule. Choose one method on a few representative images and use it for all of them, or set one fixed value when the images were taken with identical settings.
- Judging at the wrong zoom. A threshold that looks right at 25% zoom can miss the rims of every nucleus. Check at 100% or more.
- Uneven illumination. A brighter corner pulls Mean and MinError into the background (see the lower left of the nuclei grid). Subtract the background first.
- Thresholding a JPEG or an 8-bit copy of a figure. Compression and contrast changes move the histogram. Threshold the original file.
- Saturated images. Clipped pixels pile up in the last bin and distort every histogram method; check for saturation first.
- Applying the threshold on your only copy. Apply replaces the intensities. Duplicate first.
Reporting it
Nuclei were segmented in [Fiji (ImageJ 1.54f)] with the [Otsu] automatic threshold (Image › Adjust › Threshold, dark background, 256-bin histogram), converted to a binary mask, holes filled and touching nuclei separated with the watershed; objects of at least [7] µm² were counted with Analyze Particles.
Name the method, the version and whether you subtracted a background first; a fixed value needs the number itself.
An easier way: compare threshold methods in LabCanvas
LabCanvas Image Analysis has the same 16 methods under their ImageJ names (Default, Otsu, Huang, Intermodes, IsoData, Li, MaxEntropy, Mean, MinError, Minimum, Moments, Percentile, RenyiEntropy, Shanbhag, Triangle, Yen), computed the same way on a 256-bin histogram, in the browser with nothing to install.
- Open your image (or the nuclei sample on the start screen) and go to Count › Count particles (or Process › Binary for a mask only).
- Pick a method in the drop-down and choose bright or dark objects; the red preview updates at once, so you can step through the methods one by one. Drag on the histogram to set a value by hand.
- Tick fill holes and watershed, set the size and circularity, and click Count for the Particles and Summary tables. Find nuclei does Otsu, fill holes, watershed and a sensible minimum size in one click.
- When no threshold separates what you want, paint a few strokes in the Pixel classifier instead.
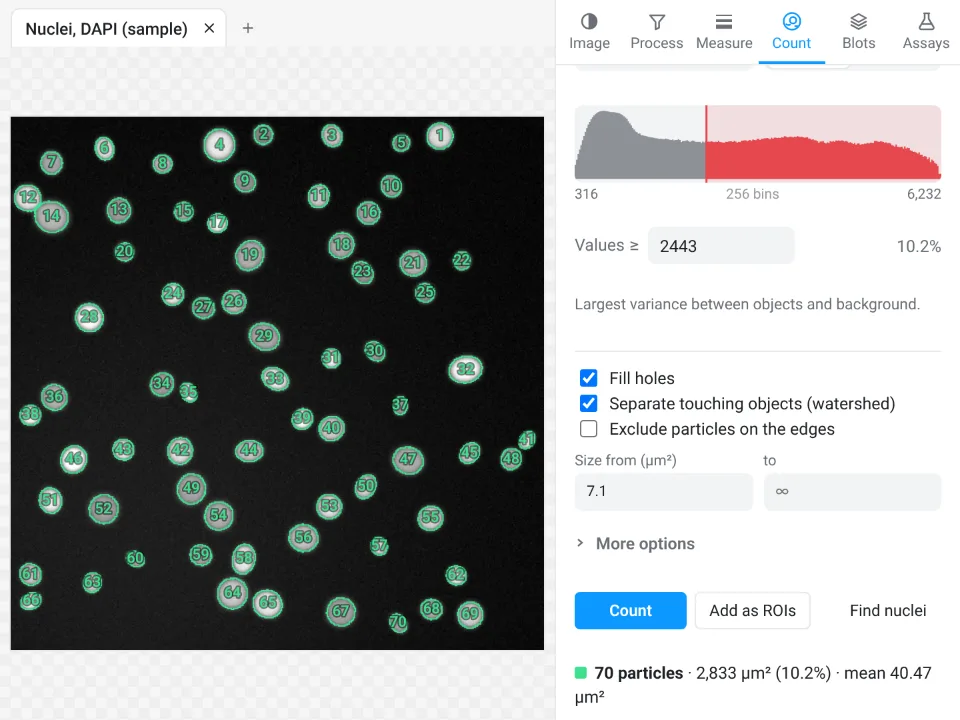
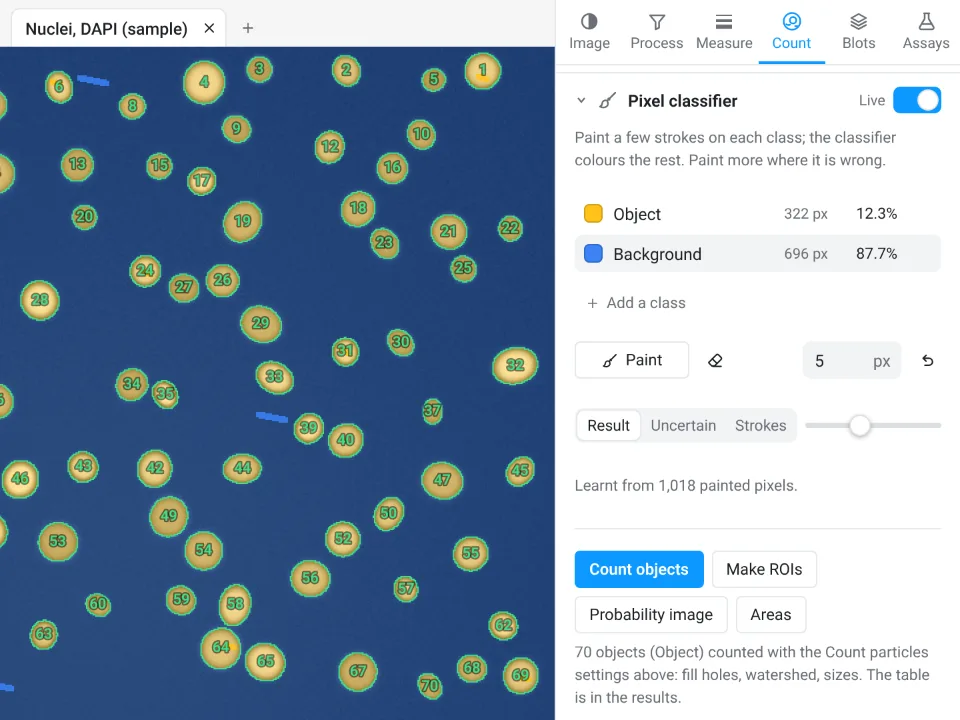
We ran the app's threshold code on the same three files. On the 8-bit SEM images it gives exactly ImageJ's threshold for every method, except IsoData on the grains (109 against ImageJ's 108). On the 16-bit nuclei it lands within about one histogram bin of ImageJ, because the two bin a 16-bit image slightly differently: Otsu 2443 and 10.24% of the image against ImageJ's 2450 and 10.22%, Triangle 1426 and 13.91% against 1406 and 14.03%, Li 1911 against 1940. The count is the same 70 nuclei either way.
Why it is a good choice for thresholding:
- ImageJ's own method names and results, so the method you name in your methods means the same thing.
- An image check that flags saturation, JPEG compression and uneven light, the three things that break a histogram threshold, before you choose.
- A methods line under every results table with the method and settings, and Send to Graphs for the counts with statistics.
- Free with a LabCanvas account, and every method is checked in more than 4,000 automated tests.
There is no "Try all" montage, and Fiji is the better tool when you need a local threshold method, a thousand files through one macro, or deep-learning segmentation (StarDist, Cellpose). Open Image Analysis, or read the complete guide.
ImageJ and Fiji are independent open-source projects; LabCanvas is not affiliated with them.
References
- Otsu N (1979). A threshold selection method from gray-level histograms. IEEE Transactions on Systems, Man, and Cybernetics 9(1), 62–66. doi:10.1109/TSMC.1979.4310076
- Li CH, Tam PKS (1998). An iterative algorithm for minimum cross entropy thresholding. Pattern Recognition Letters 19(8), 771–776. doi:10.1016/S0167-8655(98)00057-900057-9)
- Schneider CA, Rasband WS, Eliceiri KW (2012). NIH Image to ImageJ: 25 years of image analysis. Nature Methods 9, 671–675. doi:10.1038/nmeth.2089
Frequently asked questions
Which threshold method is best in ImageJ?
There is no single best one; it depends on the histogram. For bright objects that cover a fair share of a dark image, Otsu, Default (IsoData) and Moments agree closely. For small or dim objects on a large background, Triangle, Li or MaxEntropy keep the dim ones. On the nuclei sample here, the methods select anywhere from 1.8% (Shanbhag) to 47.4% (Percentile) of the image, so look at the red preview before you trust any of them.
What is the Default threshold method in ImageJ?
Default is ImageJ's own variant of the IsoData (iterative intermeans) method: it starts from a guess, averages the mean of the pixels above and below, and repeats until the threshold stops moving, ignoring the first and last bins of the histogram. It also appears in the list as IJ_IsoData, and on our samples the two give identical thresholds.
What does Dark background do in the ImageJ Threshold window?
It tells ImageJ that the objects are brighter than the background, so the pixels above the threshold are selected (red). Tick it for fluorescence and for bright particles on a dark field; untick it for dark objects on a light background, such as stained cells in brightfield, pores or grain boundaries in SEM images. With it wrong, the background becomes the object.
What is the difference between Otsu and Triangle thresholding?
Otsu picks the value that best separates the histogram into two classes (largest variance between them), so it works when objects and background both form clear peaks. Triangle draws a line from the histogram peak to its far end and takes the point of the histogram farthest from that line, which suits a large background peak with a long tail of few, small or dim objects. On the nuclei sample Otsu selects 10.2% of the image at 2450, Triangle 14.0% at 1406, taking in more of the dim edges.
How do I try all threshold methods at once?
In Fiji, Image › Adjust › Auto Threshold with the method set to Try all makes a montage of the image under every method, labelled, so you can compare them side by side. Plain ImageJ 1.x does not include that plugin; there, choose each method in turn in the Threshold window, or run setAutoThreshold for each in a short macro.
Why does the threshold not work on my image?
A global threshold is one value for the whole image, so it fails when the background is uneven (one side brighter than the other), when objects of very different brightness sit together, or when objects differ from the background by texture rather than brightness. Correct the background first (Process › Subtract Background), use a local threshold (Fiji's Auto Local Threshold) or train a pixel classifier.
Try it in LabCanvas
Every app is free to start in your browser. Create an account and begin.
Start Image Analysis free in your browserKeep reading

ImageJ vs LabCanvas Image Analysis: an honest comparison
ImageJ/Fiji or LabCanvas Image Analysis? Six everyday jobs done in both, six newer ones (macros, vendor files, 3D, StarDist, big images) and which to use.

How to use ImageJ: a beginner's tutorial for the 10 everyday jobs (2026)
How to use ImageJ and Fiji: get started, open an image, then 10 everyday jobs (scale, measure, threshold, count, background, blots) with exact menu paths.

How to set the scale and add a scale bar in ImageJ (with a calibration image to practise on)
Set the scale in ImageJ (Analyze › Set Scale) from a micrometer, scale bar or pixel size, add a scale bar, and practise on a free calibration image.