Check for saturated pixels in ImageJ: histogram, HiLo LUT and the numbers
Check saturation in ImageJ with Analyze › Histogram, the HiLo LUT and Min/Max, on a clipped example with its spike at 65535 and what it does to data.
Contents
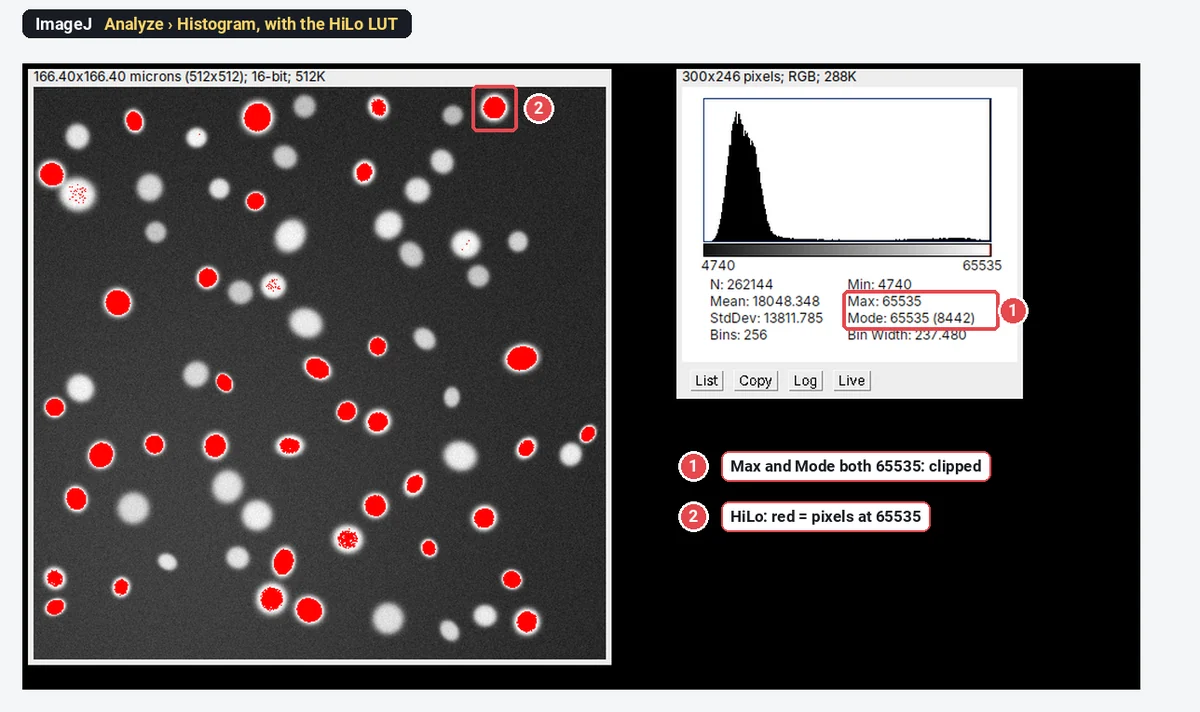
To check for saturated pixels in ImageJ, run Analyze › Histogram (Ctrl H) and compare Max with the highest value your camera can record: 255 for 8-bit, 4095 for a 12-bit camera, 65535 for a full 16-bit one. If Max sits exactly at that limit, and especially if Mode equals Max, pixels are clipped. To see where, apply Image › Lookup Tables › HiLo with the display range set to the full range: saturated pixels show red, pixels at zero blue.
Below, a sample image and a deliberately saturated copy of it show what each check looks like, and how much clipping changes the measurements.
What is a saturated pixel?
A pixel is saturated (or clipped) when the light reaching it was more than the camera could count: it records the maximum value, and everything brighter is lost. A saturated region is a flat plateau at the top value. Its true shape and brightness are unknown, and no software can recover them.
The limit depends on the camera, not only the file:
| Camera or file | Saturates at |
|---|---|
| 8-bit image | 255 |
| 10-bit camera in a 16-bit file | 1023 |
| 12-bit camera in a 16-bit file | 4095 |
| 14-bit camera in a 16-bit file | 16383 |
| 16-bit camera (many sCMOS) or 16-bit file | 65535 |
So a 16-bit file whose maximum is 4095 is not "far below 65535": it is probably a 12-bit camera at full scale. Check the camera's bit depth in its data sheet or in the file's metadata (Image › Show Info…).
A worked example: one image, and a saturated copy
The test image is a synthetic nuclei sample (16-bit, 512 × 512 pixels, 70 nuclei). Its brightest pixel is 6232, far below anything a camera would clip, so it is a fair "good" image. To make a "bad" one we ran Process › Math › Multiply… with a value of 15 on a copy: in a 16-bit image ImageJ clips every result above 65535 to 65535, which is exactly what an over-long exposure does. Without the ceiling the brightest pixel would have been 93,480.
You can do the same with any of your own images to see what saturation looks like in your measurements; just never measure the copy.
How do I read the ImageJ histogram?
Analyze › Histogram (Ctrl H) works on the active image or on the selection, if there is one. It draws the histogram, the count of pixels at each grey value, and lists:
| Field | What it means |
|---|---|
| N (Count) | Pixels counted (262,144 = 512 × 512 here) |
| Mean, StdDev | Mean and standard deviation of the values |
| Min, Max | The smallest and largest value in the image or selection |
| Mode | The most common value, with its count in brackets |
| Bins, Bin Width | How many bars, and how many grey values each covers (16-bit images are binned) |
The buttons below it: List gives the counts per bin as a table, Copy puts them on the clipboard, Log adds a log-scaled version on top (small counts become visible), and Live updates the histogram as you move a selection.
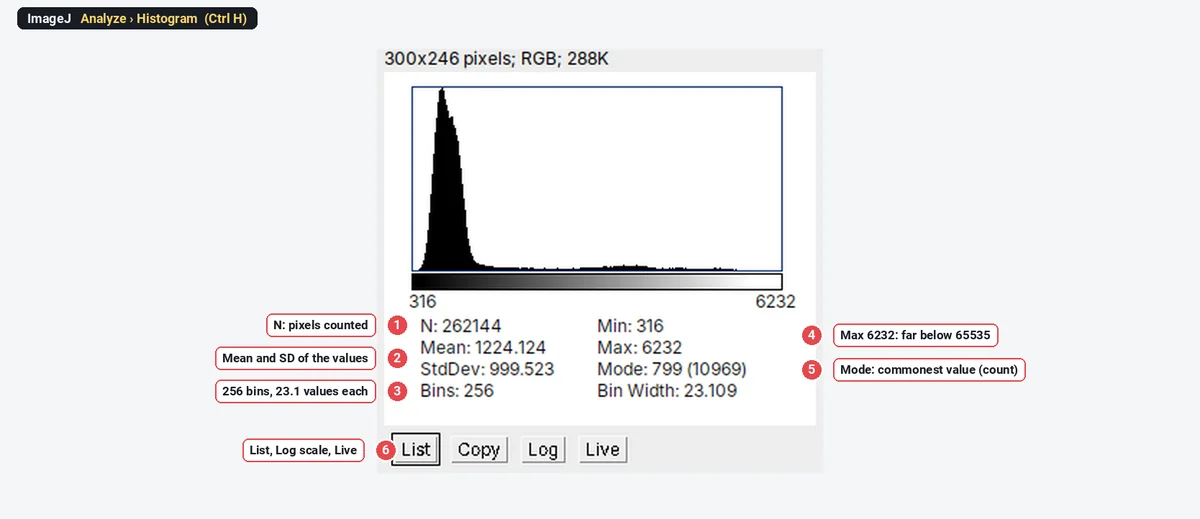
On a 16-bit image the histogram is binned between the image's minimum and maximum (316 to 6232 here), so the x axis is not 0 to 65535 and a spike at the top can hide inside the last bar. Read Max and Mode, not only the picture.
What does a saturated histogram look like?
The same window on the saturated copy:
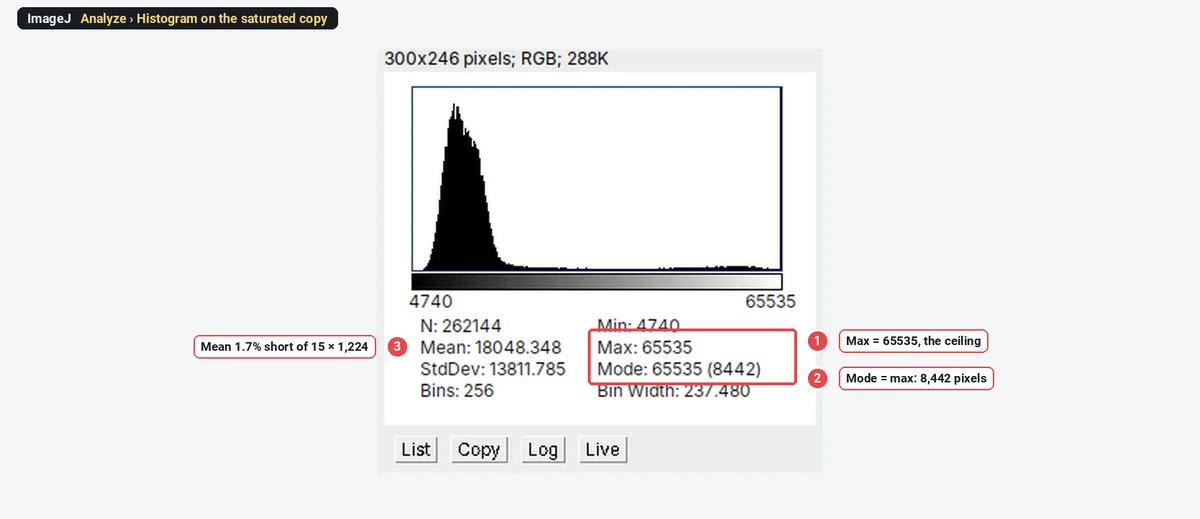
Two numbers give it away: Max is exactly the ceiling, and Mode equals Max, because the clipped pixels pile up in the last bin. In a healthy image the mode is in the background, never at the top. The exact count at 65535 is 8,359 pixels, 3.19% of the image (the last bin, 8,442 pixels, also holds a few values just below).
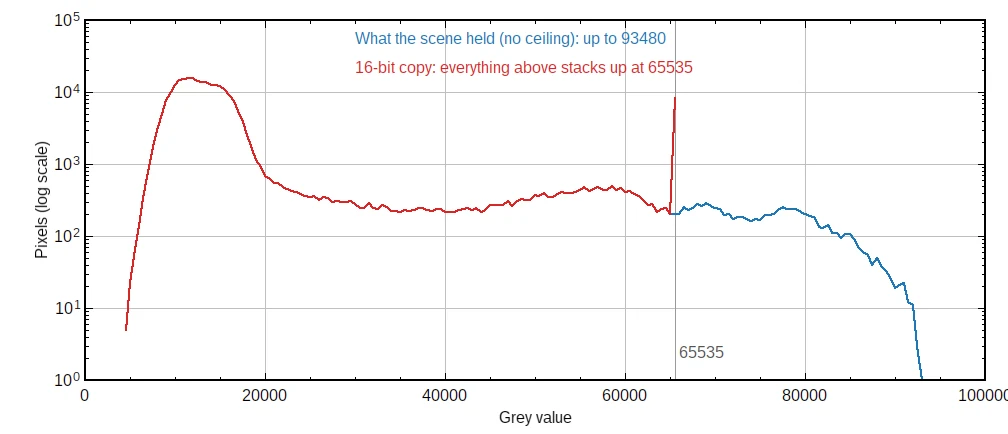
On a linear plot the spike is easy to miss. Plotted on a log scale against what the scene really held, it is obvious: the histogram is cut off at 65535 and everything above is stacked into one bar.
To count the clipped pixels exactly in a macro:
getHistogram(values, counts, 65536);   // 16-bit: one bin per value (use 256 for 8-bit)
print(counts[65535]);                  // pixels at the 16-bit maximum; counts[4095] for a 12-bit camera
How do I see where the saturated pixels are? (the HiLo LUT)
HiLo is a grey lookup table with one change: the lowest value of the display range is drawn blue and the highest red. It shows where the extremes are without changing a pixel.
- Image › Lookup Tables › HiLo. HiLo is not built into ij.jar: Fiji includes it, and plain ImageJ 1.x lists it only when a HiLo.lut file is in its luts folder (tables in that folder appear below the built-in ones). It is easy to make: grey, with entry 0 blue and entry 255 red.
- Image › Adjust › Brightness/Contrast… (Ctrl Shift C), click Set and type the full range: 0 and 255 for 8-bit, 0 and 65535 for 16-bit (or 0 and 4095 for a 12-bit camera).
- Red pixels are now at the maximum (saturated), blue pixels at 0 (clipped at the bottom, usually from too low an offset or an over-subtracted background).
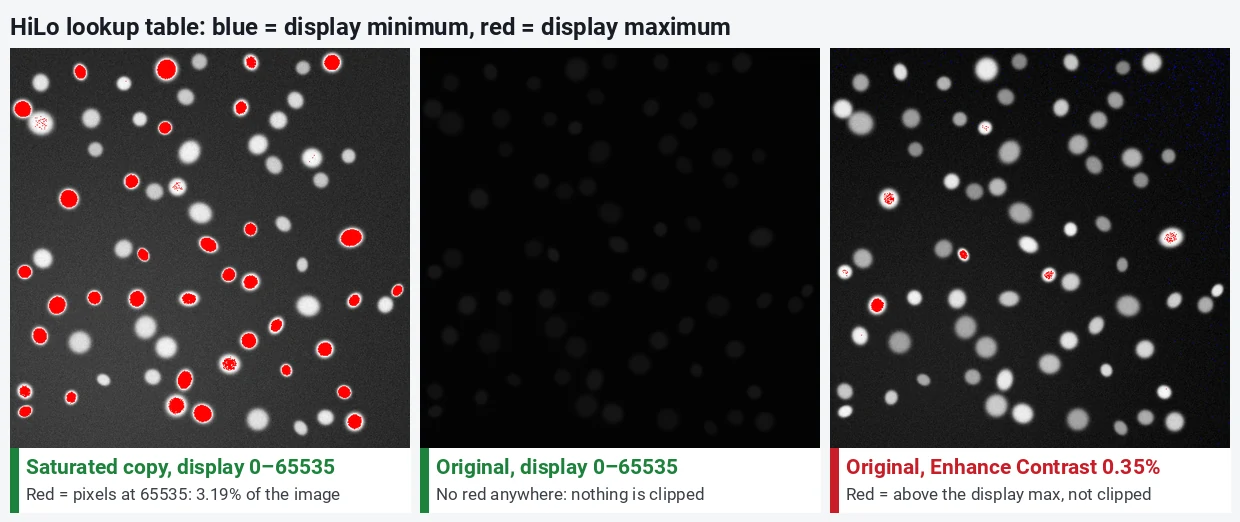
The right-hand panel is the trap. Process › Enhance Contrast with 0.35% saturated (and, in a similar way, Auto in Brightness/Contrast) narrows the display range so that a small share of the pixels lie beyond its ends (here 460 to 5734), and HiLo then paints those red. They are only above the display maximum, not saturated. HiLo answers "is it saturated?" only when the display range is the full range.
How do I check Min and Max with Analyze › Measure?
For a number per image or per object, add Min & max gray value in Analyze › Set Measurements…, then press M (Analyze › Measure). With a selection, the numbers are for the selection only, so you can check each cell or band you measure.
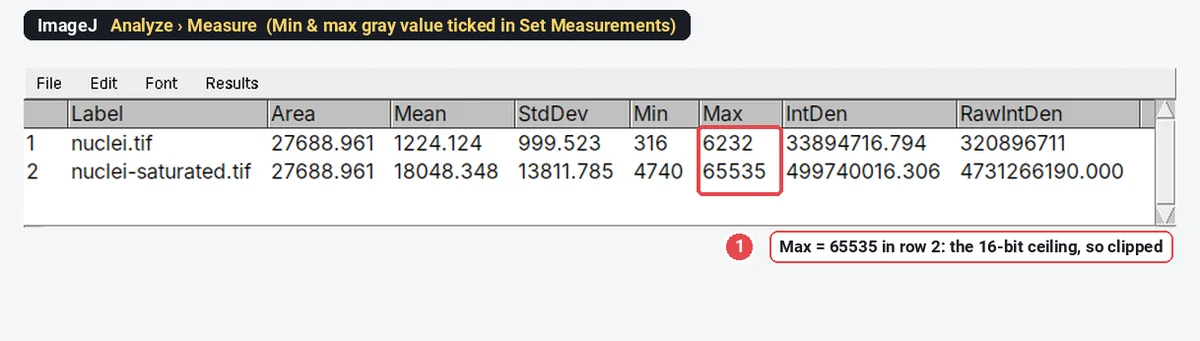
With the ROI Manager, select all ROIs and click Measure: any row whose Max equals the ceiling is an object with clipped pixels. In our saturated copy, 37 of the 69 objects found by an Otsu threshold contained at least one pixel at 65535.
Why does saturation ruin intensity measurements?
Every intensity measurement assumes the pixel value is proportional to the light. A clipped pixel breaks that for the brightest objects only, so the error is not a constant you can correct:
| Measured through the same 69 outlines | Original | Saturated copy (× 15) | Error |
|---|---|---|---|
| Brightest nucleus, mean | 4,932 | 60,882 (12.3×, not 15×) | 18% low |
| Dimmest nucleus, mean | 3,017 | 45,262 (15×) | none |
| Brightest ÷ dimmest | 1.63 | 1.35 | difference shrinks by half |
| Whole image, mean | 1,224 | 18,048 (14.7×) | 1.7% low |
A condition that doubles the signal of already-bright cells looks like a much smaller effect, and the brightest cells, often the ones you care about, are hit hardest. The same applies to western blot bands (a saturated band's integrated density is too low), to ratios and FRET, and to colocalisation, where clipped pixels distort Pearson's r and the Costes thresholds.
Thresholds suffer too: the pile-up in the last bin is a peak that histogram-based methods (Otsu, IsoData and the others, see threshold methods compared) take into account.
What to do about it
- At the microscope: use the camera software's own over-exposure display (most have one) or HiLo on a live image, and lower the exposure, gain or laser power until the brightest real structure is below the limit, with some margin. Keep these settings for every image you will compare.
- After acquisition: you cannot recover the data. Leave out objects with clipped pixels (and say so), or re-image.
- For figures only: some saturation for visibility is acceptable if no intensity is compared, and the legend says how the contrast was set.
Pitfalls
- Reading the picture, not the numbers. A 16-bit histogram is binned, and a spike can hide in the last bar. Read Max and Mode.
- Comparing Max with the wrong ceiling. A 12-bit camera saturates at 4095 inside a 16-bit file.
- HiLo after an automatic contrast stretch. Red then means "above the display maximum". Set the full range first.
- Clipped at the bottom. A Min of 0 with many pixels there (blue in HiLo) means the offset was too low or the background was over-subtracted; low values are lost too.
- Checking the whole image only. A field can be fine overall while the one cell you measure is clipped. Measure Max inside each ROI.
- Applying contrast. Brightness/Contrast › Apply rewrites the pixels and creates saturation that the camera never had.
- Processed files. A JPEG, a screenshot or an image exported for a slide has been rescaled; its maximum says nothing about the camera.
Reporting it
Images were acquired with [exposure, gain] set so that no pixel in the structures of interest reached the [12-bit] camera maximum; saturation was checked with the ImageJ histogram (Analyze › Histogram, maximum below [4095]) [and objects with clipped pixels were excluded from intensity measurements].
Journals increasingly ask for this; it costs one sentence. For a macro that checks thousands of files, or for reading the bit depth from a maker's own format through Bio-Formats, ImageJ and Fiji are the tools.
An easier way: check saturation in LabCanvas
LabCanvas Image Analysis checks every image for clipping the moment it opens, in the browser, with nothing to install and no LUT to load.
- Open your image (TIFF, including 16-bit stacks).
- In the Image tab, read Image check › Clipping: the share of pixels at the top value or at 0, per channel and inside the selected ROIs.
- Click Show where to mark the clipped pixels in red and blue, like HiLo but without changing the display range; Check every slice goes through a whole stack.
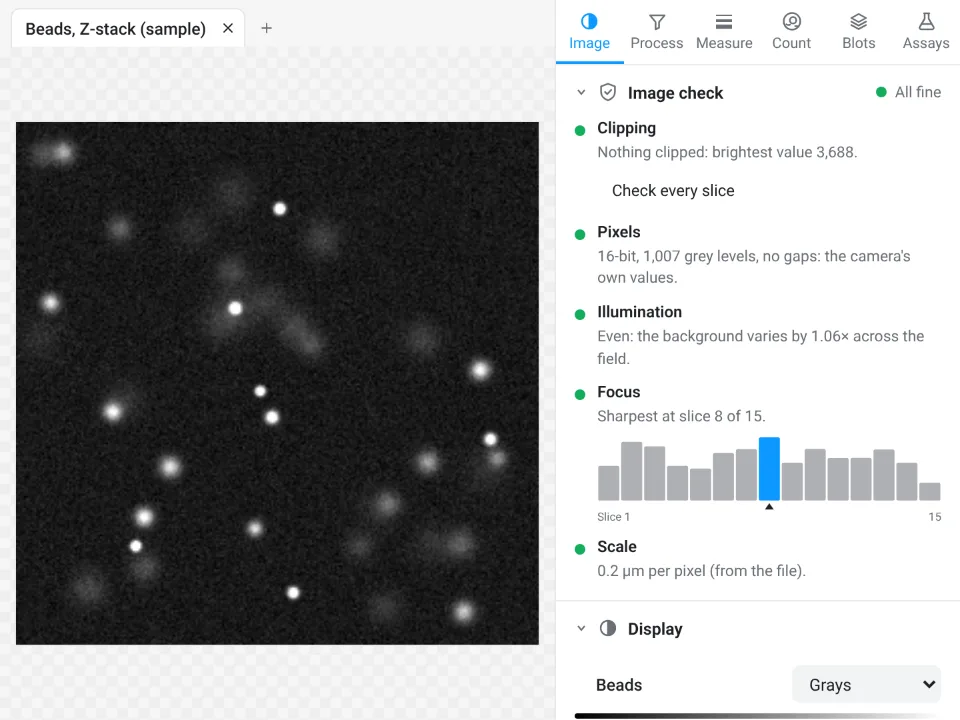
That is the built-in bead Z-stack sample: nothing clipped, brightest value 3,688. The Display section has a histogram per channel with minimum and maximum sliders, and Auto saturates 0.35% of the pixels at each end of the display only; every measurement reads the raw values.
Why it is a good choice for checking images:
- It is automatic: no histogram to open, no Max to compare by hand. It knows the limits in the table above (255 for 8-bit; 65535, or the 10-, 12- and 14-bit camera maxima, for 16-bit), flags a pile-up at the maximum of any image, and warns once more than 0.1% of the pixels are clipped.
- More than saturation: the same panel checks the Pixels (bit depth, gaps in the histogram, JPEG or a picture from a figure), Illumination, Focus and Scale before you measure.
- Nothing to install: any computer or tablet with a modern browser.
- A methods sentence: the Methods line under each results table states the bit depth measured. It is free with a LabCanvas account, and every measurement is validated in more than 4,000 automated tests.
Open Image Analysis. ImageJ and Fiji are independent open-source projects; LabCanvas is not affiliated with them.
References
- Schneider CA, Rasband WS, Eliceiri KW (2012). NIH Image to ImageJ: 25 years of image analysis. Nature Methods 9, 671–675. doi:10.1038/nmeth.2089
Frequently asked questions
How do I check for saturated pixels in ImageJ?
Run Analyze › Histogram (Ctrl H) and read Max: if it equals the largest value the camera can record (255 for 8-bit, 4095 for a 12-bit camera, 65535 for 16-bit), some pixels are saturated, and a Mode equal to Max confirms a pile-up there. To see where they are, apply Image › Lookup Tables › HiLo with the display range set to the full range: saturated pixels turn red.
What does the HiLo LUT show?
HiLo is a grey lookup table in which the lowest value of the display range is blue and the highest is red. With the display range set to the full range of the data type (Image › Adjust › Brightness/Contrast › Set, 0 to 65535 for 16-bit), red pixels are saturated and blue pixels are at zero. After an automatic contrast stretch it shows the pixels above the narrowed display maximum, which are not saturated.
Why are saturated pixels a problem?
A saturated pixel records the maximum value whatever the true brightness was, so the mean, integrated density and any ratio of bright objects are underestimated, and bright and dim objects look more alike than they are. In our clipped example the brightest nucleus measured 12.3 times its original mean instead of 15 times, and the bright-to-dim ratio fell from 1.63 to 1.35.
Can I fix saturated pixels after acquisition?
No. The values above the limit were never recorded, and no filter or software brings them back. Measure only objects without clipped pixels, or take the image again with a shorter exposure, lower gain or laser power. For figures, saturation is acceptable only if no intensity is compared.
Why is my 16-bit image saturated at 4095?
Many cameras record 12 bits (0 to 4095) and store them in a 16-bit file. Such a camera saturates at 4095, not 65535, so a Max of 4095 means clipping even though the file could hold more. 14-bit cameras saturate at 16383; some software shifts the data so the top becomes 65520 or similar.
Does Brightness/Contrast cause saturation?
Not in the data. Image › Adjust › Brightness/Contrast and Auto change only the display, unless you click Apply, which rewrites the pixel values of 8-bit and 16-bit images. Measure on an image whose contrast has not been applied.
Is there an easier way to check images for saturation?
Yes: LabCanvas Image Analysis runs an image check on every image it opens in the browser and reports the share of clipped pixels against the camera's limit; see the last section of this guide.
Try it in LabCanvas
Every app is free to start in your browser. Create an account and begin.
Start Image Analysis free in your browserKeep reading

ImageJ vs LabCanvas Image Analysis: an honest comparison
ImageJ/Fiji or LabCanvas Image Analysis? Six everyday jobs done in both, six newer ones (macros, vendor files, 3D, StarDist, big images) and which to use.

How to use ImageJ: a beginner's tutorial for the 10 everyday jobs (2026)
How to use ImageJ and Fiji: get started, open an image, then 10 everyday jobs (scale, measure, threshold, count, background, blots) with exact menu paths.

How to set the scale and add a scale bar in ImageJ (with a calibration image to practise on)
Set the scale in ImageJ (Analyze › Set Scale) from a micrometer, scale bar or pixel size, add a scale bar, and practise on a free calibration image.