LUTs in ImageJ: which lookup table to use (and colour-blind-safe choices)
ImageJ lookup tables compared on one image: Grays, Fire, viridis, HiLo and the rest, how to add a calibration bar, and colour-blind-safe channel colours.
Contents
To change the colours of an image in ImageJ, choose a table under Image › Lookup Tables (Grays, Fire, Ice, Spectrum, Green, Magenta and the others). A lookup table (LUT) changes only how the pixel values are shown, never the values themselves, so your measurements stay the same. Use Grays for detail, a perceptually even table such as viridis with a calibration bar (Analyze › Tools › Calibration Bar…) to show intensity, and green with magenta rather than red with green for two channels, so that colour-blind readers can see them.
What is a lookup table?
A lookup table is a list of 256 colours, one for each step of the display range. ImageJ maps the display range (set in Image › Adjust › Brightness/Contrast) onto those 256 steps: the minimum gets the first colour, the maximum the last, and everything in between is spread evenly. An 8-bit image uses the table directly; a 16-bit or 32-bit image is scaled into it for display.
Two consequences matter every day:
- The data do not change. We measured the nuclei sample under Grays and under Fire: the mean was 1224.1238 both times.
- The picture depends on the display range as much as on the table. The same table over 316–5200 and over 0–65535 gives two different-looking images of the same data. A colour means a value only when a calibration bar or the legend gives the range.
Which LUTs come with ImageJ?
ImageJ 1.x has 12 tables built in, in Image › Lookup Tables: Fire, Grays, Ice, Spectrum, 3-3-2 RGB, Red, Green, Blue, Cyan, Magenta, Yellow and Red/Green. Above them sit Invert LUT and Apply LUT. Any .lut file in ImageJ's luts folder is added below the built-in ones. Fiji ships that folder full: HiLo, the matplotlib tables (mpl-viridis, mpl-inferno, mpl-magma, mpl-plasma), glasbey for label images and many more. Image › Color › Display LUTs shows every table you have in one window.
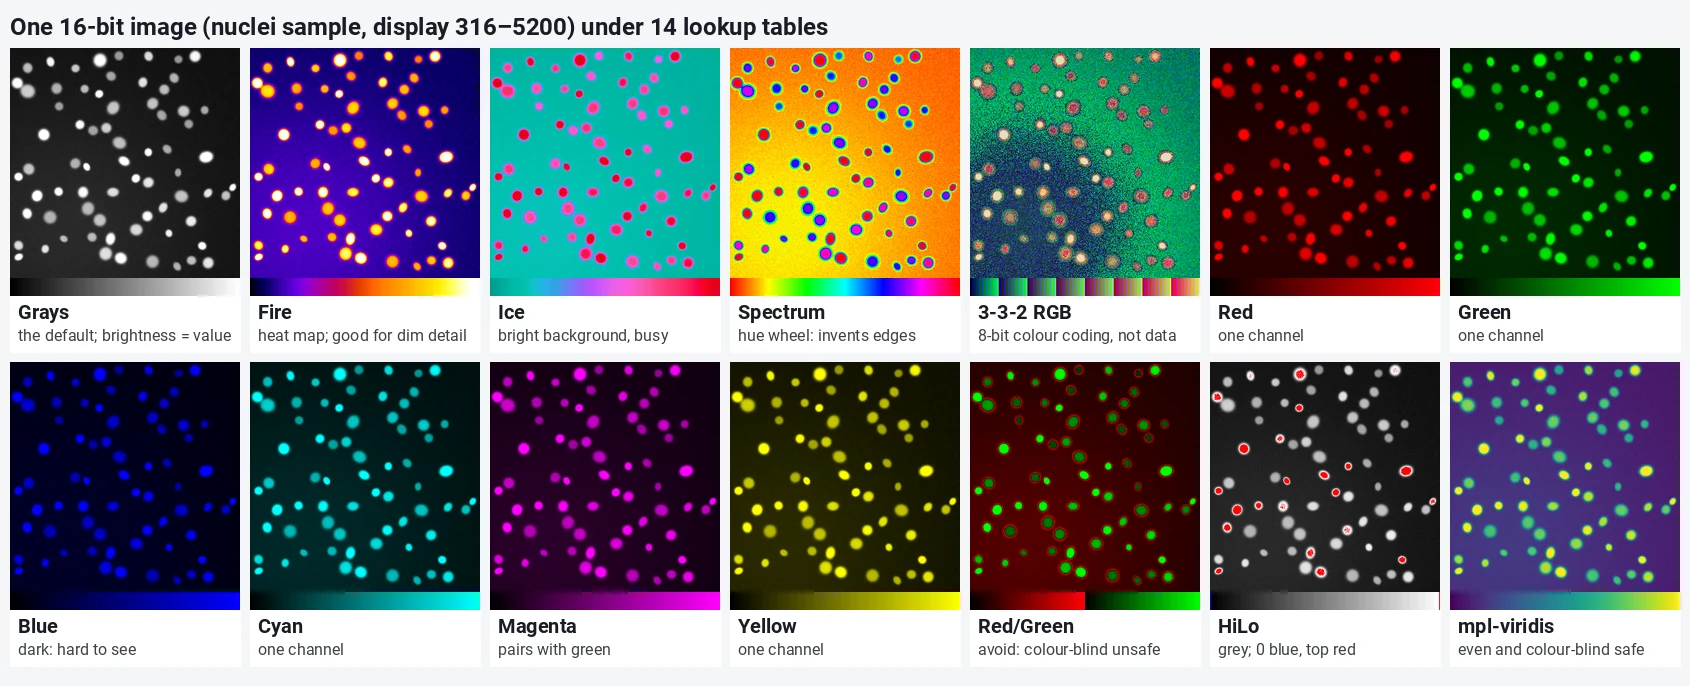
Here is the same 16-bit image, display range 316–5200, under the 12 built-in tables plus HiLo and viridis, each rendered by ImageJ, with its colour ramp underneath:
| LUT | Good for | Watch out for |
|---|---|---|
| Grays | Seeing detail and judging brightness; the default | Small differences in bright areas are hard to see |
| Fire | Showing intensity in one channel, with a calibration bar | Not perceptually even: the jump from red to yellow looks bigger than it is |
| mpl-viridis (Fiji) | Intensity maps, ratio images, anything with a scale; even and colour-blind safe | Not in plain ImageJ 1.x unless you add the .lut file |
| Green, Magenta, Cyan, Yellow | One channel of a multichannel image | Blue and Red are dark on a dark background; use them sparingly |
| HiLo | Checking the ends of the display range: 0 blue, top red | For checking, not for figures |
| Spectrum, 3-3-2 RGB | Labelling discrete classes | Invent edges where none exist; never for intensity |
| Ice | A cool alternative to Fire | The bright background is busy on fluorescence images |
| Red/Green | Signed values, such as a difference image | Invisible to red-green colour-blind readers |
Why not a rainbow?
Spectrum runs through the hue circle, and the eye sees sharp bands where the hue changes quickly (yellow, cyan) and flat areas where it changes slowly. That turns a smooth gradient into apparent edges and can make a 5% difference look like a step. Viridis was designed to rise evenly in lightness from dark purple to yellow, so equal steps in value look like equal steps in colour, and it still reads correctly in greyscale and for colour-blind readers.
How do I change and edit a LUT in ImageJ?
- Click the image, then choose a table under Image › Lookup Tables. For a multichannel (composite) image, pick the channel first with the slider or Image › Color › Channels Tool… (Ctrl Shift Z); each channel has its own table.
- Set the display range in Image › Adjust › Brightness/Contrast… (Ctrl Shift C). Use the same range for every image you compare: click Set and type the values rather than pressing Auto on each one.
- Image › Color › Show LUT shows the current table as a ramp with its RGB values; Image › Lookup Tables › Invert LUT reverses it (white background, dark objects) without touching the pixels.
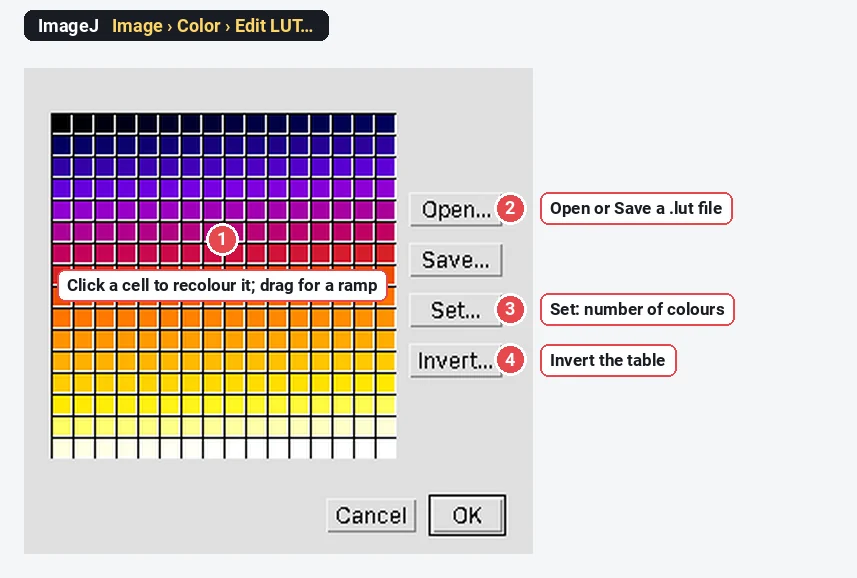
- To make your own, Image › Color › Edit LUT…: click one of the 256 cells to set its colour, or drag across cells to fill a ramp between two colours; Set rescales the table to a number of colours; Save writes a .lut file for the luts folder.
How do I add a calibration bar?
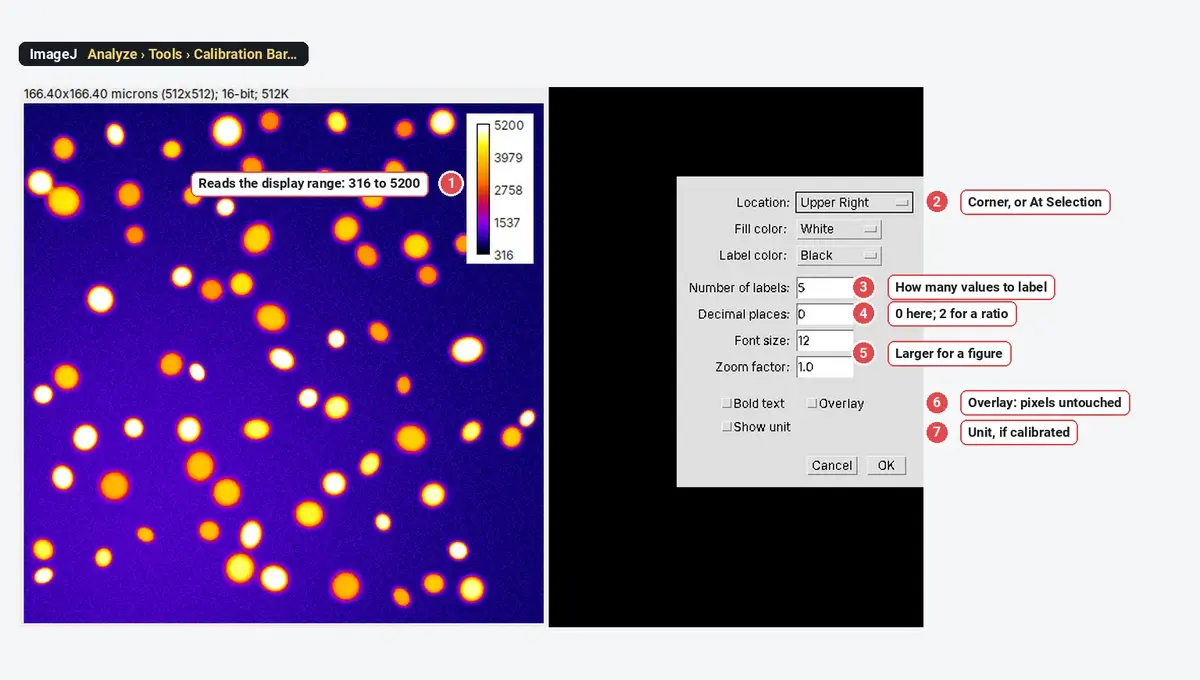
A calibration bar is the key to a false-colour image: it shows which colour means which value. Set the table and the display range first, then:
- Analyze › Tools › Calibration Bar….
- Choose the Location (a corner, or At Selection to place it where you drew a rectangle), the Fill color behind it and the Label color.
- Number of labels (5 by default), Decimal places (0 for raw counts, 2 for a ratio or a normalised image), Font size and Zoom factor (raise both for a figure).
- Tick Overlay so the bar is drawn over the image without changing a pixel. Without it, ImageJ makes a new RGB copy with the bar drawn in. Show unit adds the calibrated unit when the image has one.
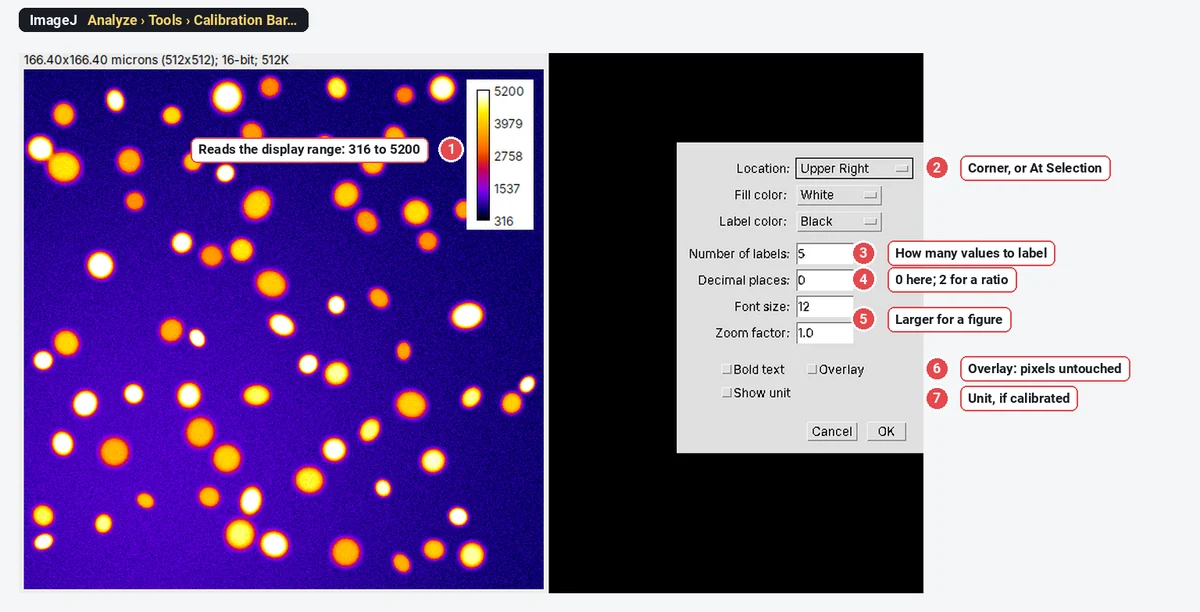
The bar always shows the display range, not the data's minimum and maximum. If you compare two images in false colour, give them the same display range and one bar, or the same colour will mean two different values.
Colour-blind-safe choices: green and magenta, not red and green
About 8% of men of European descent and 0.4% of women have a red-green colour deficiency (Birch 2012). For them a red-and-green merge turns into two similar olive tones, and the yellow of the overlap disappears. Green with magenta keeps the two channels apart, and the overlap turns white (Wong 2011).
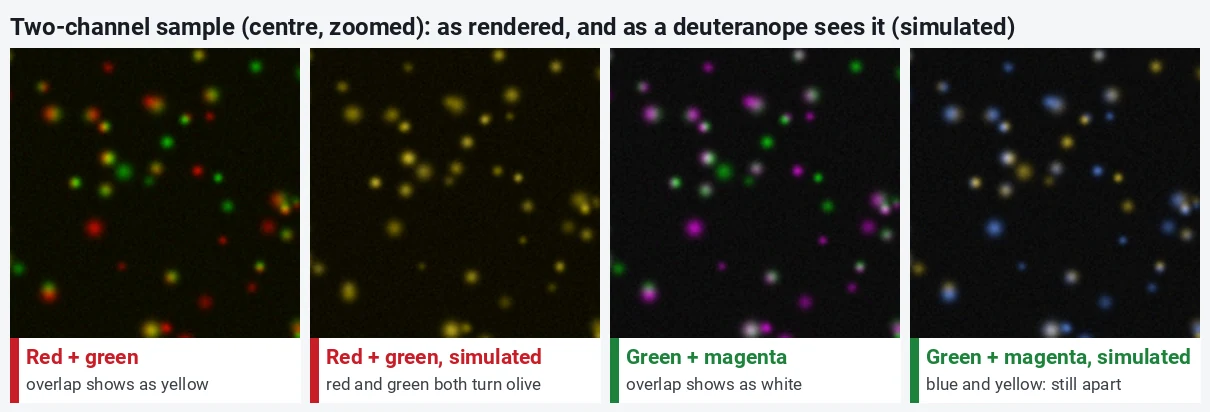
To do it in ImageJ:
- Merging separate images: Image › Color › Merge Channels… and put the channels in C2 (green) and C6 (magenta), with Create composite ticked so you can still change each channel.
- An existing composite: select the red channel with the slider and choose Image › Lookup Tables › Magenta.
- Three channels: cyan, magenta and yellow, or green, magenta and grey; or show each channel in grey side by side, which works for everyone and lets readers judge intensity.
Check a finished figure with our figure colour-blindness checker, and pick plot and label colours from colour-blind-safe palettes.
LUTs don't change data, but these commands do
- Image › Lookup Tables › Apply LUT writes the current display range into the pixel values of an 8-bit or 16-bit image (with the option to do the whole stack). After it, the data are rescaled and often clipped.
- Image › Type › RGB Color and Image › Color › Stack to RGB bake the colours in: the result has three 8-bit channels of display colours, not your intensities.
- Brightness/Contrast › Apply does the same as Apply LUT.
Measure on the original, then make the coloured copy for the figure.
Pitfalls
- Comparing images with different display ranges. The same colour then means different values. Set the range by hand and use one calibration bar.
- Pressing Auto on every image. Each gets its own range, and a dim control looks as bright as the treated sample.
- Rainbow tables for intensity. Spectrum adds edges that are not there. Use viridis or Fire with a bar.
- Red and green for two channels. Use green and magenta.
- Measuring the RGB copy. After RGB Color or Apply LUT, the values are display colours. Measure the original.
- Inverted LUT confusion. With Invert LUT, dark means high. Thresholds and Black background settings then look the wrong way round. Look at the colour ramp (Image › Color › Show LUT) when a mask behaves oddly.
Reporting it
Images are shown with the [Fire] lookup table over a display range of [316–5200] (calibration bar), identical for all panels; pixel values were not changed for display.
For multichannel figures, name the colour of each channel in the legend ("DAPI in grey, protein X in green, protein Y in magenta").
An easier way: lookup tables in LabCanvas
LabCanvas Image Analysis keeps display and data apart in the same way, in the browser, with nothing to install and no .lut files to add.
- Open the image and go to the Image tab, Display.
- Choose Composite, One channel or Gray, and give each channel a lookup table: Grays, Red, Green, Blue, Cyan, Magenta, Yellow, Fire, Ice, Viridis, Inferno, Spectrum or Inverted grays.
- Set the minimum and maximum with the sliders or the fields (Auto or Full if you prefer).
- Tick Colour scale bar for a calibration bar in a corner, with a title such as "Ratio 405/488".
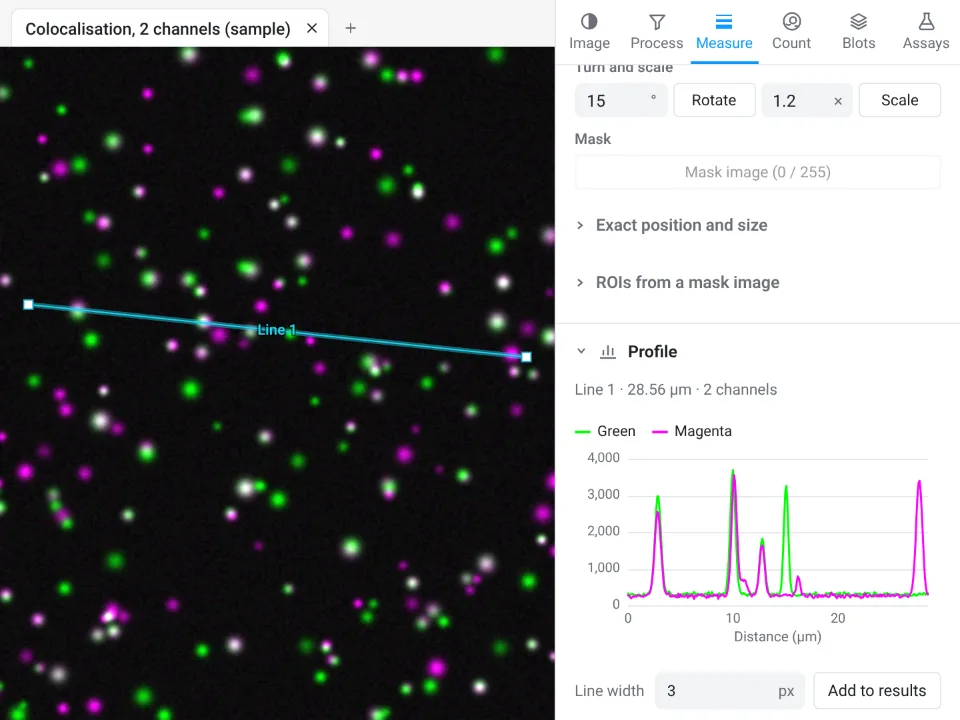
Why it is a good choice for figures:
- Nothing to install: it runs in the browser on any computer or tablet, and Viridis and Inferno are built in.
- Every measurement reads the raw 8-, 16- or 32-bit values whatever table is shown, and the panel says which bit depth is measured.
- An image check flags clipped pixels and JPEG compression before you measure.
- Add to a figure puts the image with its colours and colour scale bar on a figure canvas, free with a LabCanvas account; every measurement is checked in more than 4,000 automated tests.
ImageJ and Fiji have far more tables, a LUT editor and macros that apply a table to a thousand files; LabCanvas covers the tables most figures need. Open Image Analysis.
ImageJ and Fiji are independent open-source projects; LabCanvas is not affiliated with them.
References
- Wong B (2011). Points of view: Color blindness. Nature Methods 8, 441. doi:10.1038/nmeth.1618
- Birch J (2012). Worldwide prevalence of red-green color deficiency. Journal of the Optical Society of America A 29(3), 313–320. doi:10.1364/JOSAA.29.000313
- Machado GM, Oliveira MM, Fernandes LAF (2009). A physiologically-based model for simulation of color vision deficiency. IEEE Transactions on Visualization and Computer Graphics 15(6), 1291–1298. doi:10.1109/TVCG.2009.113
Frequently asked questions
What is a LUT in ImageJ?
A lookup table (LUT) maps each pixel value to the colour on screen: in Grays, 0 is black and the top of the display range is white; in Fire, the same values run from black through blue, red and yellow to white. It changes only how the image looks; the pixel values, and every measurement, stay the same.
Which LUT should I use for a fluorescence image?
For one channel, Grays shows the most detail, because the eye judges brightness best in grey. For intensity differences, a perceptually even table such as viridis (mpl-viridis in Fiji) or Fire with a calibration bar. For two or more channels, green and magenta, or cyan, magenta and yellow, rather than red and green.
Does changing the LUT change my data?
No. Image › Lookup Tables only changes the display: the mean of our sample was 1224.1238 in Grays and in Fire. Two commands do change the pixels: Image › Lookup Tables › Apply LUT, which writes the display range into the values, and converting to RGB (Image › Type › RGB Color), which bakes the colours in. Measure before either.
How do I add a calibration bar in ImageJ?
Choose the LUT and the display range first, then Analyze › Tools › Calibration Bar…. Pick the Location, Fill and Label colours, Number of labels, Decimal places, Font size and Zoom factor, and tick Overlay so the bar does not change the pixels. The bar shows the display range, so set that to the range you mean before you add it.
Why use green and magenta instead of red and green?
About 8% of men of European descent have a red-green colour deficiency, and for them red and green look nearly the same, so a red/green merge loses the information. Green and magenta stay distinct for them, and the overlap is white instead of yellow.
Where are viridis and HiLo in ImageJ?
They are not built into ImageJ 1.x: its own tables are Fire, Grays, Ice, Spectrum, 3-3-2 RGB, Red, Green, Blue, Cyan, Magenta, Yellow and Red/Green. Fiji adds many more in Image › Lookup Tables, including HiLo and the matplotlib tables (mpl-viridis, mpl-inferno, mpl-magma, mpl-plasma). In ImageJ 1.x, any .lut file in the luts folder appears in the menu.
Try it in LabCanvas
Every app is free to start in your browser. Create an account and begin.
Start Image Analysis free in your browserKeep reading

ImageJ vs LabCanvas Image Analysis: an honest comparison
ImageJ/Fiji or LabCanvas Image Analysis? Six everyday jobs done in both, six newer ones (macros, vendor files, 3D, StarDist, big images) and which to use.

How to use ImageJ: a beginner's tutorial for the 10 everyday jobs (2026)
How to use ImageJ and Fiji: get started, open an image, then 10 everyday jobs (scale, measure, threshold, count, background, blots) with exact menu paths.

How to set the scale and add a scale bar in ImageJ (with a calibration image to practise on)
Set the scale in ImageJ (Analyze › Set Scale) from a micrometer, scale bar or pixel size, add a scale bar, and practise on a free calibration image.