Merge, split and overlay channels in ImageJ (and make a composite figure)
Merge channels in ImageJ with Image › Color › Merge Channels, split them with Split Channels, overlay with Add Image, and build a colour-blind-safe figure.
Contents
To merge channels in ImageJ, open one image per channel and choose Image › Color › Merge Channels…: put each image in a colour slot (C2 green and C6 magenta for two channels), tick Create composite and Ignore source LUTs, and click OK. Image › Color › Split Channels does the reverse, and Image › Overlay › Add Image… lays one image over another with a chosen opacity.
A merge is for looking; numbers come from the separate channels. This guide shows the dialogs on a two-channel image, the one setting that silently overrides your colours, why an RGB merge must not be measured, and how to build a figure that colour-blind readers can read. All the commands here are in ImageJ 1.x, so they are the same in Fiji.
Three words first: channel, composite, RGB
- A channel is one fluorescence signal (DAPI, GFP, a far-red dye) stored as its own grey image, usually 16-bit.
- A composite is ImageJ's multichannel image: every channel keeps its raw values, its lookup table (LUT, the colour it is drawn in) and its own brightness range, and the colours are added together on screen.
- An RGB image is a flat picture: 8 bits each of red, green and blue, made from whatever was on screen. Fine for a figure, wrong for measuring.
The worked example is a synthetic two-channel image: 384 × 384 pixels, 16-bit, 0.1 µm per pixel, with spots in each channel, some of them in both.
How do I merge channels in ImageJ?
- Open the single-channel images. They must have the same width and height; for a stack, the same number of slices.
- Choose Image › Color › Merge Channels….
- Pick an image for each colour you need and leave the rest at None. For two channels, use C2 (green) and C6 (magenta).
- Tick Create composite to keep the raw 16-bit channels. Untick it and you get a 24-bit RGB image instead.
- Tick Keep source images if you still want the single-channel windows afterwards.
- Tick Ignore source LUTs if the images already have colours (for example after Split Channels). Without it, ImageJ keeps each image's own LUT and ignores the slot: when we put a red-LUT image in C2 and a green-LUT image in C6 with this box unticked, the merge came out red and green, not green and magenta.
- Click OK, then set each channel's brightness in Image › Adjust › Brightness/Contrast… (move the channel slider between channels).
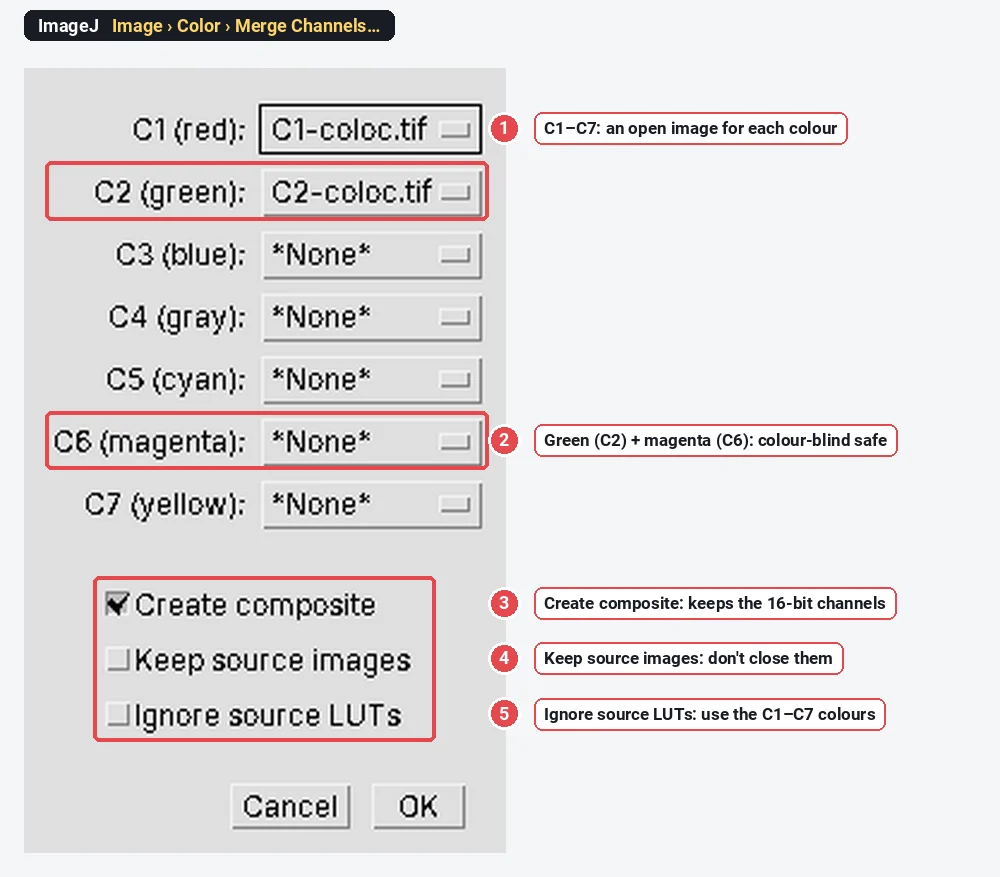
Three or more channels: the classic choice is blue for the nuclear stain (C3) with green and magenta for the two signals, or cyan, magenta and yellow. Beyond four channels, show the channels side by side rather than one crowded merge.
How do I split channels in ImageJ?
Select the multichannel image and choose Image › Color › Split Channels. Each channel becomes its own window, named C1-name, C2-name and so on, with its original bit depth and values, so you can threshold or measure one channel without the others. An RGB image splits into three 8-bit images named (red), (green) and (blue).
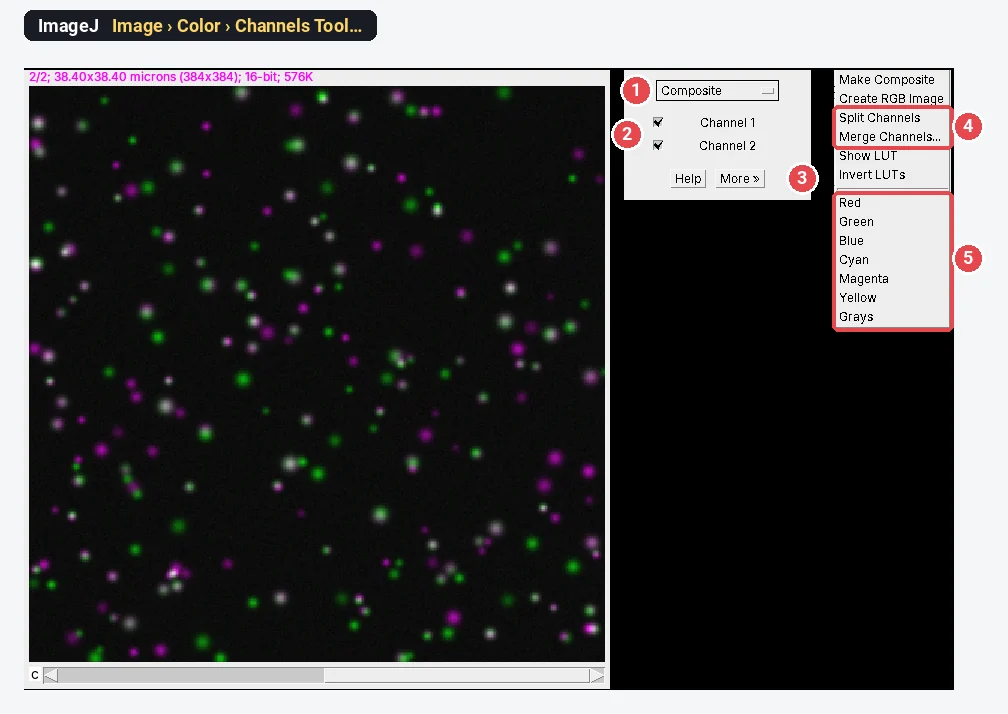
The Channels Tool (Image › Color › Channels Tool…) is the control panel for a composite: the display mode, a checkbox per channel to hide or show it, and under More » the colours and the split, merge and RGB commands.
| Display mode | What you see |
|---|---|
| Composite | All ticked channels added together, each in its colour |
| Color | One channel at a time, in its colour |
| Grayscale | One channel at a time, in grey (best for judging faint signal) |
How do I overlay one image on another?
Image › Overlay › Add Image… draws a second image on top of the current one as an overlay. Typical uses: a fluorescence channel on a brightfield or phase image, or an inset. Pick the image, its position (X and Y of its top-left corner, in pixels) and an Opacity: 100 hides what is underneath, 50 shows both. Zero transparent lets the background show through wherever the added image is 0.
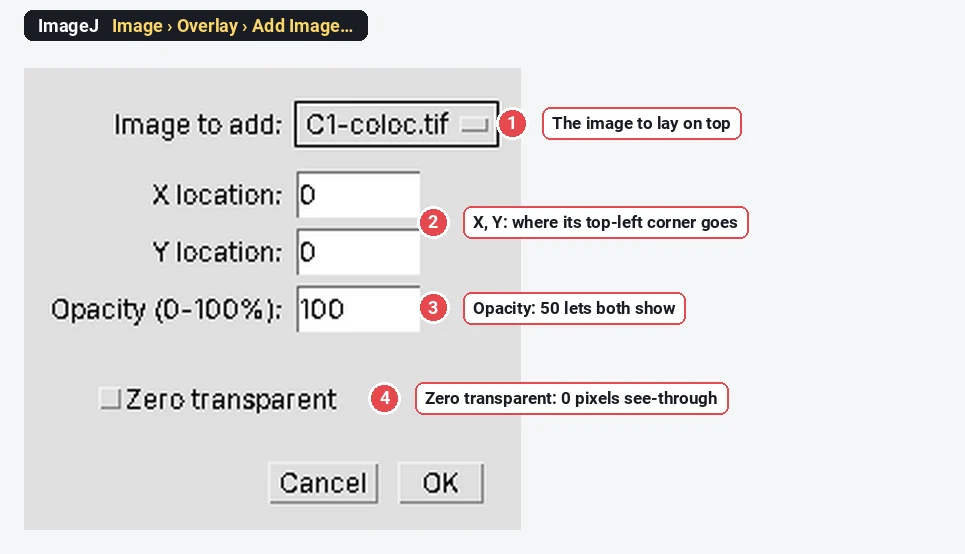
An overlay is a drawing on top of the image, not part of its pixels: measurements ignore it, and it is saved only in TIFF files. Image › Overlay › Flatten makes an RGB copy with the overlay burned in, for a figure; Image › Overlay › Remove Overlay takes it off.
If both images are fluorescence channels of the same field, a merge (above) is better than an overlay: it keeps both channels measurable.
Why measure on the separate channels, not the RGB merge?
Image › Color › Stack to RGB (or Image › Type › RGB Color) turns a composite into the picture you see. Two things happen on the way: each channel is squeezed into 0–255, and the squeeze follows the display range you happened to set. The same raw data then give different numbers.
We measured channel 2 of the sample both ways:
| Channel 2, whole image | Mean | Pixels at the top value |
|---|---|---|
| Raw 16-bit channel | 352.6 | none (maximum 5,469) |
| RGB merge, display set by Enhance Contrast (0.35% saturated), green component | 21.7 | 272 at 255 |
| The same merge after halving the display maximum | 42.2 | 3,253 at 255 |
Nothing about the sample changed between the last two rows; only the display did, and the mean doubled while twelve times as many pixels were clipped. Measure intensities, ratios and colocalisation on the raw channels (in the composite, with the ROI Manager's Multi Measure, or after Split Channels), and keep RGB for the figure. The ROI Manager guide shows how to measure the same regions on every channel.
Which colours are colour-blind safe?
About 1 in 12 men and 1 in 200 women have red-green colour vision deficiency. For them, a red and green merge is a picture in one colour: the two channels and their overlap look the same. Green and magenta keep the channels apart, and overlap still shows as white.
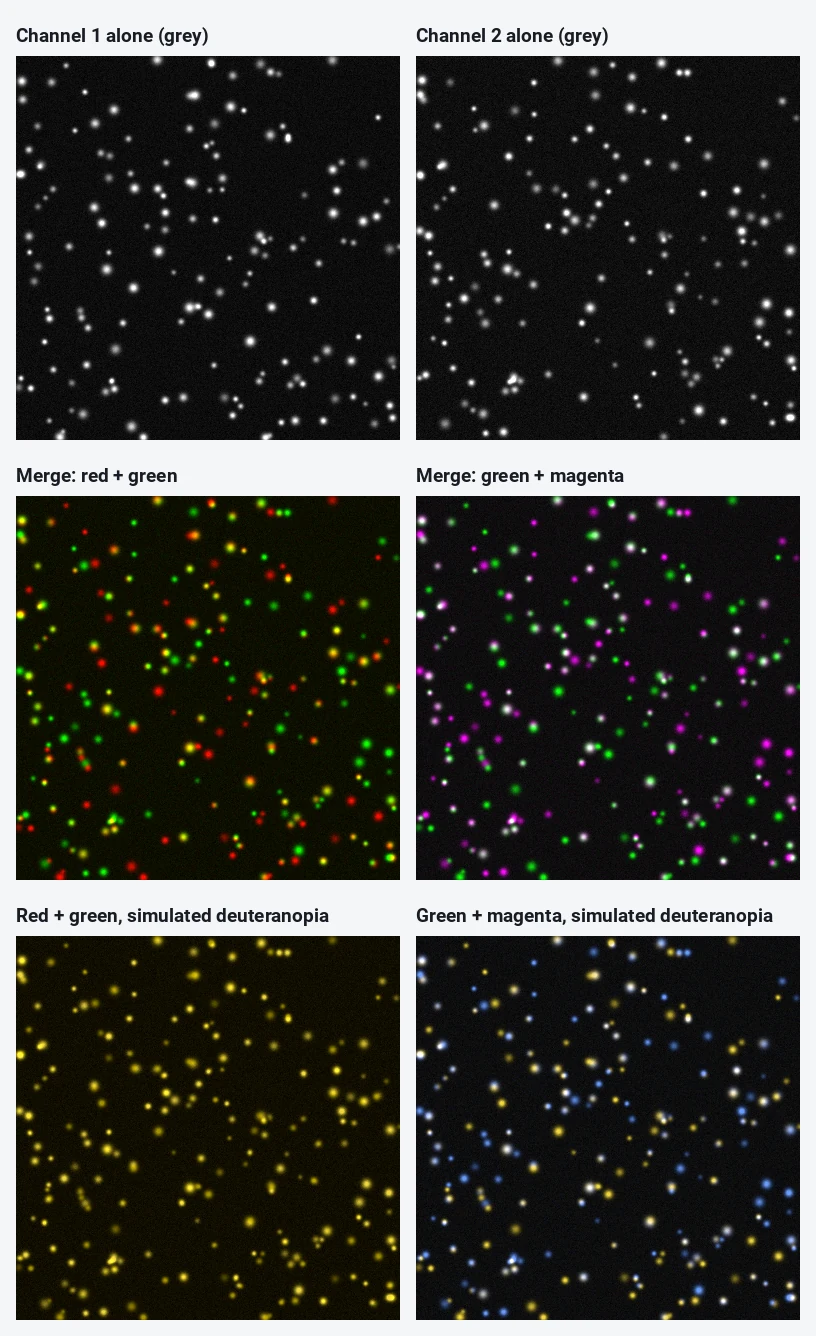
- Two channels: green and magenta.
- Three channels: green, magenta and blue (blue is dim on screen, so use it for the nuclear stain), or cyan, magenta and yellow.
- Always show each channel alone in grey beside the merge: the eye judges grey far better than colour, and faint signal is easier to see.
- Check the finished figure with the colour-blindness checker, and see LUTs in ImageJ for false-colour tables such as Fire and Viridis.
Making the composite figure in ImageJ
- Set the brightness of each channel once (Image › Adjust › Brightness/Contrast…), with the same settings for every image you will compare. Write the ranges down.
- Add a scale bar: Analyze › Tools › Scale Bar… (see scale bars and Set Scale).
- For the merge: Image › Color › Stack to RGB. For each channel in grey: switch the Channels Tool to Grayscale, show one channel and use Image › Duplicate… then Image › Type › RGB Color, or split and convert each.
- Image › Stacks › Images to Stack, then Image › Stacks › Make Montage… puts the panels side by side (or lay them out in a figure editor).
- Save as TIFF or PNG, never JPEG: compression smears the colours of small spots.
Pitfalls
- Ignore source LUTs left unticked. The merge keeps the images' old colours, whatever slots you chose.
- Different display ranges between conditions. If control and treated were adjusted separately, the merge shows a difference the data may not have. Use the same ranges (Brightness/Contrast › Set, with Propagate to all other open images) and say so in the legend.
- Saturated merges. Pushing the contrast until the spots are solid white hides real differences; keep the brightest structures just below the top.
- Yellow is not colocalisation. Overlap in a merge depends on the display ranges. Measure it with Pearson's and Manders' coefficients; see colocalisation analysis.
- Channel shift. Different wavelengths can be offset by a pixel or two (chromatic aberration). Image a multicolour bead and check the merge before you trust overlap.
- Measuring the RGB. See above: always measure the raw channels.
Reporting it
Channels were merged in [Fiji (ImageJ 1.54)] as a composite ([GFP] in green, [mCherry] in magenta) with Image › Color › Merge Channels; the same display ranges were applied to all conditions ([GFP 120–3,600; mCherry 90–3,200]). Single channels are shown in grey. Intensities were measured on the raw 16-bit channels, not on the RGB images.
Cite ImageJ (Schneider et al. 2012) or Fiji (Schindelin et al. 2012).
An easier way: channels and figures in LabCanvas
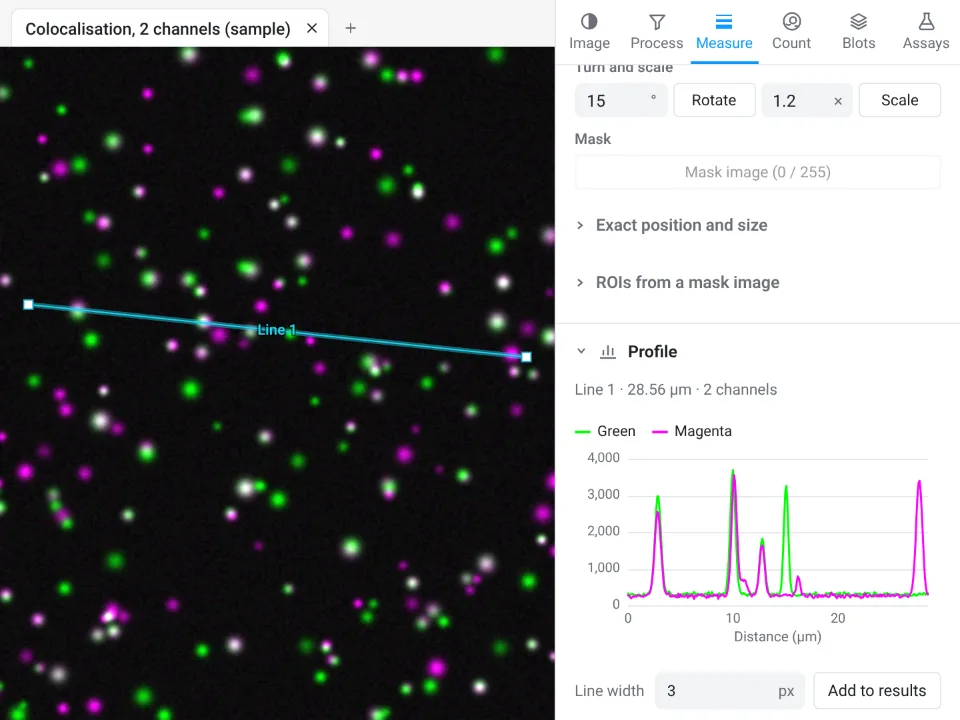
LabCanvas Image Analysis shows, measures and sends the channels of a multichannel TIFF to a figure in the browser, with nothing to install. It opens an ImageJ hyperstack or OME-TIFF as one image with its channels.
- Click Open an image and choose the multichannel TIFF, or the two-channel sample on the start screen.
- In Image › Display, choose Composite, One channel or Gray, and give each channel a lookup table (Green and Magenta for two channels); Auto or the minimum and maximum set the brightness. Display changes only the picture.
- File › Add channels to a figure (or Each channel and the merge) sends every channel and the merge, side by side with the scale bar, to the figure, slide or poster open in another tab; tick Grey for the single channels in grey.
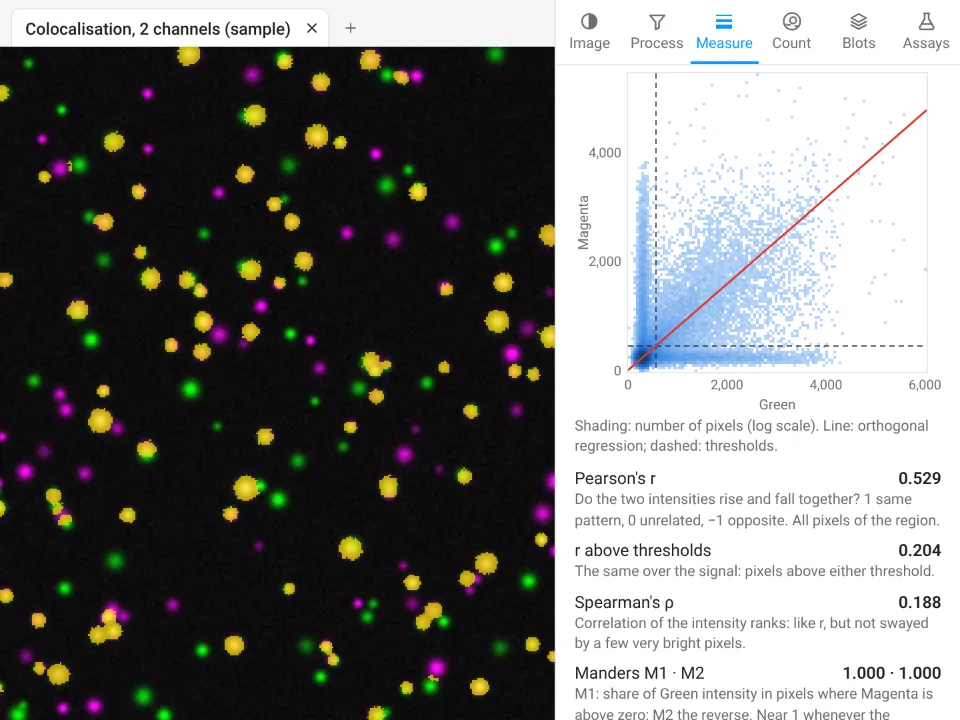
- To measure across channels, use Measure › Colocalisation, or Measure with All channels for one row per ROI per channel.
Why it is a good choice for multichannel figures:
- Nothing to install: it runs in the browser on any computer or tablet.
- The RGB trap cannot happen: every measurement, threshold and assay reads the raw channel values, whatever the display.
- Channels and merge into a figure in one step, with the scale bar, instead of Stack to RGB, Images to Stack and Make Montage.
- Colocalisation on the raw values: Pearson's r and Manders' coefficients with Costes thresholds.
- Free with a LabCanvas account: adding to a figure, measuring, Copy and Send to Graphs; downloading files (PNG, TIFF, CSV) is part of LabCanvas Pro.
LabCanvas does not merge separate single-channel files into one image: if your microscope saves one file per channel, merge them in ImageJ or Fiji (above) and save the composite as TIFF, or export a multichannel TIFF from the acquisition software. Fiji is also the tool for files in a maker's own format (.czi, .nd2, .lif). Open Image Analysis and try the two-channel sample. ImageJ and Fiji are independent open-source projects; LabCanvas is not affiliated with them.
References
- Machado GM, Oliveira MM, Fernandes LAF (2009). A physiologically-based model for simulation of color vision deficiency. IEEE Transactions on Visualization and Computer Graphics 15, 1291–1298. doi:10.1109/TVCG.2009.113
- Schindelin J, Arganda-Carreras I, Frise E, et al. (2012). Fiji: an open-source platform for biological-image analysis. Nature Methods 9, 676–682. doi:10.1038/nmeth.2019
- Schneider CA, Rasband WS, Eliceiri KW (2012). NIH Image to ImageJ: 25 years of image analysis. Nature Methods 9, 671–675. doi:10.1038/nmeth.2089
Frequently asked questions
How do I merge channels in ImageJ?
Open the single-channel images (same width and height), choose Image › Color › Merge Channels…, pick an image for each colour (C1 red, C2 green, C3 blue, C4 gray, C5 cyan, C6 magenta, C7 yellow), tick Create composite and click OK. Tick Ignore source LUTs if the images already have colours, or their own colours win.
How do I split channels in ImageJ?
Select the multichannel image and choose Image › Color › Split Channels. A composite or hyperstack becomes one image per channel (C1-name, C2-name and so on) with its original values; an RGB image becomes three 8-bit images named (red), (green) and (blue).
How do I overlay two images in ImageJ?
Select the bottom image and choose Image › Overlay › Add Image…, pick the image to lay on top, set its X and Y position and an Opacity such as 50%, and click OK. The overlay is only drawn on screen; Image › Overlay › Flatten makes an RGB copy with it burned in.
Should I measure intensity on the merged RGB image?
No. An RGB merge has 8 bits per colour and its values depend on the brightness and contrast you set before converting, so the same data can give very different numbers. Measure each channel in the original image or the composite, and use RGB only for the figure.
Which colours should I use for a two-channel merge?
Green and magenta. Where the two overlap the merge is white, and people with red-green colour blindness (about 1 in 12 men) can still tell the channels apart, which they cannot with red and green. For three channels, add blue or show each channel in grey beside the merge.
What is the difference between a composite and an RGB image in ImageJ?
A composite keeps every channel at its original bit depth (for example 16-bit), each with its own lookup table and display range, so you can still measure it. An RGB image is a flat 24-bit picture of what was on screen. Image › Color › Stack to RGB or Image › Type › RGB Color turns a composite into RGB.
Try it in LabCanvas
Every app is free to start in your browser. Create an account and begin.
Start Image Analysis free in your browserKeep reading

ImageJ vs LabCanvas Image Analysis: an honest comparison
ImageJ/Fiji or LabCanvas Image Analysis? Six everyday jobs done in both, six newer ones (macros, vendor files, 3D, StarDist, big images) and which to use.

How to use ImageJ: a beginner's tutorial for the 10 everyday jobs (2026)
How to use ImageJ and Fiji: get started, open an image, then 10 everyday jobs (scale, measure, threshold, count, background, blots) with exact menu paths.

How to set the scale and add a scale bar in ImageJ (with a calibration image to practise on)
Set the scale in ImageJ (Analyze › Set Scale) from a micrometer, scale bar or pixel size, add a scale bar, and practise on a free calibration image.