ROI Manager in ImageJ: measure many regions, save them and open them anywhere
Open the ROI Manager in ImageJ (Analyze › Tools › ROI Manager), add ROIs with T, measure them on every channel, save RoiSet.zip and reopen it later.
Contents
The ROI Manager in ImageJ is under Analyze › Tools › ROI Manager…: draw a selection, press T (or click Add [t]) to store it, repeat for every region, then click Measure to get one row per ROI in the Results table. More » › Save… writes all of them to a RoiSet.zip that you can reopen on the same image later, in ImageJ or Fiji.
An ROI (region of interest) is a selection you keep: a nucleus outline, a band, a line along an axon. The ROI Manager holds a list of them, so you can measure the same regions again on another channel, another image or another day. The ROI Manager is part of ImageJ 1.x, so everything below is the same in Fiji.
The worked example
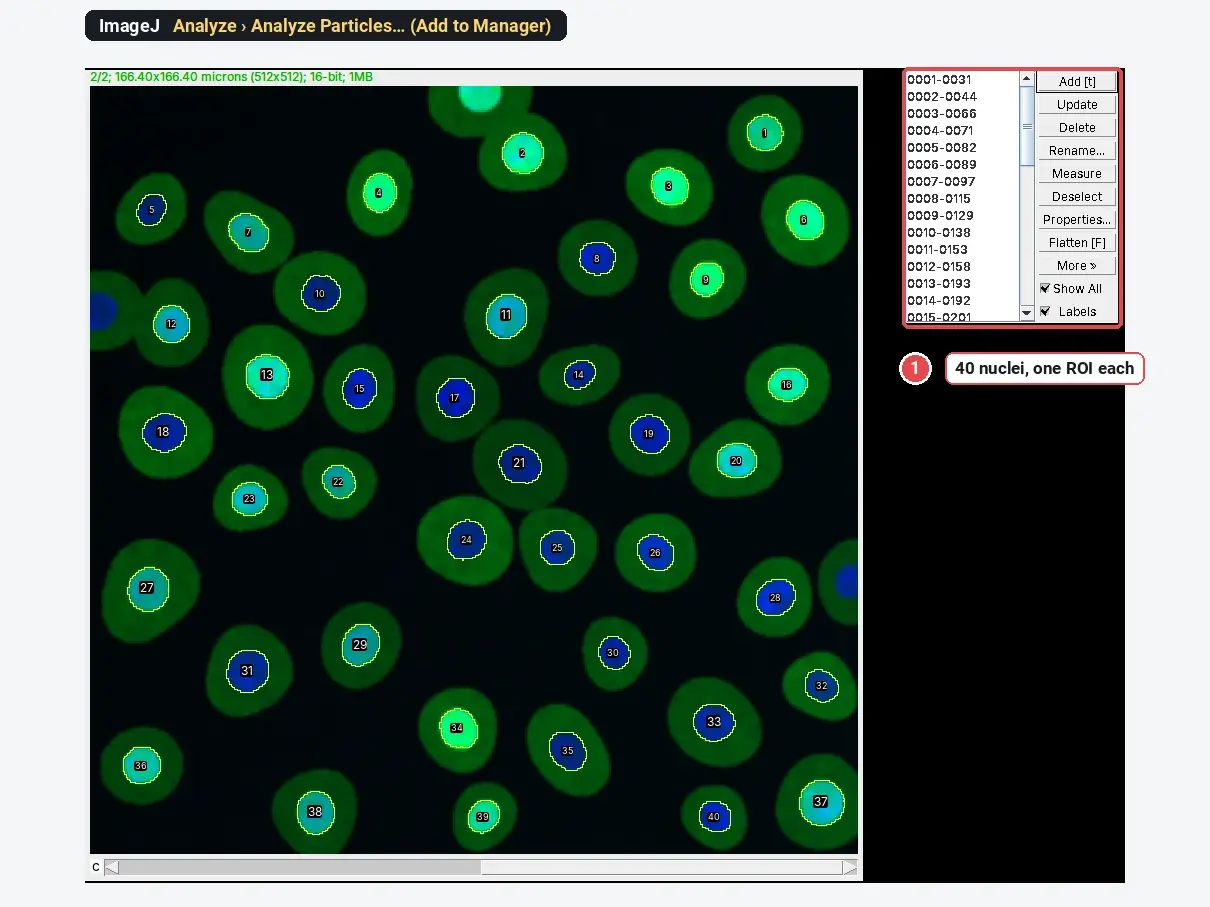
The image is a synthetic two-channel sample of NF-κB translocation: DAPI in channel 1, p65 in channel 2, 512 × 512 pixels at 0.325 µm per pixel. By design, 21 of the 40 whole cells have p65 in the nucleus and 19 keep it in the cytoplasm. The job: outline the nuclei once on the DAPI channel, then measure p65 inside the same outlines.
How do I open the ROI Manager and add ROIs?
- Choose Analyze › Tools › ROI Manager…. The window opens with an empty list.
- Draw a selection with any tool: rectangle, oval, polygon, freehand, wand, line or point.
- Press T or click Add [t]. The ROI appears in the list with an automatic name such as 0001-0031. Pressing T with a selection also opens the ROI Manager if it is closed.
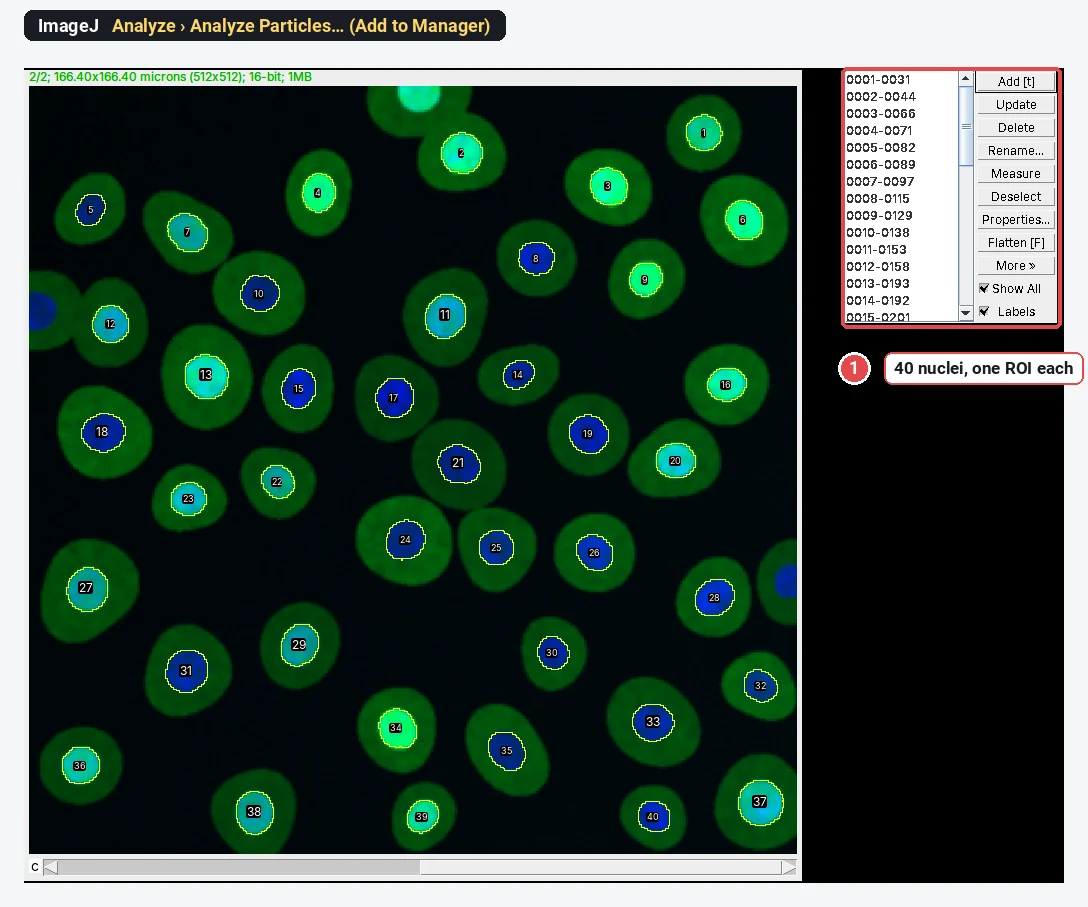
- For many objects at once, let Analyze Particles fill the list: threshold the image and run Analyze › Analyze Particles… with Add to Manager ticked. That is how the 40 nuclei above were made (the steps are in how to count cells in ImageJ).
- Tick Show All to see every ROI on the image and Labels to number them. Click a name in the list to select that ROI on the image.
Make the outlines on a copy if you need to process the image first. Here the DAPI channel was duplicated, thresholded and turned into a mask; the ROIs were then shown on the untouched original, so the measurements read the raw 16-bit values.
What every button in the ROI Manager does
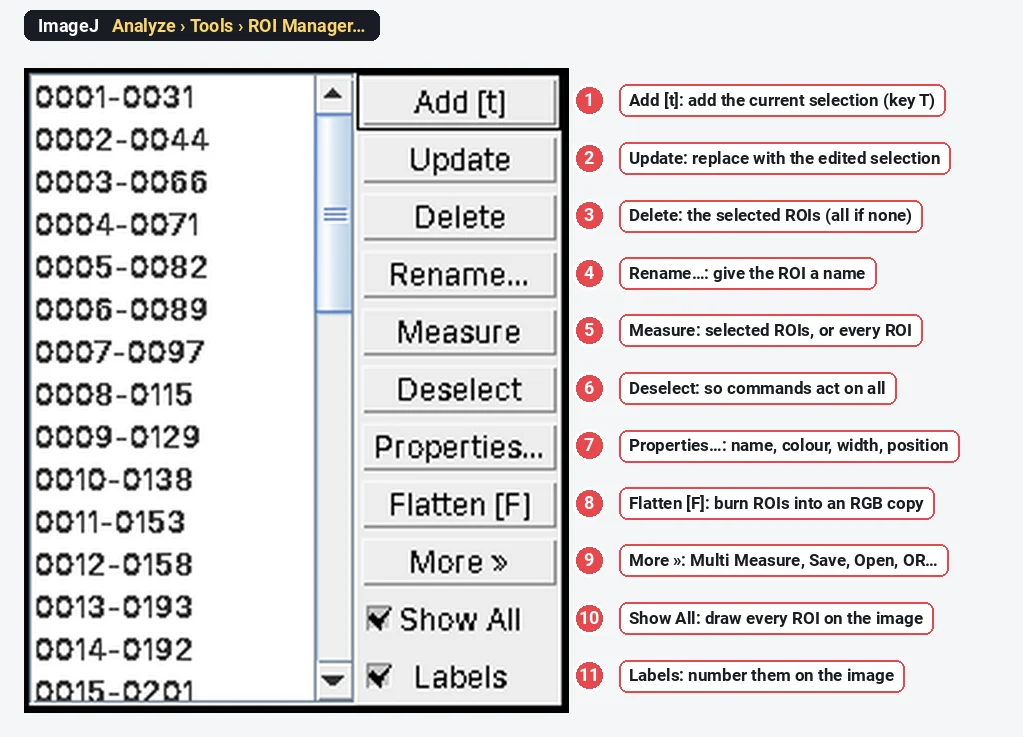
| Button | What it does |
|---|---|
| Add [t] | Adds the selection on the image to the list (key T) |
| Update | Replaces the selected ROI with the selection you have just edited (moved, resized, reshaped) |
| Delete | Removes the selected ROIs; with none selected it offers to delete them all |
| Rename… | Gives the selected ROI a name, which then appears in the Label column if Display label is ticked in Analyze › Set Measurements… |
| Measure | Measures the selected ROIs, or every ROI when none is selected: one row each, with the columns chosen in Set Measurements |
| Deselect | Clears the selection in the list, so the next command acts on every ROI |
| Properties… | Name, position (channel, slice, frame), stroke colour and width, fill colour |
| Flatten [F] | Makes an RGB copy of the image with the ROIs burned in, for a figure. The original is not changed |
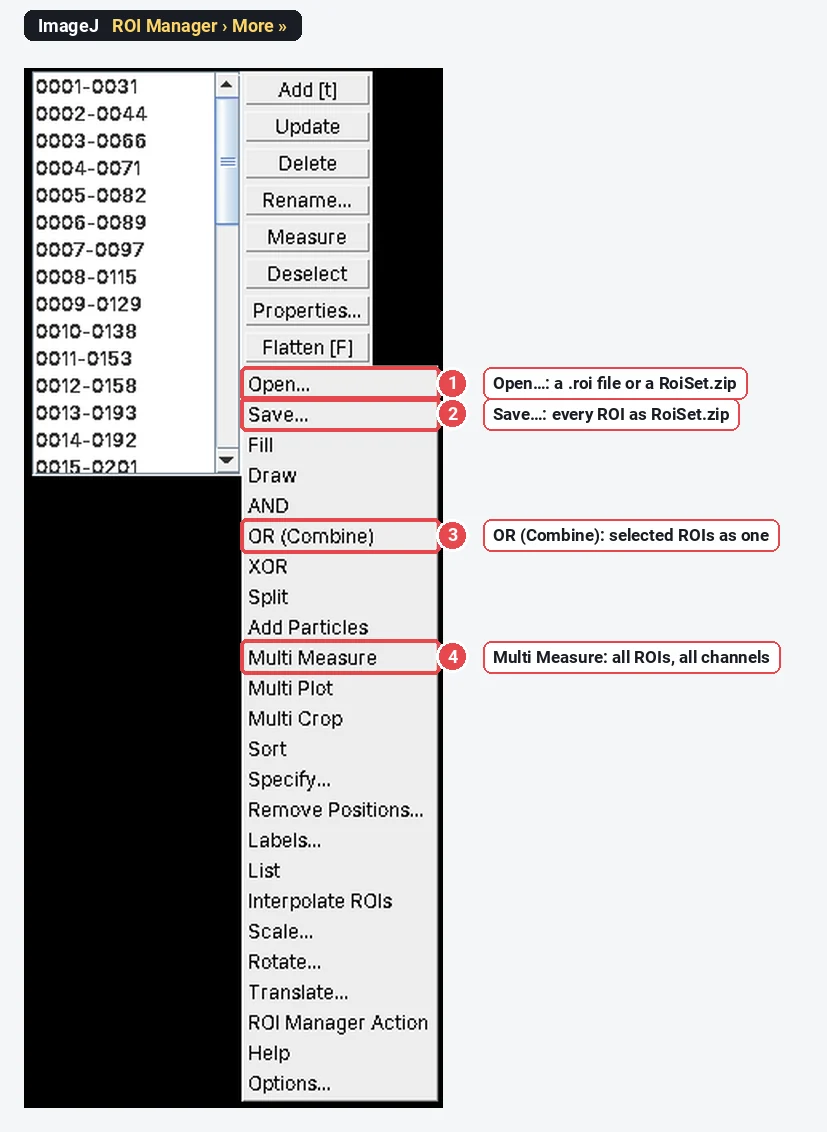
| More » | Everything else: Open, Save, Fill, Draw, AND, OR (Combine), XOR, Split, Multi Measure, Multi Plot, Multi Crop, Sort, Specify, Remove Positions, Labels, List, Interpolate ROIs, Scale, Rotate, Translate, Options |
| Show All | Draws every ROI on the image |
| Labels | Numbers the ROIs on the image (font and colour in More » › Labels…) |
How do I select multiple ROIs?
Click one ROI in the list, then Shift-click another to select the whole range between them, or Ctrl-click (Cmd-click on a Mac) to add or remove one at a time. Selected ROIs are highlighted in the list and drawn on the image. Measure, Delete, Save…, OR (Combine) and AND then act on the selection only; Deselect returns to "all".
To merge several ROIs into one region, select them and choose More » › OR (Combine). The combined selection appears on the image; press T to keep it as a new ROI. AND keeps only the overlap, XOR the parts that do not overlap, and Split breaks a combined ROI back into its pieces.
How do I measure the same ROIs on two channels?
The ROIs are outlines, not pixels, so you can lay them on any channel of the same image (or on another image of the same size) and measure what is underneath.
The simple way. In Analyze › Set Measurements… tick Area, Mean gray value and Display label. Select the image, move the channel slider to channel 1, click Deselect, then Measure. Move the slider to channel 2 and click Measure again. The Label column ends with :1 or :2, the channel.
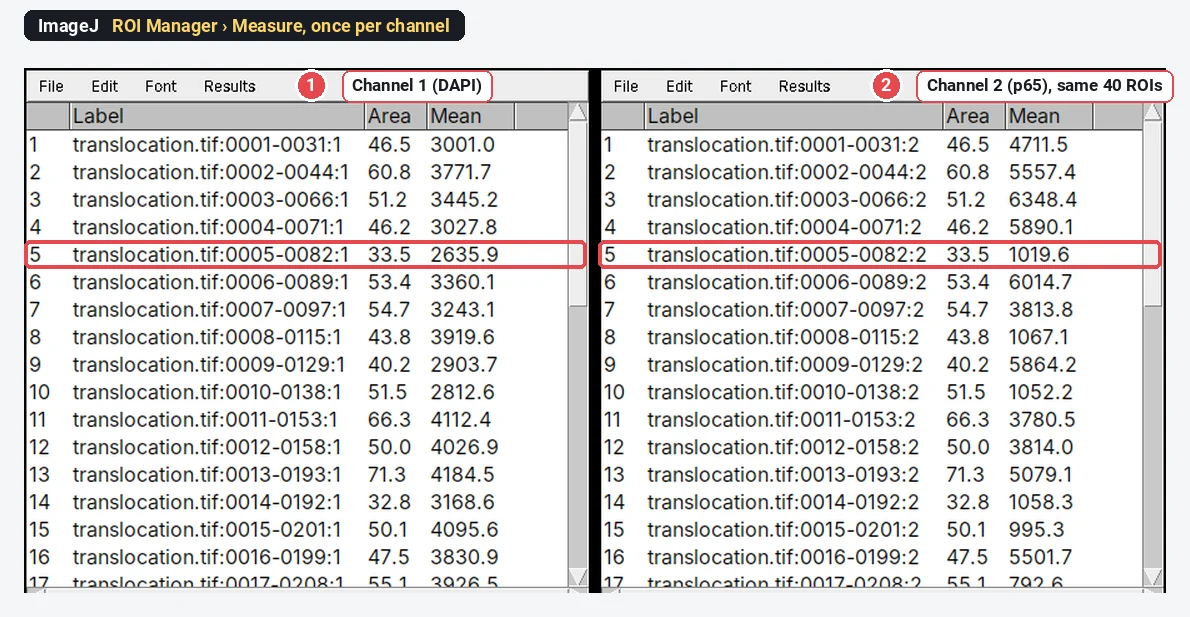
In one go: Multi Measure. More » › Multi Measure measures every ROI on every channel (or slice, or frame) of the image.
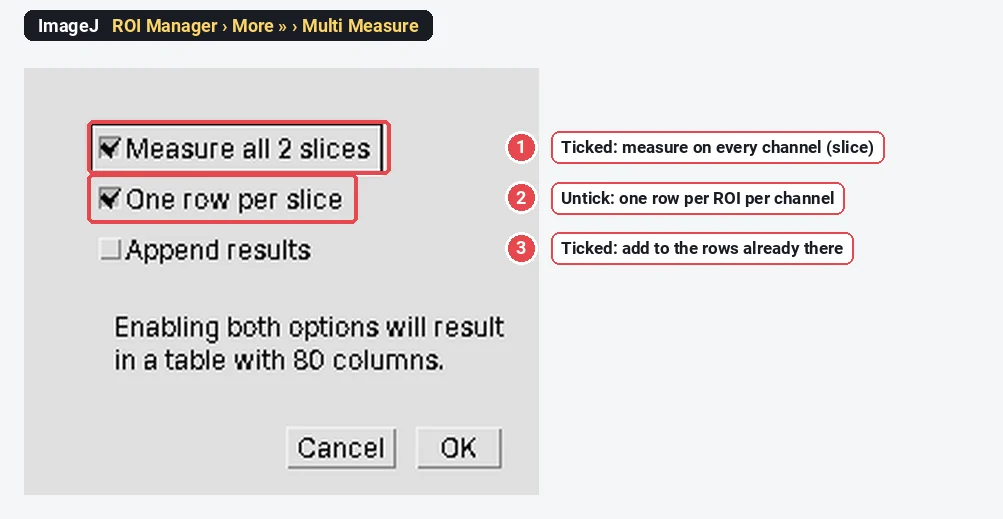
On the sample, Multi Measure with Measure all 2 slices ticked and One row per slice unticked gave 80 rows. The p65 means split cleanly into two groups: 21 nuclei between 3,503.6 and 6,348.4 (mean 4,739.6) and 19 between 792.6 and 1,531.3 (mean 1,133.2), which is the 21 and 19 the sample was built with. Nuclei averaged 51.5 µm².
A nuclear mean alone is not a translocation measurement: for that you need the cytoplasm too, usually a ring a couple of micrometres wide around each nucleus. In ImageJ, Edit › Selection › Make Band… turns one selected ROI into a ring; do it for each nucleus and add the rings to the manager. The nuclear/cytoplasmic ratio article goes through it.
How do I save ROIs in ImageJ (RoiSet.zip)?
- Click Deselect (or select the ROIs you want to keep).
- Choose More » › Save… and pick a name. Several ROIs are saved as a ZIP of .roi files, called RoiSet.zip by default; a single selected ROI is saved as one .roi file.
- Save the ZIP next to the image, with a matching name (for example well_B3.tif and well_B3_RoiSet.zip). ROIs are positions in pixels: they only fit an image of the same size, cropped the same way.
To reopen them, open the image first, then More » › Open… and choose the .zip or .roi (you can also drag the file onto the ImageJ window, or open it with File › Open). For a single selection there is also File › Save As › Selection…, which writes the selection on the image to a .roi file, and File › Open reads it back.
Saving ROIs is what makes an analysis repeatable: a reviewer, a colleague or you in six months can lay the same outlines on the same image and get the same numbers.
Pitfalls
- ROIs that carry a position. An ROI added while channel 2 or slice 7 was shown can be tied to that plane, and Measure then jumps there. If every channel gives the same numbers, or the slider moves on its own, use More » › Remove Positions…. (The ROIs above came from a single-channel copy, so they had no position.)
- The wrong image. The ROI Manager measures the active image. With several windows open, click the right one first, or the numbers come from a different picture of the same size.
- Measuring a mask. If the ROIs were made on a thresholded copy, measuring that copy gives 255 for every mean. Measure the original.
- A different size. ROIs from a 1024 × 1024 image land in the wrong place on a binned 512 × 512 one. Keep ROIs with the exact image they belong to.
- Edited but not updated. Moving a selection on the image does not change the stored ROI until you click Update.
- Lost work. The ROI Manager is not saved with the image. Save the RoiSet.zip before you close ImageJ.
Reporting it
Nuclei were segmented in [Fiji (ImageJ 1.54)] from the DAPI channel ([Otsu] threshold, Fill Holes, Watershed, Analyze Particles from [20] µm², excluding nuclei on the image edge), and the resulting ROIs were measured on the [p65] channel with the ROI Manager (Multi Measure; mean intensity in the raw 16-bit image). ROI sets are available as RoiSet.zip files.
Cite ImageJ (Schneider et al. 2012) or Fiji (Schindelin et al. 2012). Share the RoiSet.zip with the raw images: it is small and lets anyone check your outlines. Plot the per-cell values for each condition with each biological replicate shown, not only the mean.
ImageJ is the tool when ROIs come from a macro that runs over a whole folder, from a plugin such as StarDist or TrackMate, or when you need 3D ROIs through a stack.
An easier way: open your RoiSet.zip in LabCanvas
LabCanvas Image Analysis reads ImageJ ROI files in the browser, so the outlines you made in ImageJ or Fiji are not stuck on one computer, and there is nothing to install.
- Open the image.
- Drop the RoiSet.zip (or .roi files) on the window, or click Import… under ImageJ ROIs in the Measure tab. The ROIs keep their names, colours and positions.
- Pick the columns in Set measurements, choose Channels: All channels (the Multi Measure layout, one row per ROI per channel) and click Measure all ROIs.
- Export RoiSet.zip writes them back in ImageJ's format for the ROI Manager.
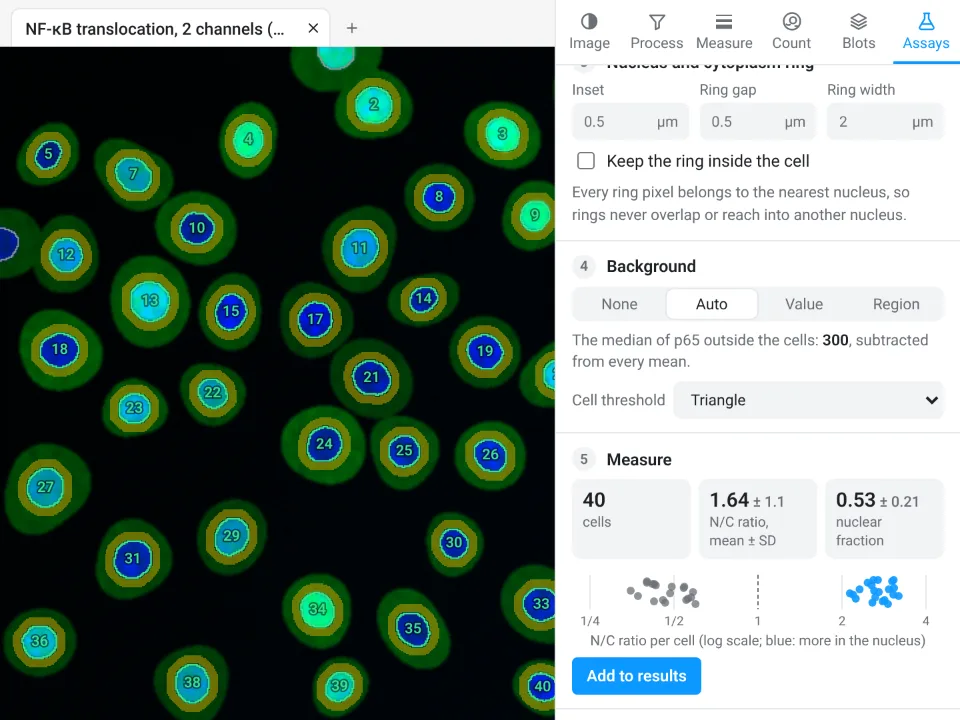
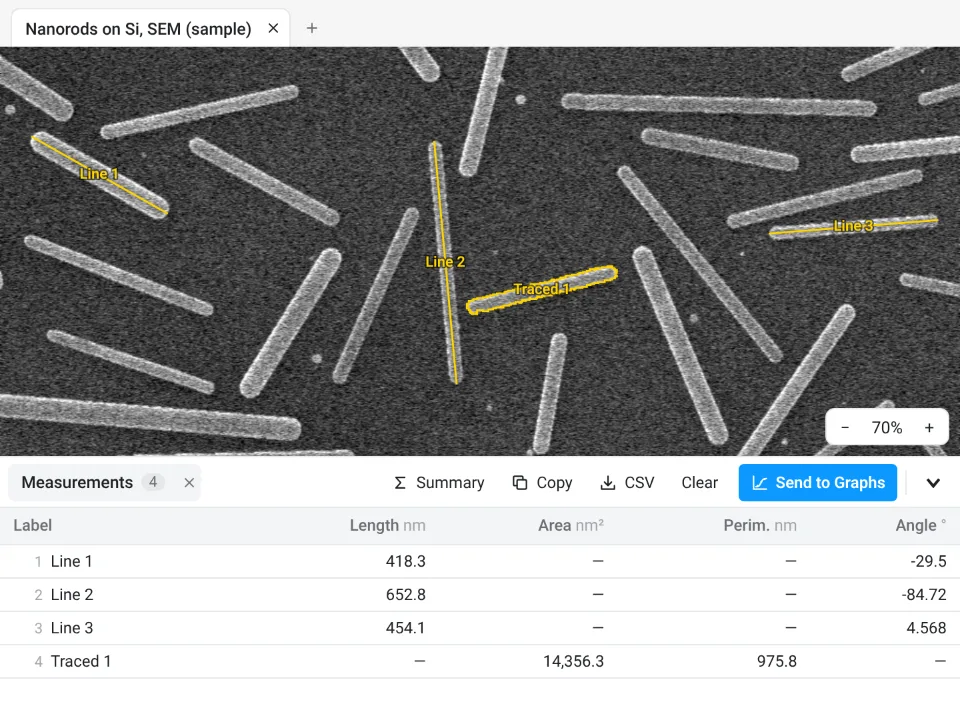
We saved the 40 nuclei above from ImageJ 1.54f as a RoiSet.zip and read it with the app's ROI reader: all 40 came back as traced outlines with their ImageJ names. On this sample the Translocation assay in the Assays tab also finds 40 cells, as ImageJ did, and adds the cytoplasm ring and N/C ratio that take a Make Band per nucleus in ImageJ.
Why it is a good choice for ROI work:
- Your ImageJ ROIs, anywhere: open a colleague's RoiSet.zip on any computer or tablet, no install.
- ImageJ's own names: the ROI list, Measure, Set measurements, and Measure › ROI tools for Combine, Intersect, Enlarge, Band (a ring around each ROI, split halfway between neighbours) and Hull.
- Guided assays instead of macros: nuclear/cytoplasmic ratio, spots per cell and others in a few clicks.
- Straight into Graphs: Send to Graphs plots the per-cell values, with a Methods sentence under each table. Importing ROIs, measuring, Copy and Send to Graphs are free with a LabCanvas account; saving files (the RoiSet.zip export, CSV, TIFF) is part of LabCanvas Pro.
LabCanvas has no macro language. Open Image Analysis. ImageJ and Fiji are independent open-source projects; LabCanvas is not affiliated with them.
References
- Schindelin J, Arganda-Carreras I, Frise E, et al. (2012). Fiji: an open-source platform for biological-image analysis. Nature Methods 9, 676–682. doi:10.1038/nmeth.2019
- Schneider CA, Rasband WS, Eliceiri KW (2012). NIH Image to ImageJ: 25 years of image analysis. Nature Methods 9, 671–675. doi:10.1038/nmeth.2089
Frequently asked questions
How do I open the ROI Manager in ImageJ?
Choose Analyze › Tools › ROI Manager…. It also opens by itself the first time you press T with a selection on the image, or when you tick Add to Manager in Analyze Particles. In Fiji the command and the window are the same.
How do I save ROIs in ImageJ?
In the ROI Manager, click More » › Save…. With no ROI selected (or several selected) ImageJ writes a RoiSet.zip with one .roi file per ROI; with exactly one selected it writes a single .roi file. File › Save As › Selection… saves the selection on the image as a .roi.
How do I select multiple ROIs in the ROI Manager?
Click the first ROI in the list, then Shift-click another to select everything between them, or Ctrl-click (Cmd-click on a Mac) to add or remove single ROIs. Deselect clears the selection, and most buttons then act on every ROI in the list.
How do I measure the same ROIs on two channels?
Make the ROIs once (for example nuclei from the DAPI channel), then either move the channel slider and click Measure for each channel, or use More » › Multi Measure with Measure all slices ticked and One row per slice unticked, which gives one row per ROI per channel with a Ch column.
Why does Measure in the ROI Manager jump to another slice or channel?
The ROIs carry a position: they were drawn or added on a particular slice or channel, and ImageJ measures each one there. More » › Remove Positions… clears it, so the ROIs are measured on whatever channel or slice is shown.
Can I open ImageJ ROI files without ImageJ?
Yes. LabCanvas Image Analysis opens .roi files and RoiSet.zip in the browser, with their names, and measures them; see the last section of this guide.
Try it in LabCanvas
Every app is free to start in your browser. Create an account and begin.
Start Image Analysis free in your browserKeep reading

ImageJ vs LabCanvas Image Analysis: an honest comparison
ImageJ/Fiji or LabCanvas Image Analysis? Six everyday jobs done in both, six newer ones (macros, vendor files, 3D, StarDist, big images) and which to use.

How to use ImageJ: a beginner's tutorial for the 10 everyday jobs (2026)
How to use ImageJ and Fiji: get started, open an image, then 10 everyday jobs (scale, measure, threshold, count, background, blots) with exact menu paths.

How to set the scale and add a scale bar in ImageJ (with a calibration image to practise on)
Set the scale in ImageJ (Analyze › Set Scale) from a micrometer, scale bar or pixel size, add a scale bar, and practise on a free calibration image.