Nuclear/cytoplasmic ratio in ImageJ: quantify NF-κB, YAP or TFEB translocation
Measure the nuclear/cytoplasmic ratio in ImageJ step by step: nuclei from DAPI, a cytoplasm ring with Enlarge and Make Band, and an N/C table per cell.
Contents
To measure the nuclear/cytoplasmic (N/C) ratio in ImageJ, make one ROI per nucleus from the DAPI channel (Image › Adjust › Threshold…, then Analyze › Analyze Particles… with Add to Manager), draw a cytoplasm ring around each nucleus with Edit › Selection › Enlarge… (a small gap) and Edit › Selection › Make Band… (the ring), and measure the mean of the signal channel in both.
This is how NF-κB (p65), YAP/TAZ, TFEB, NFAT and other shuttling proteins are scored. Below, every step is done on a two-channel sample image with a screenshot of the exact window, and the macro at Step 7 does all cells at once.
What you need: ImageJ 1.x or Fiji (every command here is in both). A two-channel image: a nuclear stain (DAPI or Hoechst) and the protein you follow. The example is a synthetic NF-κB image made for practice: 512 × 512 pixels at 0.325 µm per pixel, 40 whole cells, 21 of them with p65 in the nucleus and 19 with p65 in the cytoplasm. Time: about 15 minutes.
What the N/C ratio measures
The N/C ratio is the mean signal in the nucleus divided by the mean signal in the cytoplasm of the same cell. A resting cell with NF-κB held in the cytoplasm has a ratio well below 1; after TNF-α the p65 moves into the nucleus and the ratio rises above 1. Means are used, not totals, because the nucleus and the cytoplasm differ in size.
The cytoplasm is hard to outline in most images, so instead of tracing each cell you sample a ring: a band a few pixels wide just outside each nucleus. The ring is objective, needs no cell membrane stain and stays inside the cell. CellProfiler and most high-content software do the same.
How do I measure the N/C ratio in ImageJ? Step by step
Step 1: Open the image and split the channels
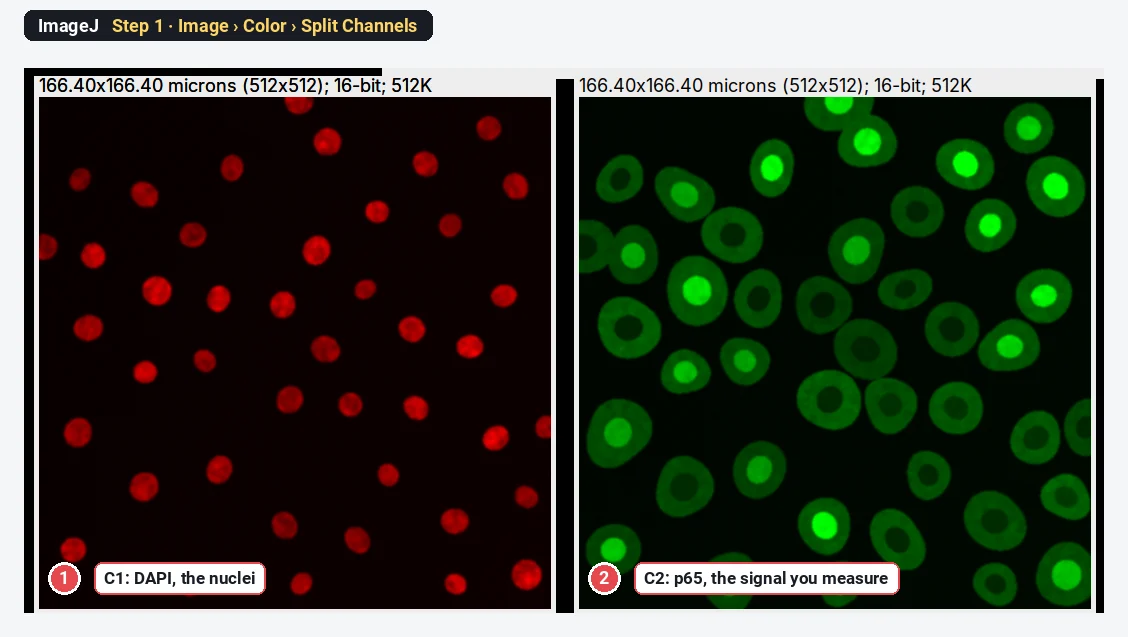
Open your file with File › Open…. Then choose Image › Color › Split Channels. You now have two windows: C1 (the nuclei) and C2 (the protein). ImageJ may colour them red and green; the colours do not change the numbers.
Step 2: Threshold the nuclei
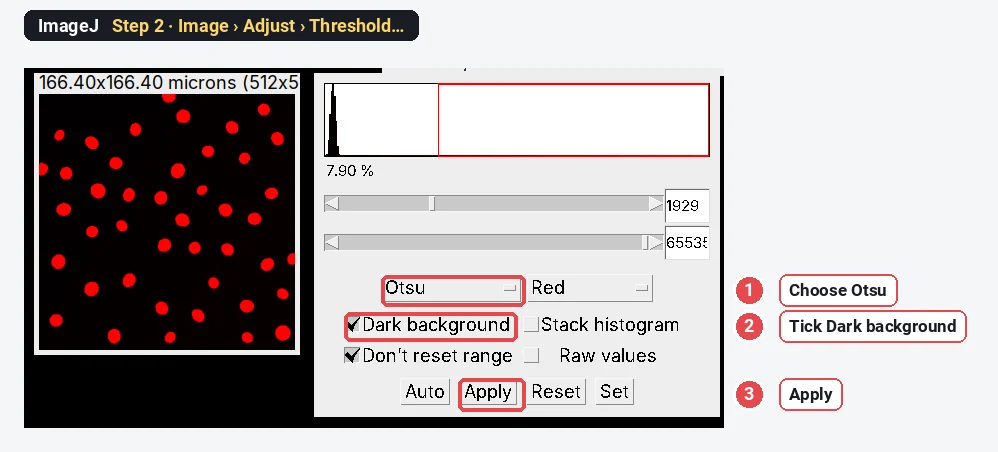
Click the C1 window. Make a copy with Image › Duplicate… and smooth it with Process › Filters › Gaussian Blur… (Sigma 1), so noise does not make ragged edges. Open Image › Adjust › Threshold…, choose Otsu, tick Dark background and check that every nucleus is red. Click Apply.
Step 3: Turn each nucleus into an ROI
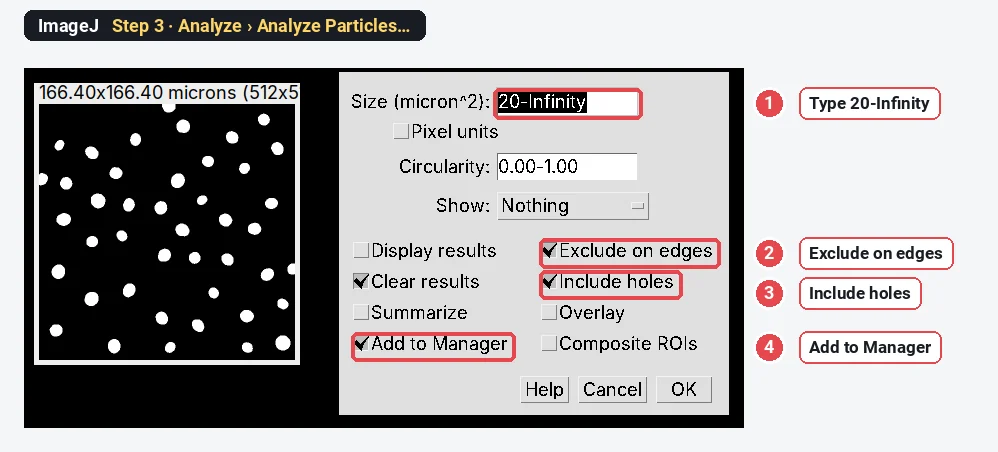
On the mask, run Process › Binary › Fill Holes and then Process › Binary › Watershed to split nuclei that touch. Then open Analyze › Analyze Particles…. Type a size of 20-Infinity (µm²) to skip specks, tick Exclude on edges (a cell cut by the frame has half a cytoplasm), Include holes and Add to Manager. Click OK. The ROI Manager now lists one ROI per nucleus: 40 here.
Step 4: Measure the background
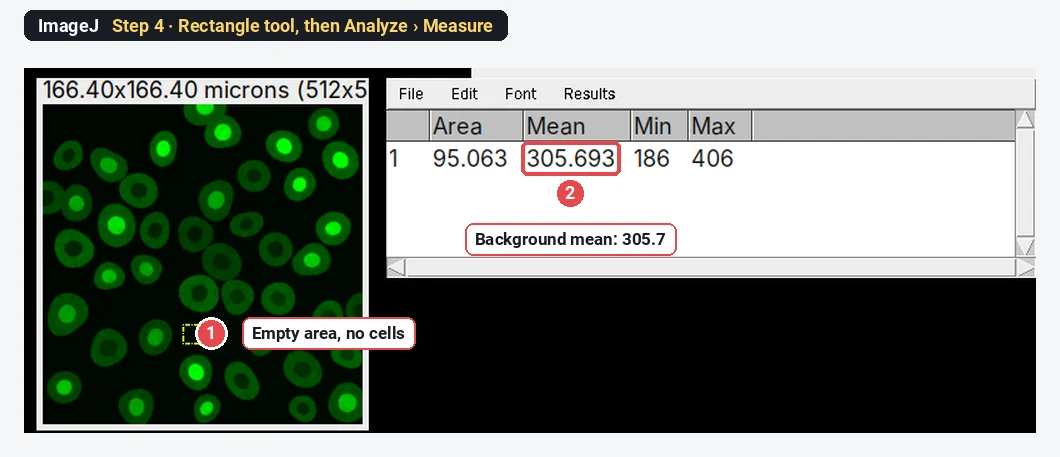
Click the C2 window (the protein). Choose the rectangle tool and draw a small box in an empty area with no cells. Press Analyze › Measure (Ctrl M). Write down the Mean: here 305.7. This is the camera offset and stray light, and you will subtract it from every measurement.
Step 5: Leave a small gap around the nucleus
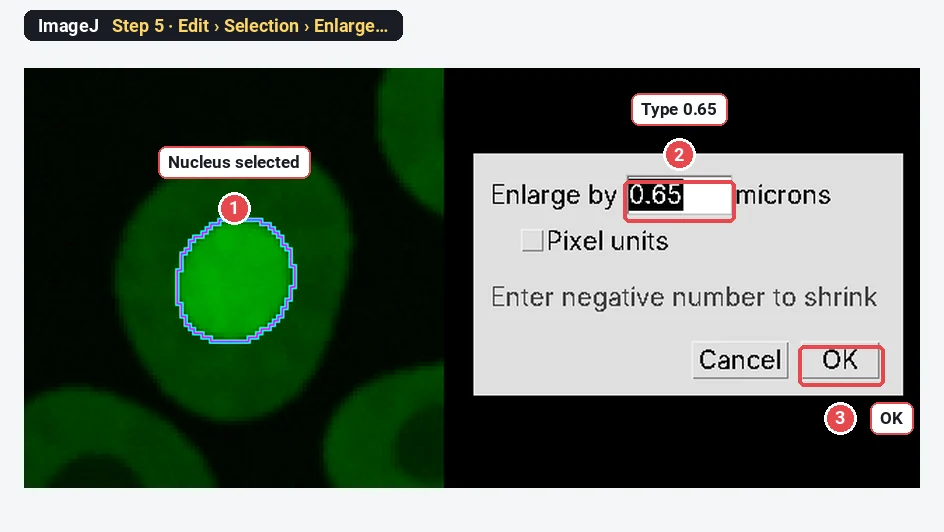
Still on C2, click the first nucleus in the ROI Manager; its outline appears on the protein image. Choose Edit › Selection › Enlarge…, type 0.65 (µm, which is 2 pixels here) and click OK. The outline grows by the gap. The gap keeps the blurred edge of the nucleus out of the ring.
Step 6: Make the cytoplasm ring
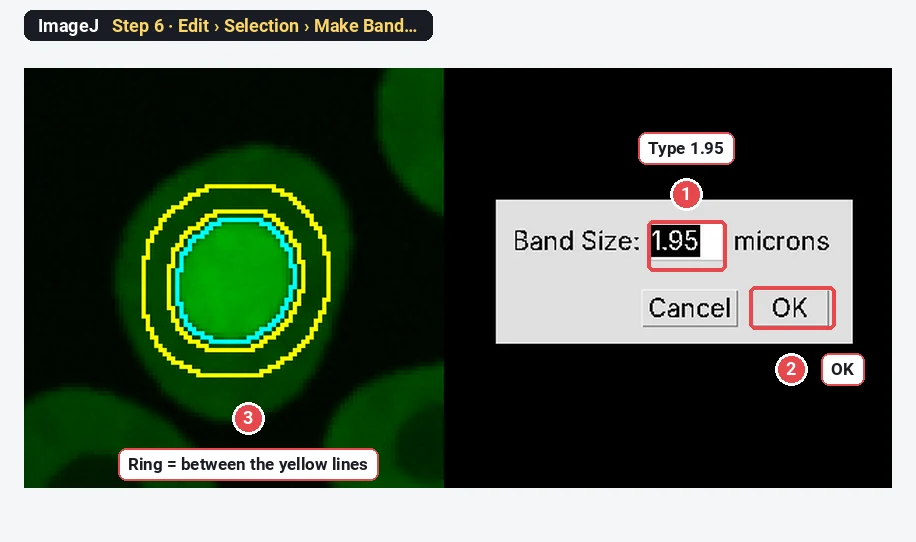
Now choose Edit › Selection › Make Band…, type 1.95 (µm, 6 pixels) and click OK. The selection becomes a ring 6 pixels wide, starting 2 pixels outside the nucleus. Press Ctrl M to measure it; then select the nucleus again in the ROI Manager and press Ctrl M for the nuclear mean.
The same ring can be made the long way: enlarge the nucleus by 0.65 µm and add it to the ROI Manager, enlarge it by 2.6 µm and add that too, select both and choose More › XOR in the ROI Manager. Make Band does it in one step.
Step 7: Do every cell with a short macro
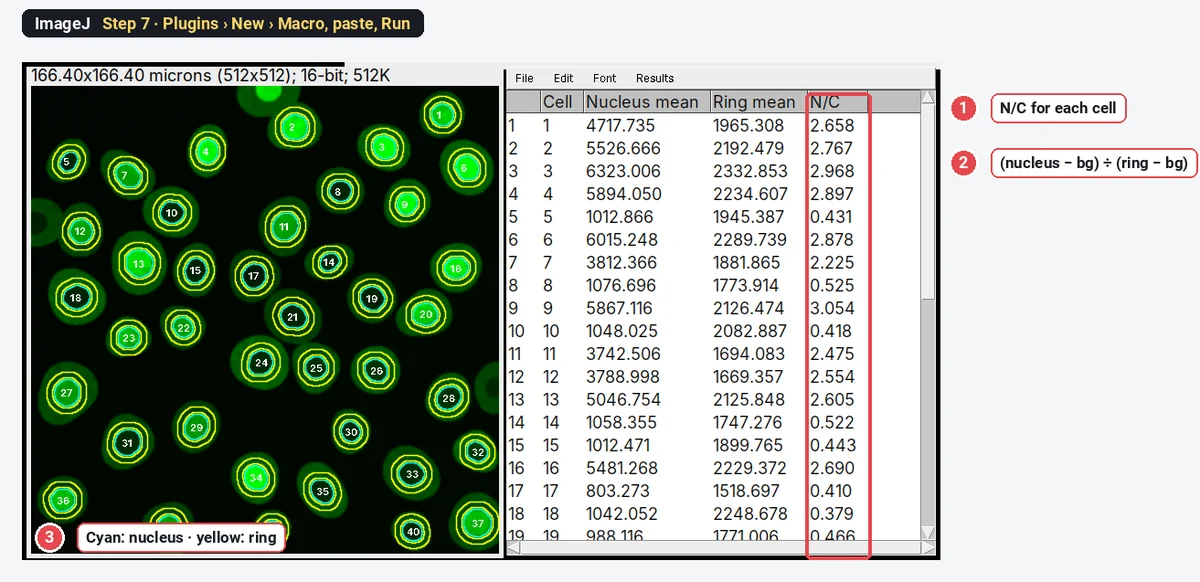
Clicking 40 cells twice each is slow and easy to get wrong, so let a macro repeat Steps 5 and 6 for every ROI. Select the C2 window, choose Plugins › New › Macro, paste the code below, change bg to your own background from Step 4, and press Run (Ctrl R). It needs only the nuclei in the ROI Manager.
// N/C ratio for every nucleus in the ROI Manager.
// Select the signal image (p65) before you run it.
bg = 305.7;    // background mean from Step 4
gap = 0.65;    // gap between nucleus and ring, in µm
ring = 1.95;   // ring width, in µm
n = roiManager("count");
run("Clear Results");
Overlay.remove;
for (i = 0; i < n; i++) {
  roiManager("select", i);
  getStatistics(nucArea, nucMean);
  Overlay.addSelection("cyan");
  run("Enlarge...", "enlarge=" + gap);
  run("Make Band...", "band=" + ring);
  getStatistics(ringArea, ringMean);
  Overlay.addSelection("yellow");
  setResult("Cell", i, i + 1);
  setResult("Nucleus mean", i, nucMean);
  setResult("Ring mean", i, ringMean);
  setResult("N/C", i, (nucMean - bg) / (ringMean - bg));
}
run("Select None");
updateResults();The result: an N/C table per cell
Each row of the Results table is one cell. To see the whole population, choose Analyze › Distribution… and pick the N/C column:
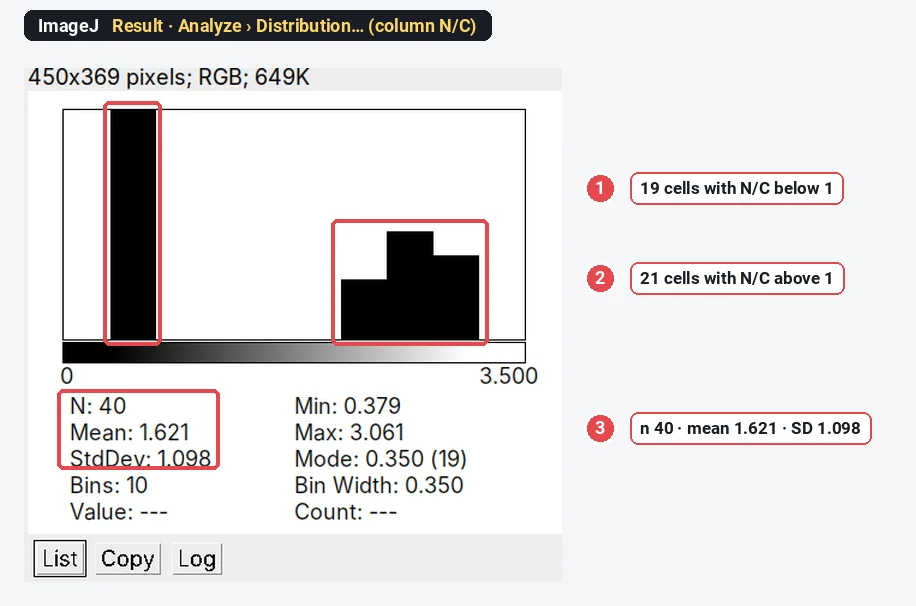
On the sample, ImageJ gives 40 cells, N/C 1.62 ± 1.10 (mean ± SD). The cells fall into two clear groups: 19 between 0.38 and 0.62, and 21 between 2.11 and 3.06. That matches how the image was made (19 cells with cytoplasmic p65, 21 with nuclear p65), and the mean is close to the true mean of 1.66. With real cells you will rarely see two groups this clean; report the mean per condition and the share of cells above a cut-off (often 1, or one set on the untreated control).
Ring or hand-drawn cytoplasm: does it matter?
Yes, by more than you might expect. We measured the same 40 cells three ways:
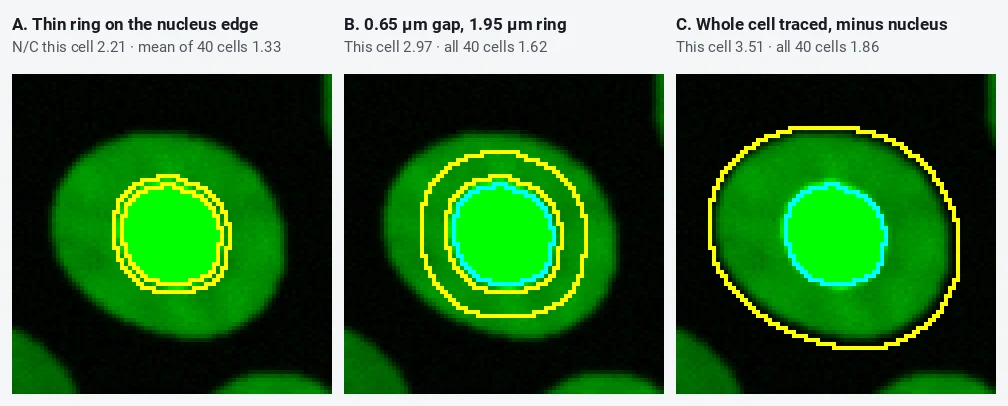
| How the cytoplasm is sampled | Mean N/C, 40 cells |
|---|---|
| Thin band (0.65 µm) right on the nuclear edge | 1.33 |
| Band 1.95 µm wide, no gap | 1.52 |
| Gap 0.65 µm, then a band 1.95 µm wide | 1.62 |
| Whole cell traced, nucleus removed | 1.86 |
| True value in the synthetic image | 1.66 |
A ring that touches the nucleus picks up nuclear signal blurred across the edge, so translocated cells look less translocated. A traced whole cell includes the thin, dim rim of the cell, so the cytoplasm looks darker than it is; tracing is also slow, differs from person to person, and neighbouring cells that touch are hard to separate (ten of our 40 traced outlines merged with a neighbour). A ring with a small gap is the honest default. Keep it narrow enough to stay inside the thinnest cells, and use the same settings for every image.
Pitfalls
- No background subtraction. The offset adds the same amount to nucleus and ring and drags every ratio towards 1. Measure an empty area in every image, or at least in every session.
- Saturated nuclei. If the brightest nuclei are clipped at the top of the range, their N/C is too low. Check the histogram and the Max column before you trust high ratios.
- Rings that leave the cell. In small or flat cells a wide ring runs off the cell into the background, which lowers the ring mean and inflates N/C. Keep the ring narrow, or check the rings on the image.
- Rings that overlap a neighbour. In dense cultures one cell's ring can sit on the next cell. Thin the culture, narrow the ring, or leave out crowded cells.
- Cells cut by the frame. Tick Exclude on edges; half a cell has half a ring.
- Measuring the wrong channel. The ROIs come from DAPI, but the means must come from the protein channel. Click the C2 window before you measure or run the macro.
- Mitotic cells. Without a nuclear envelope there is no nuclear compartment; leave out cells with condensed chromosomes.
Reporting it
Nuclei were segmented in [Fiji (ImageJ 1.54)] from the DAPI channel (Gaussian blur σ = 1 pixel, Otsu threshold, watershed; objects ≥ 20 µm², cells touching the image border excluded). The cytoplasm was sampled as a ring [1.95] µm wide starting [0.65] µm outside each nucleus (Edit › Selection › Enlarge and Make Band). After subtraction of the background mean measured in a cell-free region, the N/C ratio was the mean [p65] intensity of the nucleus divided by that of the ring. [n] cells from [3] independent experiments were analysed.
Plot N/C on a log axis (a ratio of 2 and a ratio of 0.5 are the same size of change), one point per cell with the mean per experiment overlaid, and do the statistics on the experiment means, not on the cells.
Switch to LabCanvas: the N/C ratio in a few clicks
The same measurement runs in LabCanvas Image Analysis in the browser: no install, no macro, the ring drawn for you.
- Open your two-channel TIFF and go to the Assays tab › Nuclear vs cytoplasmic signal (or click Try it on a sample).
- Under Channels, pick the nuclear and the signal channel; under Nuclei, keep Otsu or set your own threshold and smallest size.
- Under Nucleus and cytoplasm ring, set the Gap between nucleus and ring and the Ring width; choose the Background (automatic, a value or a region).
- Read the per-cell table (N/C ratio and nuclear fraction) and the summary, and click Add to results.
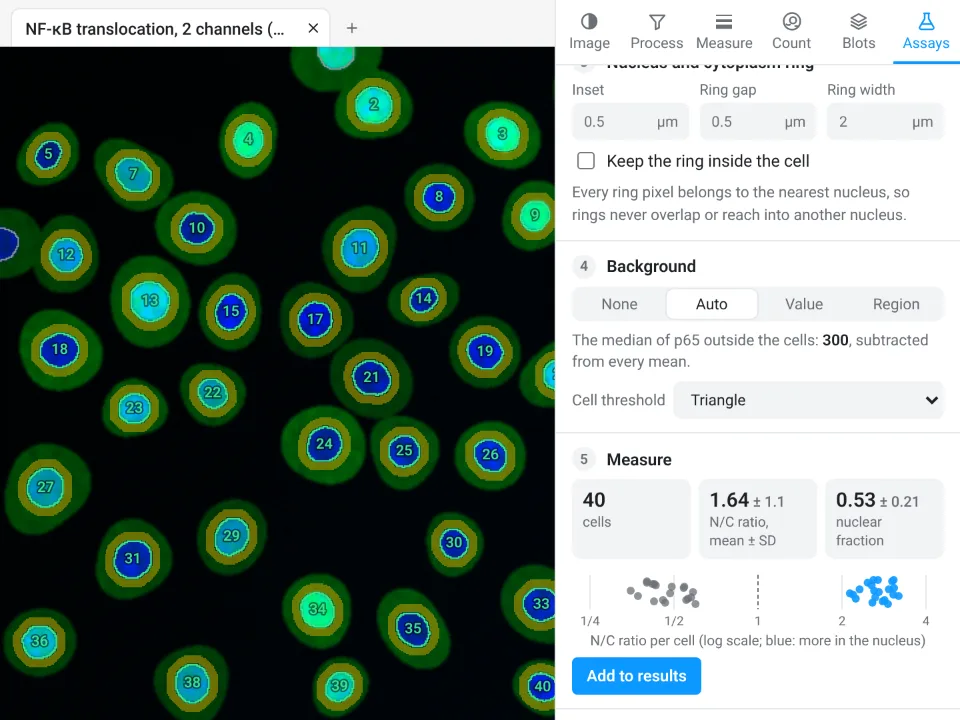
On the same synthetic image, LabCanvas finds 40 cells, N/C 1.64 ± 1.1; ImageJ with the steps above gives 40 cells, 1.62 ± 1.10. The small difference comes from the background (automatic in the app, one rectangle in ImageJ).
Why switch for translocation:
- No macro: rings, gap and background are settings, and every cell is measured at once.
- Rings that stay in their cell: they never overlap a neighbour and can be kept inside the cell.
- Straight to Graphs: the per-cell ratios go to a graph with statistics, with a methods sentence to copy.
Fiji stays better for 3D stacks, thousands of plates through one macro, and microscope files such as .czi or .nd2, which LabCanvas needs as TIFF first.
Open Image Analysis: free with a LabCanvas account (downloading CSV and image files is part of LabCanvas Pro). ImageJ and Fiji are independent open-source projects; LabCanvas is not affiliated with them.
References
- Schindelin J, Arganda-Carreras I, Frise E, et al. (2012). Fiji: an open-source platform for biological-image analysis. Nature Methods 9, 676–682. doi:10.1038/nmeth.2019
- Schneider CA, Rasband WS, Eliceiri KW (2012). NIH Image to ImageJ: 25 years of image analysis. Nature Methods 9, 671–675. doi:10.1038/nmeth.2089
Frequently asked questions
How do I calculate the nuclear/cytoplasmic ratio in ImageJ?
Make one ROI per nucleus from the DAPI channel (threshold, then Analyze Particles with Add to Manager). For each nucleus, make a cytoplasm ring with Edit › Selection › Enlarge (a small gap) and Edit › Selection › Make Band (the ring width). Measure the mean of the signal channel in the nucleus and in the ring, subtract the background from both, and divide:
Should I use a ring or the whole cytoplasm?
A ring of fixed width around each nucleus is the usual choice: it needs no cell outline, it stays inside the cell, and it is the same for every cell. Tracing the whole cell by hand is slow, varies between people and picks up the dim, blurred cell edge. On our sample the traced whole cell gave a mean N/C of 1.86 against 1.62 for the ring.
Why leave a gap between the nucleus and the ring?
The edge of the nucleus is blurred by the optics, so the first pixels outside the nuclear outline still carry nuclear signal. A ring that touches the nucleus therefore reads too bright when the protein is nuclear, which pulls the ratio towards 1. A gap of about 2 pixels (0.65 µm here) avoids it; a thin ring right on the edge gave a mean N/C of 1.33 instead of 1.62.
Do I need to subtract the background for an N/C ratio?
Yes. Camera offset and stray light add the same amount to the nucleus and to the cytoplasm, and that constant pulls every ratio towards 1. Measure the mean in an empty area with no cells and subtract it from both the nuclear and the ring mean before you divide.
Is there a plugin for nuclear translocation in Fiji?
There is no single built-in command. Many labs use the steps in this guide as a macro, CellProfiler (nuclei with IdentifyPrimaryObjects, then a ring made by expanding them), or a dedicated tool. The ImageJ route needs only commands that are in both ImageJ 1.x and Fiji.
Is the N/C ratio or the nuclear fraction better?
They carry the same information. The N/C ratio (nuclear mean ÷ cytoplasmic mean) is unbounded and best plotted on a log scale. The nuclear fraction, nucleus ÷ (nucleus + cytoplasm), runs from 0 to 1. Say which one you report, and whether you used means or totals.
Try it in LabCanvas
Every app is free to start in your browser. Create an account and begin.
Start Image Analysis free in your browserKeep reading

ImageJ vs LabCanvas Image Analysis: an honest comparison
ImageJ/Fiji or LabCanvas Image Analysis? Six everyday jobs done in both, six newer ones (macros, vendor files, 3D, StarDist, big images) and which to use.

How to use ImageJ: a beginner's tutorial for the 10 everyday jobs (2026)
How to use ImageJ and Fiji: get started, open an image, then 10 everyday jobs (scale, measure, threshold, count, background, blots) with exact menu paths.

How to set the scale and add a scale bar in ImageJ (with a calibration image to practise on)
Set the scale in ImageJ (Analyze › Set Scale) from a micrometer, scale bar or pixel size, add a scale bar, and practise on a free calibration image.