How to measure fluorescence intensity in ImageJ (Mean, IntDen, RawIntDen and CTCF)
Measure fluorescence in ImageJ: Mean, IntDen and RawIntDen explained, CTCF = IntDen − Area × background worked through, and the 8-bit and saturation traps.
Contents
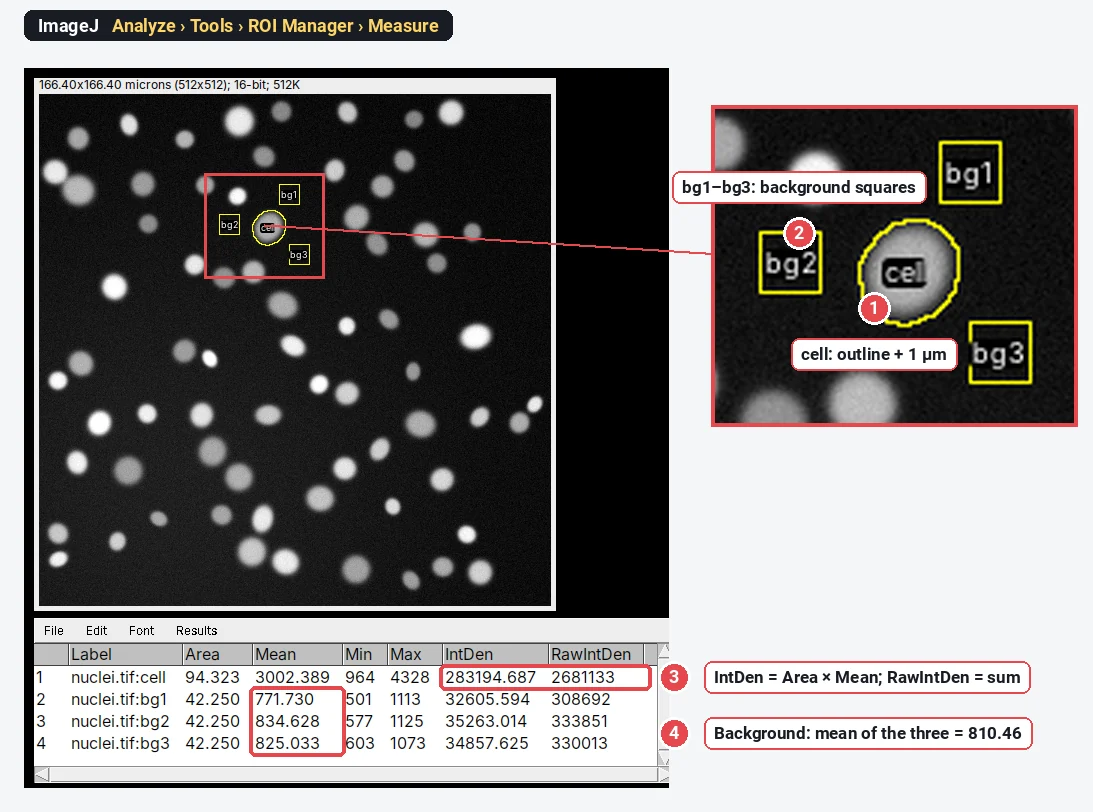
To measure fluorescence intensity in ImageJ, tick Area, Mean gray value and Integrated density in Analyze › Set Measurements…, outline the cell and press M (Analyze › Measure). The Results table gives the mean (average brightness), IntDen (Area × Mean) and RawIntDen (the sum of the pixel values). For corrected total cell fluorescence, measure three background regions too:
Everything below works the same in plain ImageJ 1.x and in Fiji. The worked example uses a synthetic 16-bit image of nuclei, so you can check every number.
Mean, IntDen and RawIntDen: what each number means
| Column | What it is | Use it when |
|---|---|---|
| Mean (mean gray value) | Sum of the pixel values ÷ number of pixels | You compare how bright cells are, regardless of their size |
| IntDen (integrated density) | Area × Mean, with the area in calibrated units (µm²) | You want the total signal in a cell, in calibrated units |
| RawIntDen | Sum of the pixel values (Area in pixels × Mean) | You want the total signal in plain pixel units |
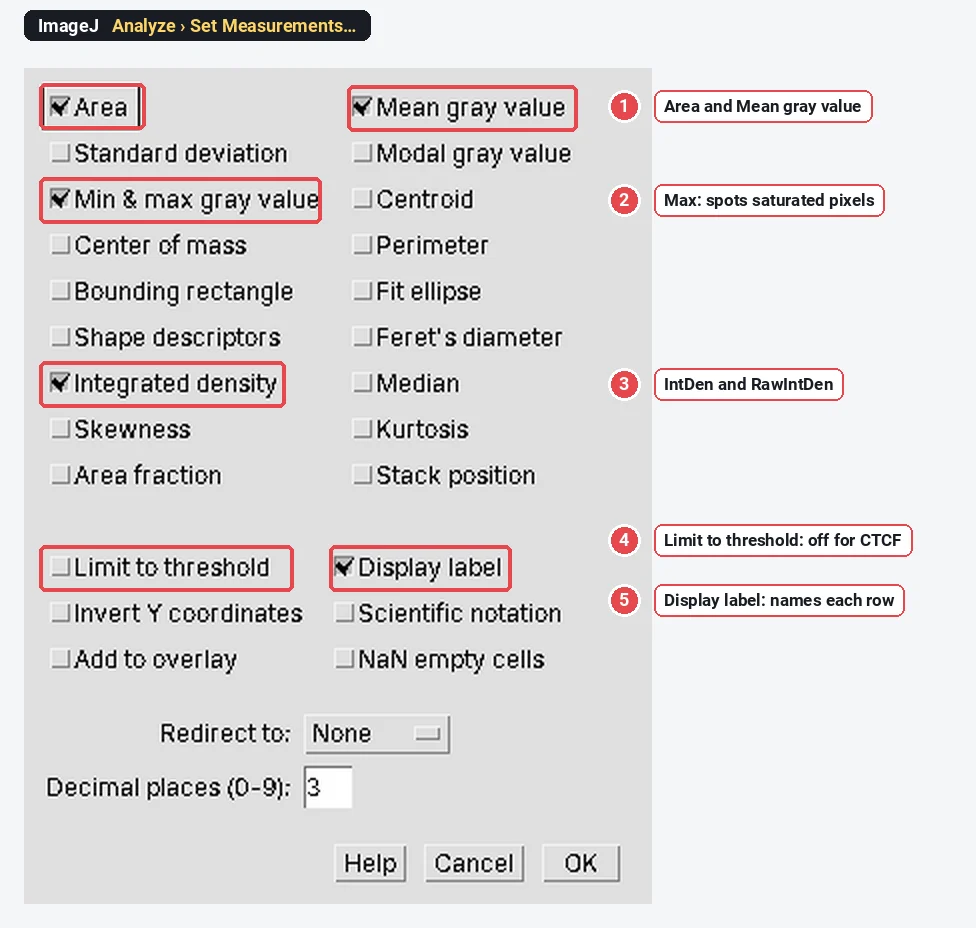
| Min, Max | Lowest and highest pixel value in the selection | You check for saturation: Max at 255, 4095 or 65535 is a warning |
| CTCF (not an ImageJ column) | You compare total fluorescence per cell between conditions |
Integrated density is the sum of the pixel values in the selection, written
Which one answers your question? A cell that is twice as large with the same concentration of a protein has the same mean but twice the integrated density. If your treatment changes the amount of protein per cell, use CTCF. If it changes how concentrated the protein is (or the cells differ wildly in size and you care about density), use the background-subtracted mean.
How to measure fluorescence intensity in ImageJ, step by step
- Open the original file. A 12- or 16-bit TIFF straight from the microscope, not a JPEG or a figure export. Check the title bar: it should say 16-bit (or 8-bit if your camera is 8-bit), not RGB.
- Check the scale. Image › Properties… shows the pixel size; if it says pixels, set it with Analyze › Set Scale… or leave it uncalibrated (then
- Choose the columns. Analyze › Set Measurements…: tick Area, Mean gray value, Min & max gray value and Integrated density. Tick Display label so each row says which image and region it came from. Leave Limit to threshold off.
- Outline the cell. Use the freehand or oval tool, or threshold the image and click the cell with the wand. Include the whole cell with a margin of a pixel or two: signal blurred past the edge still belongs to the cell.
- Measure. Press M. For many cells, add each outline to the ROI Manager (T) and click Measure there.
- Measure the background. Draw a small region in an empty area next to the cell, press M; repeat for two more regions around it. Average their Mean values.
- Calculate CTCF in a spreadsheet:
Worked example: one cell and three background regions
The sample is a synthetic 16-bit image of nuclei (0.325 µm per pixel). The cell is the thresholded outline enlarged by 1 µm (Edit › Selection › Enlarge…); the three background squares are 20 × 20 pixels in empty areas next to it. All four regions sit in the ROI Manager and were measured with its Measure button.
CTCF worked through with these numbers
| Value | Where it comes from | |
|---|---|---|
| Area of the cell | 94.323 µm² (893 pixels) | Results, row 1 |
| Mean of the cell | 3,002.389 | Results, row 1 |
| IntDen of the cell | 283,194.687 | Results, row 1 ( |
| Mean background | 810.464 | |
| Area × mean background | 76,445.4 | |
| CTCF | 206,749.3 |
The background makes up about 27% of the raw integrated density of this cell. Skip the subtraction and a dim cell on a bright background can look as bright as a real positive.
The same calculation in pixel units uses RawIntDen and the area in pixels:
The formula is often cited from a Cdk1 study's methods (McCloy et al. 2014) and is the same idea as background subtraction in densitometry: the background is assumed to sit under the whole cell at its average level.
RawIntDen vs IntDen when the image is calibrated
When the scale is set, IntDen is in µm² × grey value and RawIntDen in pixels × grey value, and
- Do not compare IntDen between images with different pixel sizes unless that is the point: the same cell imaged at two magnifications has the same IntDen only if the optics deliver the same signal per µm², which they usually do not. Compare within one acquisition setup.
- Do not mix calibrated and uncalibrated files. A TIFF that lost its scale gives IntDen in pixels, about 9.5 times larger here (
When should I tick Limit to threshold?
Limit to threshold measures only the pixels inside the selection that are within the current threshold (shown in red by Image › Adjust › Threshold…). Area becomes the thresholded area, and Mean and IntDen cover those pixels only.
Use it for "how much of this region is stained, and how bright is the stained part", for example a stained area in a tissue region. Leave it off for CTCF: the cell and the background regions must be measured whole, or the subtraction no longer means anything. If your numbers suddenly shrink, check this box first.
Traps: 8-bit conversion, Brightness/Contrast, RGB and saturation
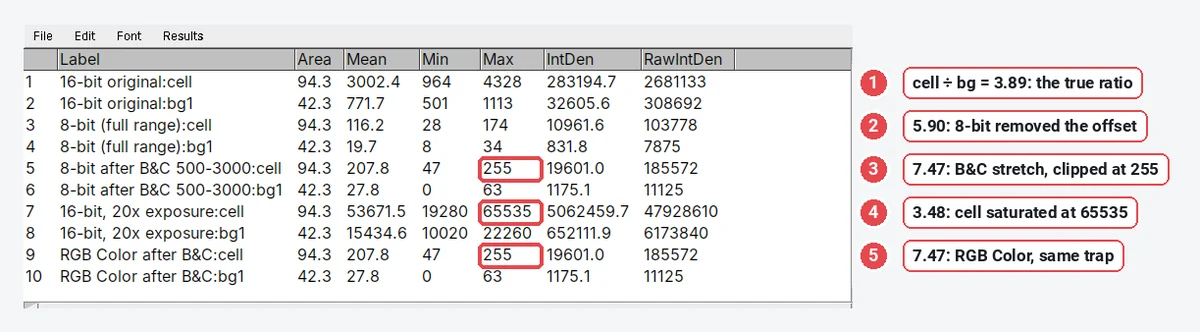
The most common reason two labs get different intensities from the same experiment is not the formula but the pixel values going into it. Here is the same cell and the same background square, measured five ways:
| How the image was prepared | Cell mean | Background mean | Ratio |
|---|---|---|---|
| Original 16-bit | 3,002.4 | 771.7 | 3.89 |
| Image › Type › 8-bit (display range 316–6232) | 116.2 | 19.7 | 5.90 |
| Brightness/Contrast set to 500–3000, then 8-bit | 207.8 | 27.8 | 7.47 |
| Same, then Image › Type › RGB Color | 207.8 | 27.8 | 7.47 |
| 20× the exposure (cell saturated at 65535) | 53,671.5 | 15,434.6 | 3.48 |
What went wrong in each:
- 8-bit conversion rescales. ImageJ maps the display minimum to 0 and the maximum to 255. Here that removed the camera offset (316), so the ratio jumped from 3.89 to 5.90. Change the display and you change the numbers.
- Brightness/Contrast before converting clips. With the display set to 500–3000, every pixel brighter than 3000 became 255 (the cell's Max) and the ratio rose to 7.47. Adjusting B&C on a 16-bit image is harmless until you convert or apply it.
- RGB is a picture, not data. An RGB image holds what the screen showed, so it inherits the same rescaling and clipping. Never measure intensity on RGB, JPEG or a figure copied out of PowerPoint.
- Saturation flattens the top. When the cell's brightest pixels hit the ceiling (65535 here, 4095 for a 12-bit camera, 255 for 8-bit), extra signal is not recorded and the ratio drops (3.48 instead of 3.89). Watch the Max column: if it equals the top value, re-image with a shorter exposure. Analyze › Histogram and the HiLo lookup table (Image › Lookup Tables › HiLo) show clipped pixels at a glance.
Two more: keep exposure, gain and laser power identical for every image you compare, and do not use auto-exposure.
Pitfalls to check before you trust a number
- Background regions in the wrong place. Put them next to the cell, in true background, not on a neighbouring cell's halo or on debris. Three regions averaged are steadier than one.
- Uneven illumination. If the background differs a lot across the field, a local background per cell (three squares next to each) is better than one value for the image; for a strong gradient, see rolling-ball background subtraction and measure on the original afterwards with care.
- Outlines that cut the cell. A tight outline loses the blurred edge, and how much it loses depends on the cell's size. Use a margin, the same way for every cell.
- One image per condition. Measure enough cells from several fields and biological replicates; report the replicate means, not every cell as an independent n.
- Comparing across sessions. Lamp ageing and laser power drift change the absolute numbers between days. Image all conditions in the same session, or include a reference sample (beads, a control slide) each time.
Reporting it
A methods sentence to copy, with the parts in brackets filled in:
Fluorescence was measured in [Fiji (ImageJ 1.54f)] on the original [16-bit] images, acquired with identical exposure settings and no saturated pixels. Each cell was outlined by hand and its area, mean grey value and integrated density measured; corrected total cell fluorescence was calculated as CTCF = integrated density − (cell area × mean of three background regions adjacent to the cell). [n] cells from [3] independent experiments were analysed per condition.
Cite the software (see how to cite ImageJ and Fiji). Show CTCF per condition as a dot plot with every biological replicate as a point and the mean ± SD, and put a representative image with the same display settings for every condition next to it, with a scale bar.
An easier way: measure fluorescence in LabCanvas
LabCanvas Image Analysis measures the same columns in the browser, on the raw 8-, 16- or 32-bit values, with ImageJ's definitions, and nothing to install.
- Open your TIFF and go to the Measure tab.
- Draw the cell and the background regions with the rectangle, oval, polygon or freehand tools; each goes to the ROI list (rename them "cell", "bg1" and so on with F2).
- In Set measurements, Area, Mean, Min and max and Integrated density are on by default; integrated density gives both IntDen (Area × Mean) and RawIntDen (the sum of the values).
- Click Measure all ROIs, then Copy the table into a spreadsheet or Send to Graphs for the CTCF subtraction. There is no CTCF column, as in ImageJ.
Why it is a good choice for fluorescence intensity:
- ImageJ's names and definitions: Area, Mean, IntDen and RawIntDen mean exactly what they mean in the Results table above.
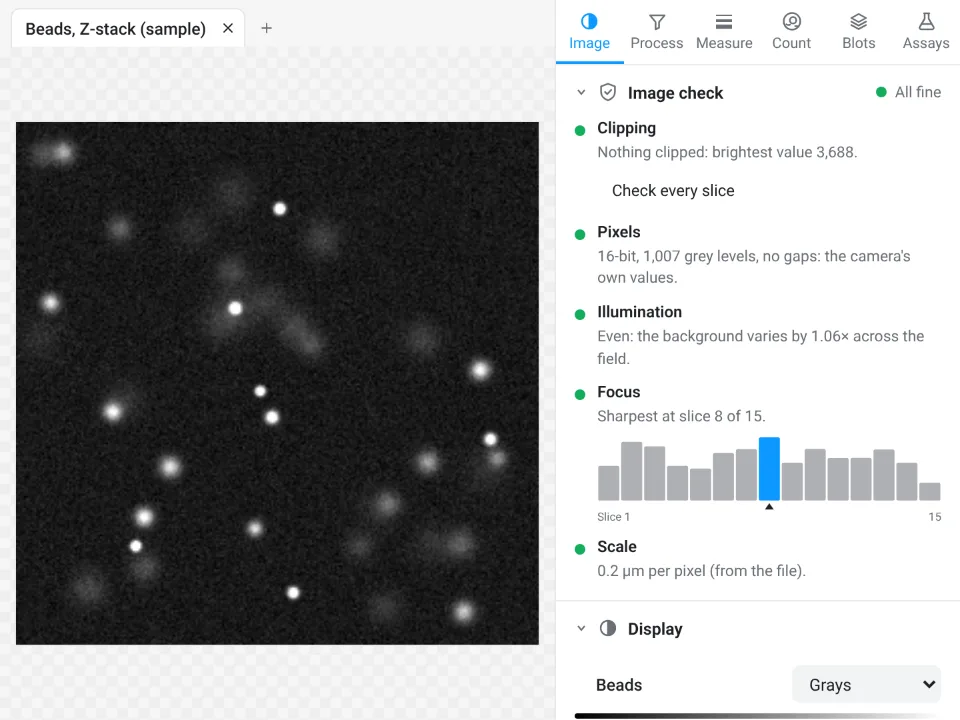
- An image check before you measure that warns about clipped pixels, JPEG files and gaps in the values left by an earlier rescaling: the traps above, caught before they reach your results.
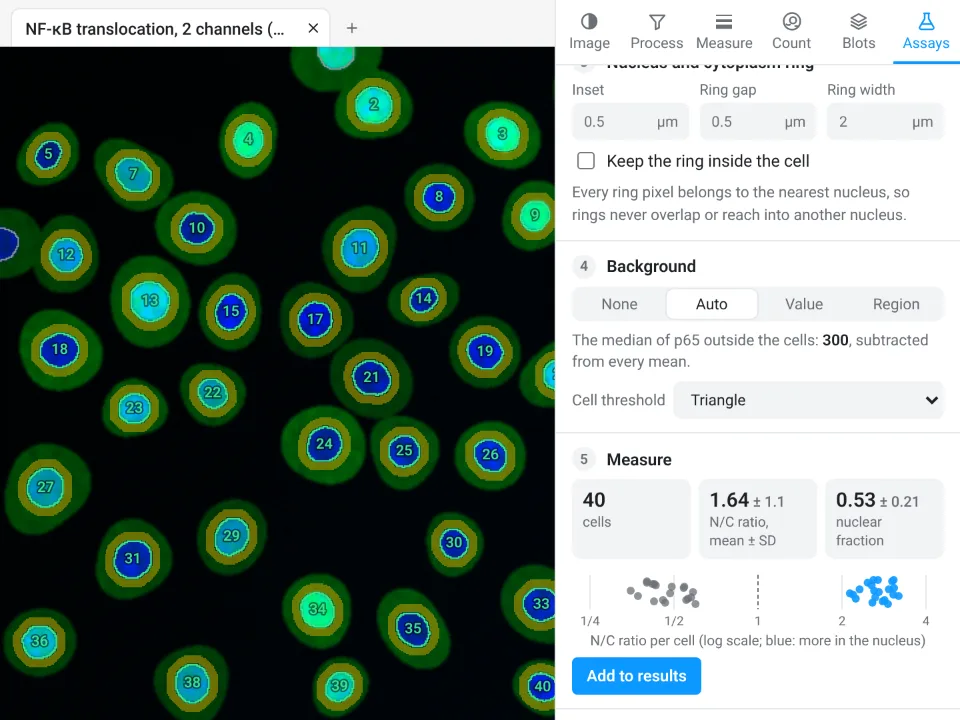
- A guided Translocation assay (in Assays) for nuclear and cytoplasmic signal: it finds every nucleus, draws a cytoplasm ring, subtracts the background and gives the N/C ratio per cell, with no macro.
- A methods sentence with every table naming the bit depth, the definitions and the pixel size. Free with a LabCanvas account (downloading CSV files is part of LabCanvas Pro); every measurement is checked in more than 4,000 automated tests.
Fiji is still the better tool for a macro over thousands of images, 3D measurements in a stack, or a vendor format such as .czi or .nd2, which LabCanvas needs exported as TIFF first. Open Image Analysis, or read the complete guide.
ImageJ and Fiji are independent open-source projects; LabCanvas is not affiliated with them.
References
- McCloy RA, Rogers S, Caldon CE, Lorca T, Castro A, Burgess A (2014). Partial inhibition of Cdk1 in G2 phase overrides the SAC and decouples mitotic events. Cell Cycle 13, 1400–1412. doi:10.4161/cc.28401
- Schneider CA, Rasband WS, Eliceiri KW (2012). NIH Image to ImageJ: 25 years of image analysis. Nature Methods 9, 671–675. doi:10.1038/nmeth.2089
Frequently asked questions
What is integrated density in ImageJ?
Integrated density is the total signal in a selection. ImageJ gives two columns:
Should I use Mean or IntDen for fluorescence intensity?
Use the mean gray value when you compare how bright cells are, independent of their size (concentration-like). Use integrated density, background-corrected as CTCF, when you want the total amount of signal in a cell, which grows with both brightness and size.
How do I calculate CTCF in ImageJ?
Tick Area, Mean gray value and Integrated density in Analyze › Set Measurements. Outline the cell, press M, then draw three small regions in the background next to the cell and press M on each. CTCF = IntDen of the cell − (Area of the cell × mean of the three background means). ImageJ has no CTCF button: do the subtraction in a spreadsheet.
What is the difference between IntDen and RawIntDen?
RawIntDen is the plain sum of the pixel values. IntDen is Area × Mean, so it carries the calibration: with a scale of 0.325 µm per pixel,
Why are my fluorescence values different after converting to 8-bit?
Image › Type › 8-bit rescales the values using the current display range: the minimum becomes 0 and the maximum 255. That removes the camera offset, changes ratios between cells and background, and clips anything above the display maximum to 255. Measure the original 16-bit file.
Does Limit to threshold change integrated density?
Yes. With Limit to threshold ticked in Set Measurements, ImageJ measures only the thresholded (red) pixels inside the selection, so Area, Mean and IntDen cover those pixels only. That is useful for the stained area within a region, but leave it off for CTCF, where the cell and background regions must be measured whole.
Try it in LabCanvas
Every app is free to start in your browser. Create an account and begin.
Start Image Analysis free in your browserKeep reading

ImageJ vs LabCanvas Image Analysis: an honest comparison
ImageJ/Fiji or LabCanvas Image Analysis? Six everyday jobs done in both, six newer ones (macros, vendor files, 3D, StarDist, big images) and which to use.

How to use ImageJ: a beginner's tutorial for the 10 everyday jobs (2026)
How to use ImageJ and Fiji: get started, open an image, then 10 everyday jobs (scale, measure, threshold, count, background, blots) with exact menu paths.

How to set the scale and add a scale bar in ImageJ (with a calibration image to practise on)
Set the scale in ImageJ (Analyze › Set Scale) from a micrometer, scale bar or pixel size, add a scale bar, and practise on a free calibration image.