How to measure length and area in ImageJ (with the right units)
Measure length and area in ImageJ: set the scale, draw lines or area selections (polygon, wand, threshold), press Measure, and get µm and µm², not pixels.
Contents
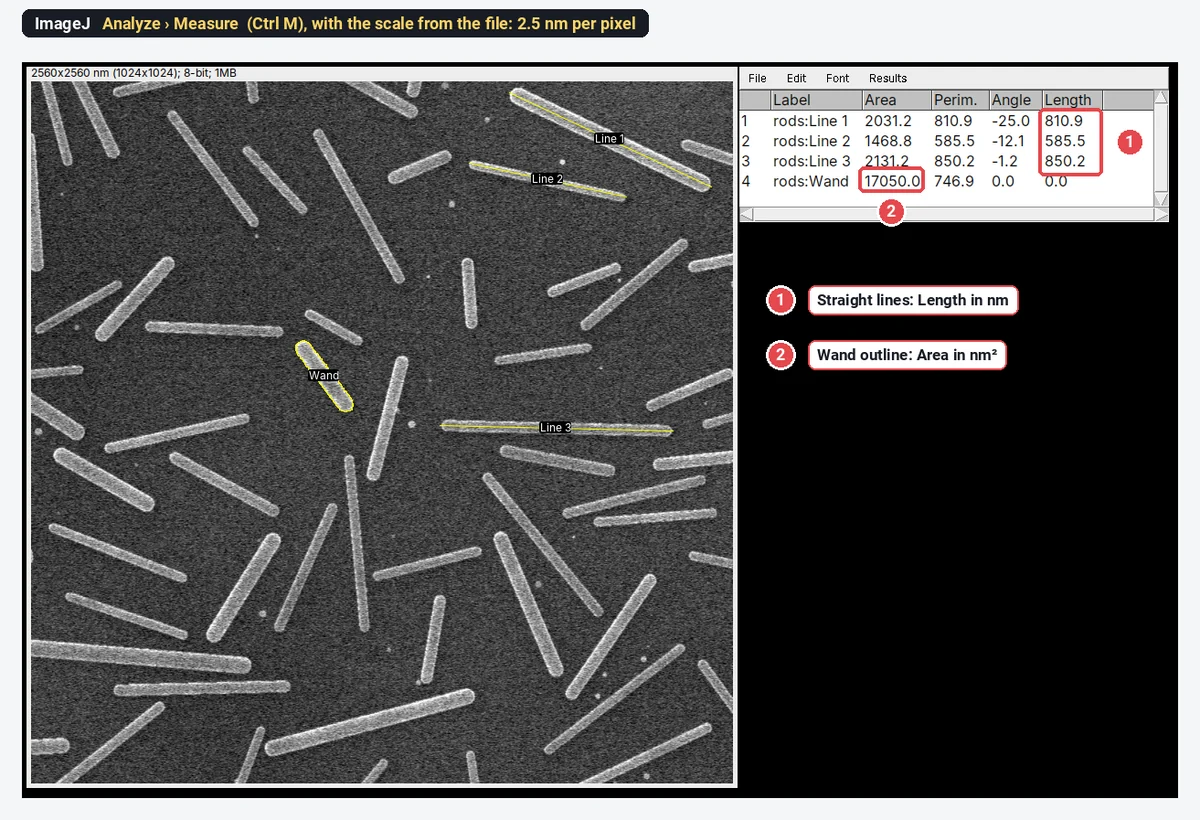
To measure length in ImageJ, set the scale (Analyze › Set Scale…), draw a line along the object with the Straight, Segmented or Freehand Line tool and press Ctrl M (Analyze › Measure): the Results table gives the Length. To measure area, outline the object with the Rectangle, Oval, Polygon or Freehand tool, or click it with the Wand, and Measure gives the Area. Without a scale both come out in pixels; with one, lengths scale with the pixel size and areas with its square:
This guide goes through every step in ImageJ and Fiji and explains the units, with a worked example on an SEM image of nanorods.
In ImageJ (or Fiji): length and area step by step
These commands are part of ImageJ 1.x, so they are the same in plain ImageJ and in Fiji.
1. Set the scale first
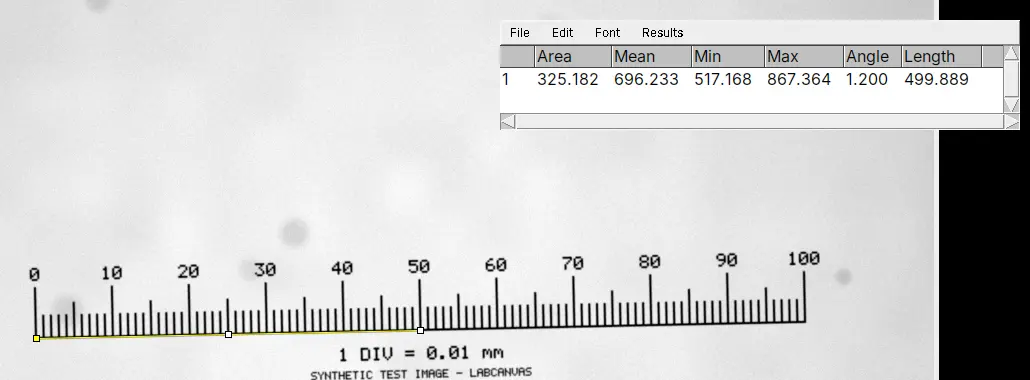
Check Image › Properties…: if the unit is pixel, the image has no scale. Draw a line along a stage micrometer or a scale bar of known length and use Analyze › Set Scale…, or type the known pixel size there. The full steps, with a calibration image to practise on, are in how to set the scale in ImageJ. Do this before measuring: measurements already in the Results table do not change when you set the scale afterwards.
2. Length: straight, segmented and freehand lines
- Choose the Straight Line tool and drag from one end of the object to the other. Zoom in (the + key) to place the ends precisely; hold Shift for an exactly horizontal or vertical line. The status bar shows the length as you drag.
- Press Ctrl M (Analyze › Measure). A straight line gives Length and Angle (degrees from the horizontal), plus the grey values along the line if those are ticked in Set Measurements.
- For a curved object, right-click the line tool and choose Segmented Line (click along the object, double-click to finish) or Freehand Line (drag along it). Edit › Selection › Fit Spline turns a segmented line into a smooth curve through its points, which follows a neurite or a fibre better than straight segments.
- To keep many lines, press T after each one to add it to the ROI Manager (Analyze › Tools › ROI Manager…), then click Measure in the ROI Manager for one row per line.
The line width (double-click the line tool, or Image › Adjust › Line Width…) changes how many pixels are averaged for a profile, not the length.
3. Area: draw it, trace it with the wand, or threshold it
- Draw it: Rectangle, Oval, Polygon (click each corner; double-click, or click the first point, to close) or Freehand (drag around the object). Then Ctrl M.
- Trace it with the wand: choose the Wand tool and click inside the object; it outlines the connected pixels of similar value. Double-click the tool to set its Tolerance and Mode (Legacy, 4-connected or 8-connected). On a thresholded image the wand traces the thresholded object under the click, which is the most repeatable way to outline something by hand.
- Threshold it: Image › Adjust › Threshold… highlights the object in red. Then either tick Limit to threshold in Analyze › Set Measurements… and press Ctrl M (the area of the red pixels inside the selection), or run Analyze › Analyze Particles… for one row per object, with Include holes to measure each object as its outline.
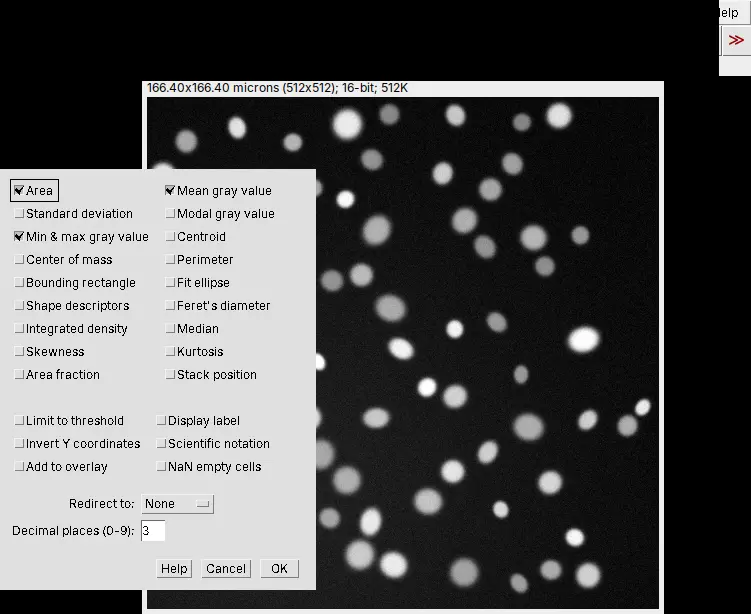
4. Choose the columns: Analyze › Set Measurements…
Area is ticked by default. The others include Mean gray value, Standard deviation, Min & max gray value, Centroid, Center of mass, Perimeter, Bounding rectangle, Fit ellipse, Shape descriptors, Feret's diameter, Integrated density, Median and Area fraction. Also useful: Display label (the image and ROI name in each row) and Decimal places (0-9). For sizes, Area, Perimeter and Feret's diameter (the longest distance across an object, with MinFeret its narrowest width) are the ones to tick; Feret diameter, circularity and solidity explains the shape descriptors.
5. Many objects at once
For more than a handful of objects, threshold them and run Analyze › Analyze Particles… with a size range, Display results and Summarize: every object gets its area, perimeter and Feret diameters, and the Summary window gives the count and mean size. Analyze Particles, explained goes through every option.
Pixels vs calibrated units, and why area scales with the square
A pixel has a length (the pixel size) and an area (the pixel size squared). On an image at 2.5 nm per pixel, one pixel covers
The same measurements, converted back to pixels:
| Measurement | In pixels | × | Calibrated |
|---|---|---|---|
| Line 1 (a nanorod's length) | about 324 pixels | 2.5 nm | 810.9 nm |
| Line 2 | about 234 pixels | 2.5 nm | 585.5 nm |
| Area of the wand-traced rod | 2,728 pixels | 6.25 nm² | 17,050.0 nm² |
The common mistake is to convert an area with the pixel size instead of its square: here that would give 6,820 nm², 2.5 times too small. Let ImageJ do it by setting the scale, and check the unit in the Results table before you copy anything out. In Analyze Particles, sizes are typed in calibrated units squared unless Pixel units is ticked.
Pitfalls
- No scale, or the wrong one. Check the unit in the column header before you copy a number. An image from another objective needs its own scale; in ImageJ, (G) in the title bar means a Global scale is applied to every image.
- Ends placed on blurred edges. Zoom in, and measure every object between the same kind of point (outer edge to outer edge, or tip to tip). For many objects, a threshold and Feret's diameter are more repeatable than lines by hand.
- A straight line on a curved object. It measures the chord, not the length along the curve; use a segmented line or a skeleton.
- Area that depends on the threshold. A higher or lower cut grows or shrinks every object, more for small ones. Pick the method once, report it, and use it on every image.
- Projected lengths. An image is a 2D projection: a rod tilted out of the plane, or an SEM sample viewed at an angle, looks shorter than it is.
- Perimeter depends on resolution. A rough outline gets longer the more finely it is sampled, so compare perimeters only between images at the same pixel size.
- Measurements on a JPEG or a resized copy. Measure the original file; a resized picture needs its scale set again, and compression changes the edges.
Reporting it
A methods sentence to copy, with the parts in brackets filled in:
Lengths and areas were measured in [Fiji (ImageJ 1.54)] on images calibrated at [0.325] µm per pixel (Analyze › Set Scale, from a stage micrometer). Lengths were measured with [straight / segmented] line selections from [tip to tip]; areas from [wand-traced / thresholded (Otsu)] outlines with Analyze › Measure. [n] objects from [N] images per condition were measured.
Cite ImageJ (Schneider et al. 2012) or Fiji (Schindelin et al. 2012). Report lengths and areas as mean ± SD with n, or show the distribution: every object as a point, grouped by biological replicate.
Next: set the scale if you have not, or measure leaf area from a photo. Fiji is also the place for lengths in 3D, through a Z-stack, and for macros that measure thousands of files.
An easier way: measure length and area in LabCanvas
The same lines, outlines and columns work in the browser in LabCanvas Image Analysis, with nothing to install.
- Open the image. A calibrated TIFF opens with its scale; otherwise set it in Image › Scale.
- Draw with the tool rail: Line (L), Rectangle (R), Oval (O), Polygon (G), Freehand (F) or the Wand (W). Each shape becomes an ROI in the Measure tab's list.
- Choose the columns in Set measurements (Area, Perimeter, Feret's diameter and the rest).
- Click Measure, or Measure all ROIs: lines give Length and Angle, areas give Area, each with its unit in the header. For many objects, Count › Count particles is Analyze Particles.
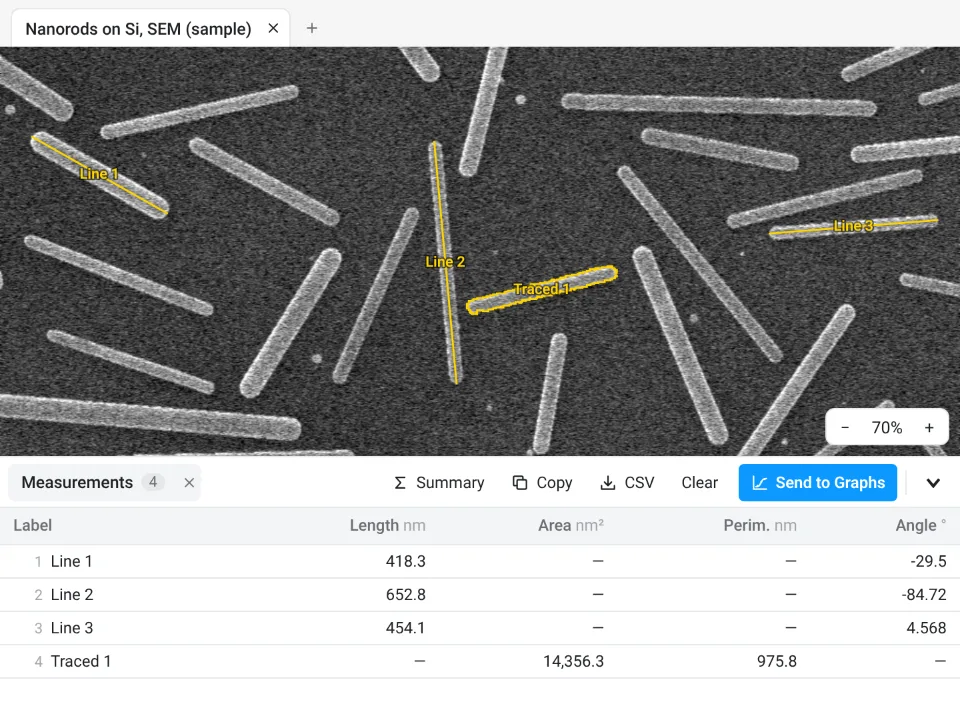
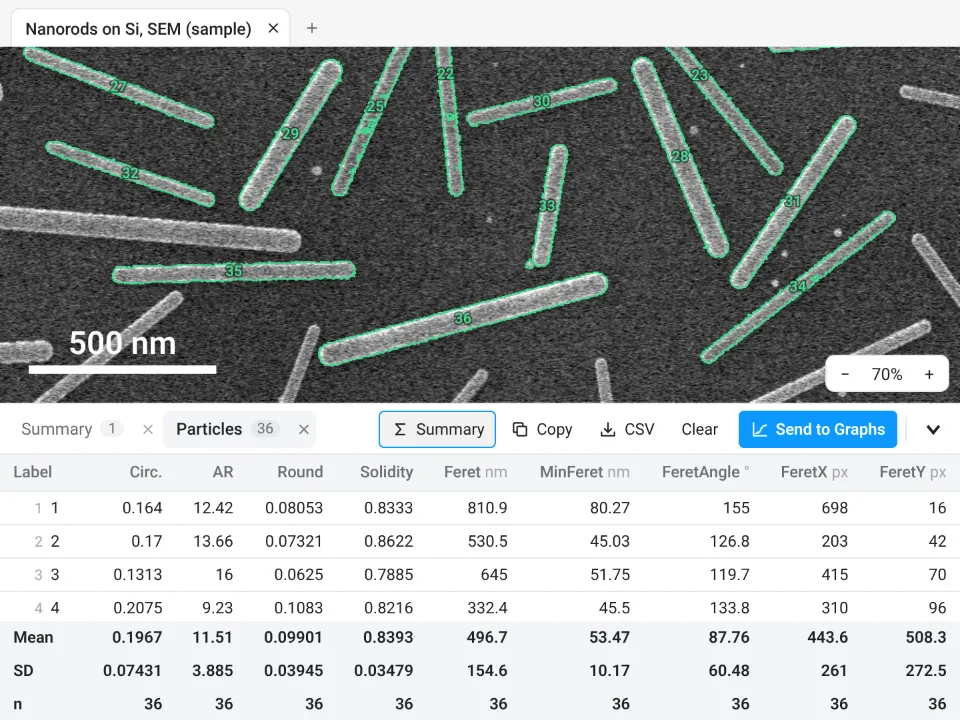
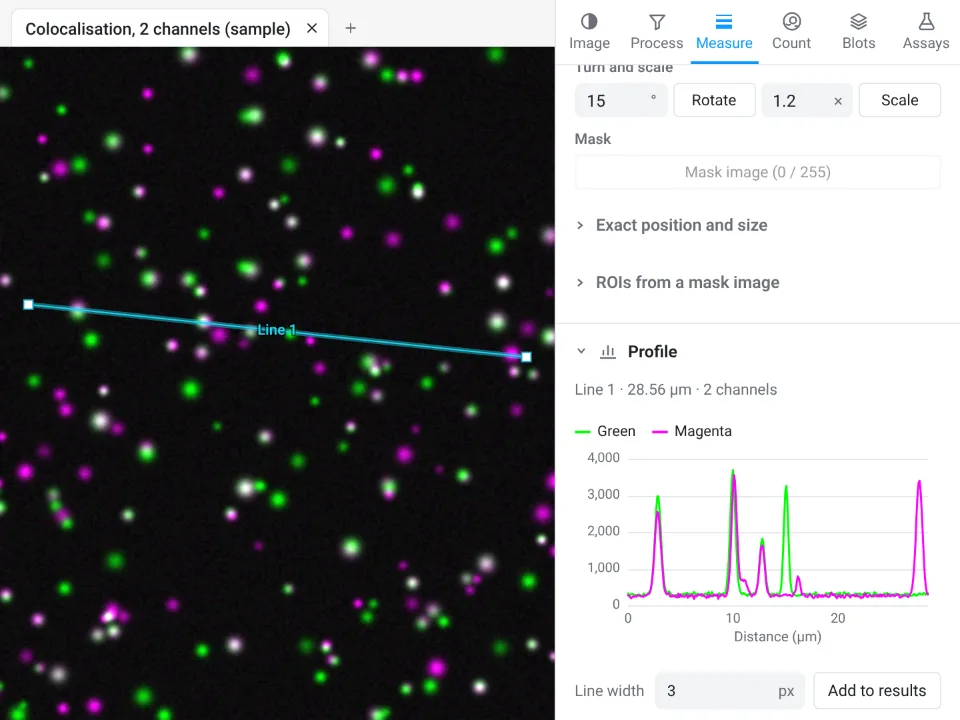
On the same nanorod image, ImageJ's Analyze Particles and LabCanvas Count particles both find 36 rods, 496.7 ± 154.6 nm long (Feret); the perimeter of a traced outline is computed as ImageJ does.
Why it is a good choice for lengths and areas:
- Nothing to install: it runs in the browser on any computer or tablet.
- ImageJ's names and units: Length, Angle, Area, Perim., Feret, with the unit in every column header, so a pixel result is hard to miss.
- Straight into Graphs: Summary adds mean, SD and n, Send to Graphs plots every object as a point, and the Methods line states what was measured and the pixel size.
- Free with a LabCanvas account; downloading the table as CSV is part of LabCanvas Pro. Every measurement is checked in more than 4,000 automated tests.
One limitation: the Line tool draws straight lines only, with no segmented or freehand line yet. Measure a curve in straight pieces, use the Branching and skeleton assay for filaments, or bring ImageJ's segmented lines over with Import… (.roi, RoiSet.zip). Open Image Analysis to measure your own images. ImageJ and Fiji are independent open-source projects; LabCanvas is not affiliated with them.
References
- Schneider CA, Rasband WS, Eliceiri KW (2012). NIH Image to ImageJ: 25 years of image analysis. Nature Methods 9, 671–675. doi:10.1038/nmeth.2089
- Schindelin J, Arganda-Carreras I, Frise E, et al. (2012). Fiji: an open-source platform for biological-image analysis. Nature Methods 9, 676–682. doi:10.1038/nmeth.2019
Frequently asked questions
How do I measure length in ImageJ?
Set the scale first (Analyze › Set Scale…), then draw a line along the object with the Straight Line tool and press Ctrl M (Analyze › Measure). The Results table gives the Length in your unit and the Angle of the line. Zoom in to place the ends precisely.
How do I measure a curved line in ImageJ?
Right-click the line tool and choose Segmented Line (click along the curve, double-click to finish) or Freehand Line (drag along it), then press Ctrl M. Edit › Selection › Fit Spline turns a segmented line into a smooth curve through its points. A straight line between the ends of a curved object underestimates its length.
How do I measure area in ImageJ?
Outline the object with the Rectangle, Oval, Polygon or Freehand selection tool, or click it with the Wand, and press Ctrl M: the Results table gives the Area in your unit squared, if the scale is set. For many objects, threshold the image (Image › Adjust › Threshold…) and run Analyze › Analyze Particles….
Why does ImageJ give my measurements in pixels?
Because the image has no scale: it was saved as JPEG or PNG, taken as a screenshot, or the scale was never set. Set it with Analyze › Set Scale…, from a stage micrometer, a scale bar or the known pixel size, and measure again. Image › Properties… shows the current unit and pixel size.
How do I convert an area from pixels to µm²?
Multiply by the pixel size squared, not by the pixel size. At 0.5 µm per pixel, one pixel covers 0.25 µm², so 1,000 pixels are 250 µm². Lengths are multiplied by the pixel size itself: 100 pixels are 50 µm.
What is the difference between Area and Area fraction in ImageJ?
Area is the size of the selection (or the whole image) in calibrated units squared. Area fraction is the percentage of the pixels in that selection that are thresholded (highlighted in red), or that are not zero when there is no threshold. Use Area fraction for percent coverage, such as the stained area of a section.
Try it in LabCanvas
Every app is free to start in your browser. Create an account and begin.
Start Image Analysis free in your browserKeep reading

ImageJ vs LabCanvas Image Analysis: an honest comparison
ImageJ/Fiji or LabCanvas Image Analysis? Six everyday jobs done in both, six newer ones (macros, vendor files, 3D, StarDist, big images) and which to use.

How to use ImageJ: a beginner's tutorial for the 10 everyday jobs (2026)
How to use ImageJ and Fiji: get started, open an image, then 10 everyday jobs (scale, measure, threshold, count, background, blots) with exact menu paths.

How to set the scale and add a scale bar in ImageJ (with a calibration image to practise on)
Set the scale in ImageJ (Analyze › Set Scale) from a micrometer, scale bar or pixel size, add a scale bar, and practise on a free calibration image.