Analyze Particles in ImageJ, explained (every option, with examples)
Every Analyze Particles option in ImageJ, shown on a TEM image: size, circularity, Show, Exclude on edges, Include holes, and why it finds 0 or 1 particle.
Contents
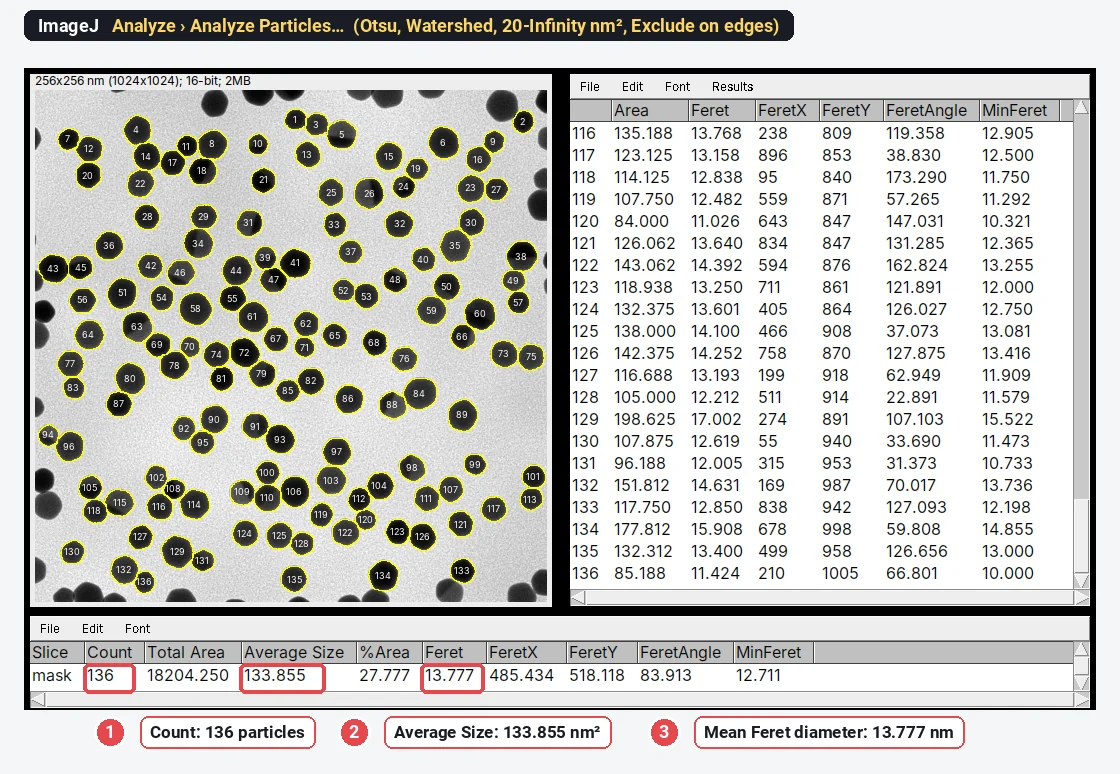
Analyze › Analyze Particles… counts and measures every separate object in a thresholded image or binary mask. Threshold the particles first (Image › Adjust › Threshold…), choose a size range and a circularity range, tick Display results, Summarize and Exclude on edges, and click OK: the Summary window gives the count, total area, average size and %Area, and the Results table gives one row per particle with the columns chosen in Analyze › Set Measurements….
The worked example below is a sample TEM image of gold nanoparticles (synthetic, generated for these guides, 1024 × 1024 pixels at 0.25 nm per pixel). With Otsu, watershed, a minimum size of 20 nm² and Exclude on edges, ImageJ 1.54f counts 136 particles with a mean Feret diameter of 13.777 ± 1.585 nm.
What Analyze Particles needs before you run it
Analyze Particles does not find particles by itself. It traces the pixels that are already selected, either the red pixels of an active threshold or the foreground of a binary mask, and treats each connected group as one particle (pixels touching at a corner count as connected).
- Set the scale, so that sizes come out in nm² or µm². A TIFF from ImageJ or many microscopes carries it; check Image › Properties…, or set it from the scale bar as in how to set the scale in ImageJ.
- Choose the measurements in Analyze › Set Measurements…: Area, plus Shape descriptors and Feret's diameter for particle sizes and shapes.
- Threshold with Image › Adjust › Threshold…: for dark particles on a bright TEM background, untick Dark background; for bright particles (SEM secondary electrons, fluorescence), tick it. Check that the red covers the particles and nothing else.
- Clean the mask if particles touch: Apply (or Process › Binary › Convert to Mask), Process › Binary › Fill Holes, then Process › Binary › Watershed.
On the TEM sample, without the watershed, touching particles merge: ImageJ counts 74 "particles" with a mean Feret of 21.7 ± 9.7 nm instead of 136 at 13.78 ± 1.59 nm. More on that in nanoparticle size distribution from TEM images.
Every option in the Analyze Particles dialog
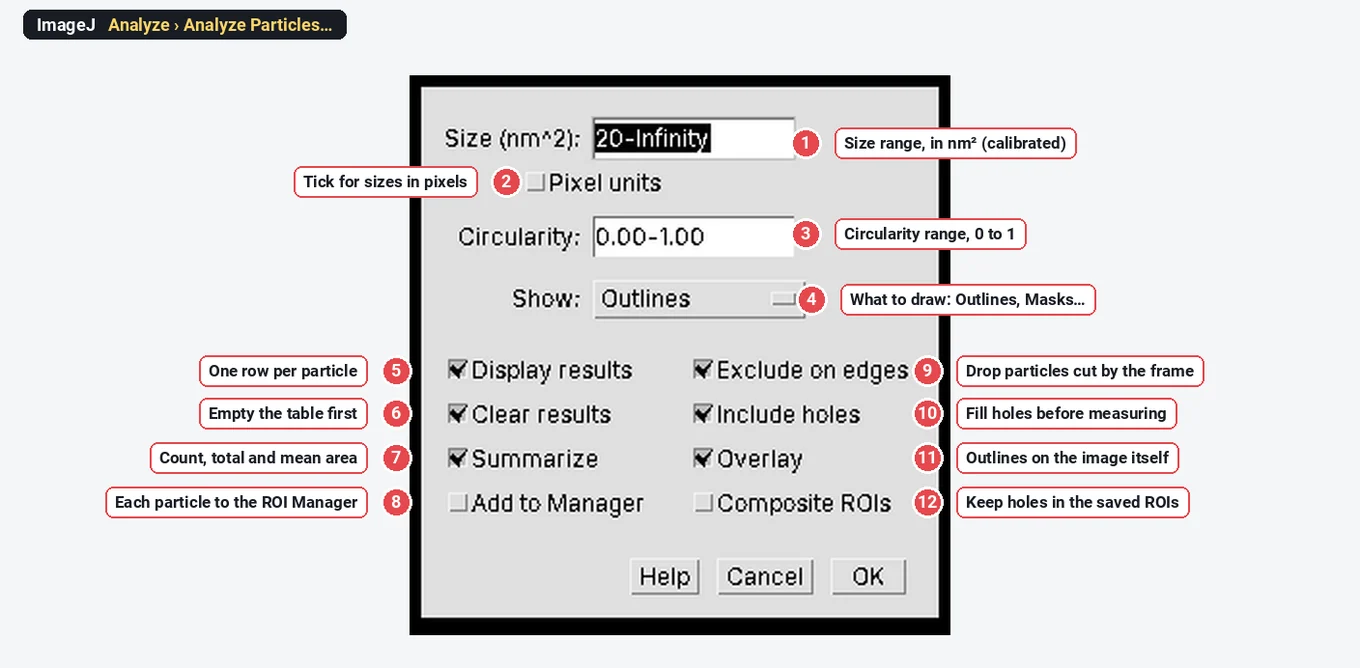
| # | Option | What it does | A good starting value |
|---|---|---|---|
| 1 | Size | Keeps particles whose area is inside the range, for example 20-Infinity | Just above the largest noise speck |
| 2 | Pixel units | Reads the size range in pixels instead of calibrated units | Off on calibrated images |
| 3 | Circularity | Keeps particles whose circularity ( | 0.00-1.00 (no filter) |
| 4 | Show | What to draw: Nothing, Outlines, Bare Outlines, Ellipses, Masks, Count Masks, Overlay, Overlay Masks | Overlay or Outlines, to check the result |
| 5 | Display results | One row per particle in the Results table | On |
| 6 | Clear results | Empties the Results table before adding rows | On, unless you collect several images in one table |
| 7 | Summarize | One row per image in a Summary table: Count, Total Area, Average Size, %Area and the mean of the other columns | On |
| 8 | Add to Manager | Sends every particle to the ROI Manager as an ROI | On when you want to measure the particles on another image or save them |
| 9 | Exclude on edges | Leaves out particles that touch the edge of the image or selection | On for sizes and shapes |
| 10 | Include holes | Measures each particle by its outer outline, holes included | On for solid particles with specks inside |
| 11 | Overlay | Draws the particle outlines on the analysed image as an overlay | On, if Show is Nothing |
| 12 | Composite ROIs | Records particles that have holes as composite ROIs (outline minus holes) | On only for hollow or porous particles |
The sections below take each group in turn, with what it changes on a real run.
Size: calibrated units or pixels
The Size range is an area, and on a calibrated image it is in calibrated units: the label says Size (nm^2) or Size (micron^2). Type a single number for a minimum (20 means 20-Infinity), or a range such as 20-500. Tick Pixel units to give the range in pixels.
Choose the minimum from the image. On the TEM sample the smallest real particle is about 80 nm² and the noise specks are a few pixels, so anything from 5 to 50 nm² gives the same 136 particles. Write the minimum in your methods: it decides what counts as a particle.
For a size distribution, keep the upper limit at Infinity. Setting a maximum to "remove aggregates" also removes the largest single particles, and the distribution narrows for the wrong reason.
Circularity: a shape filter
Circularity is
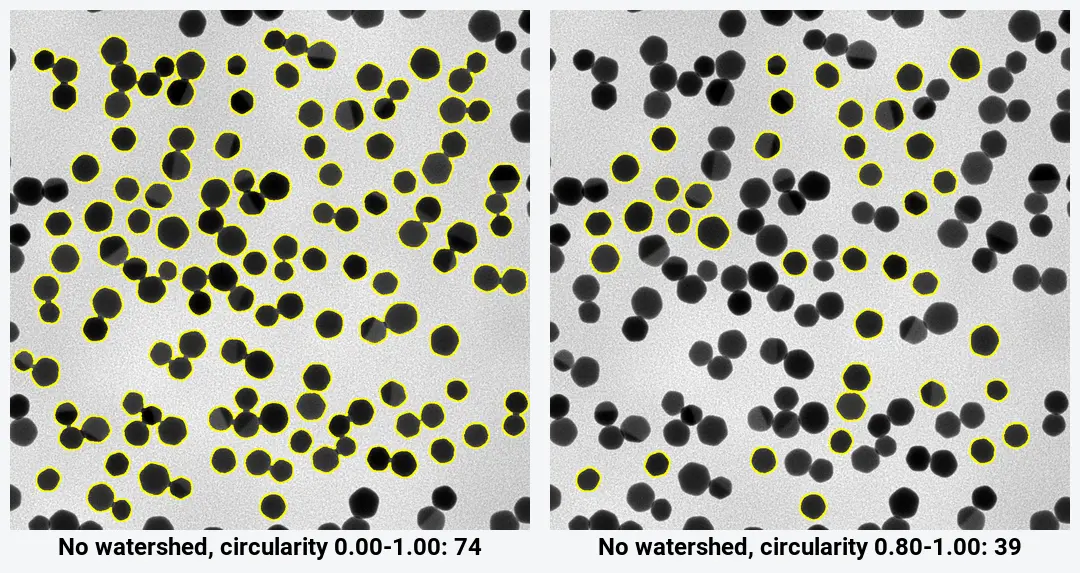
Use it with care. On the TEM sample without watershed, a 0.80-1.00 range drops the merged clusters, but the particles inside them go too: 39 particles are left of the 136 that watershed separates. If isolated particles are smaller or larger than clustered ones, the mean shifts. Circularity also depends on the pixel size: a digitised circle 200 pixels across measures 0.903 in ImageJ, not 1, and small particles of a few pixels score lower still. Feret diameter, circularity and solidity shows why.
Show: what Analyze Particles draws
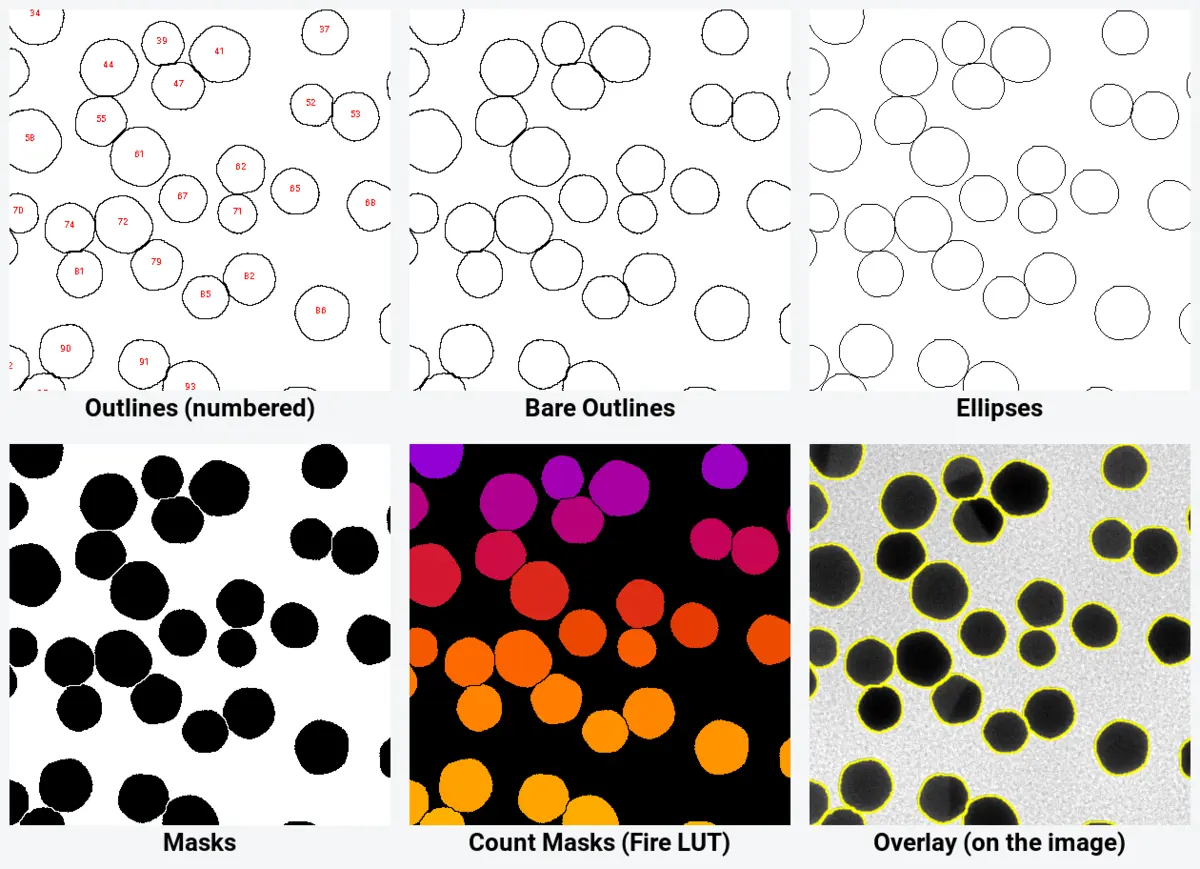
- Outlines draws the outlines in a new image, each labelled with its row number in the Results table. Use it to find a particle from the table.
- Bare Outlines: the same without the numbers.
- Ellipses: the ellipse fitted to each particle (the one behind Major, Minor and AR).
- Masks: a new binary image with only the particles that passed the filters (shown with an inverted LUT, so particles look black). Useful as a clean mask for the next step.
- Count Masks: a 16-bit image in which every pixel of particle n has the value n: a label image for other tools.
- Overlay and Overlay Masks: outlines or filled shapes on the original image, without changing its pixels. This is the best check: zoom in and look for merged pairs, cut particles and missed ones.
Display results, Clear results and Summarize
Display results writes one row per particle, with the columns ticked in Set Measurements. Clear results empties the table first; untick it to collect particles from several images in one table (tick Display label in Set Measurements so you know which row came from which image). Summarize adds one row per image to a separate Summary table.
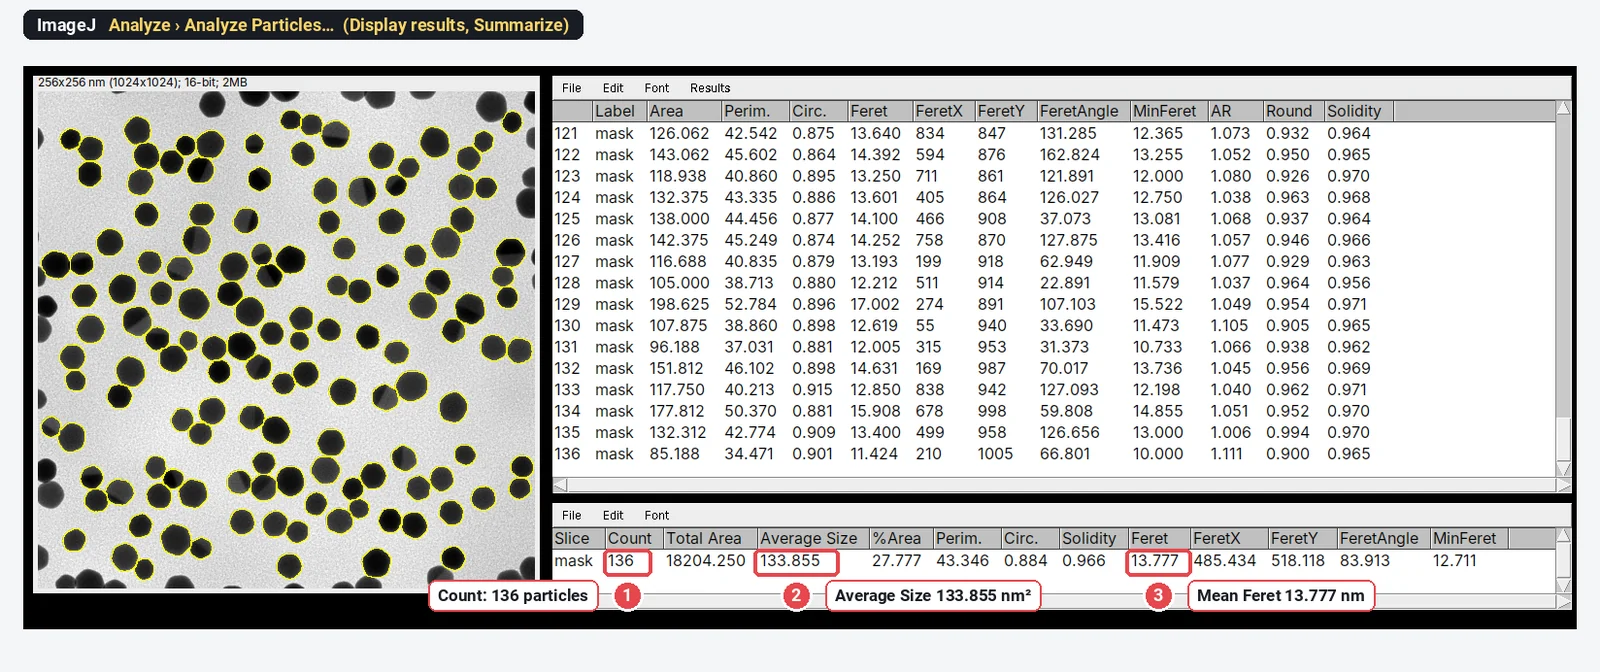
The Summary's %Area is the total area of the counted particles over the image area. With Exclude on edges on it leaves out the cut particles, so it is not the area fraction of the image: for that, see porosity from SEM images.
Add to Manager
Add to Manager puts every particle in the ROI Manager (Analyze › Tools › ROI Manager…). From there Measure measures them again, on this image or on another channel (redirect the measurement or select the other image and click Measure), and More › Save writes a RoiSet.zip. The ROIs are also how you delete a wrong particle by hand: select it in the list, Delete, then Measure again.
Exclude on edges: count and size
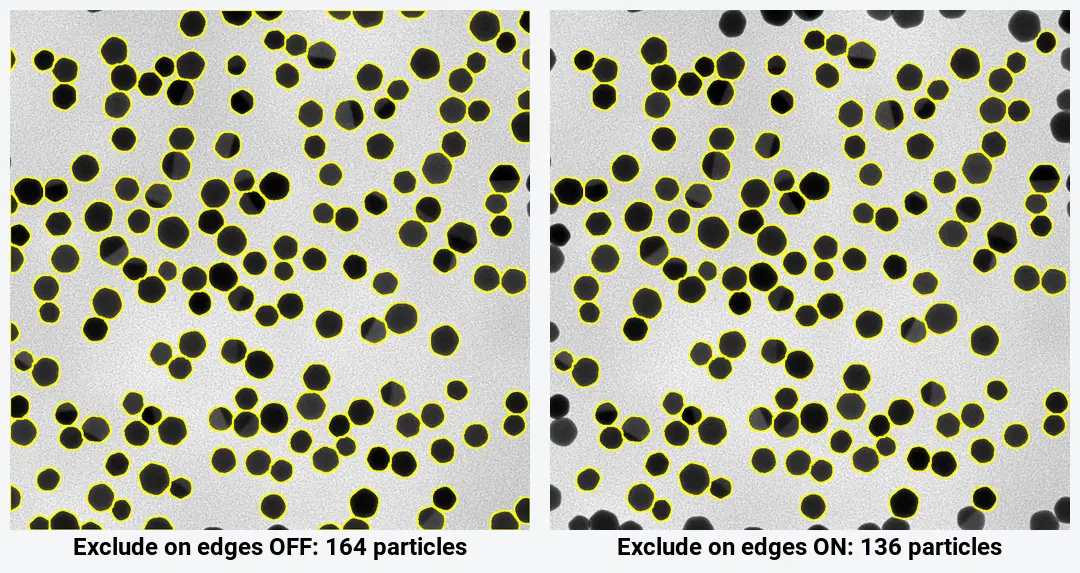
A particle cut by the frame is measured smaller than it is. On the TEM sample, Exclude on edges takes the count from 164 to 136, and the mean area from 124.9 to 133.9 nm². For sizes and shapes, always tick it.
For a number per area (particles per µm², pores per cm²), excluding edge particles undercounts, and large particles are excluded more often than small ones. Two fixes: count each edge particle as half (run once with and once without Exclude on edges; the difference is the number cut), or measure inside a smaller rectangle and count the particles whose centre lies in it.
Include holes and Composite ROIs
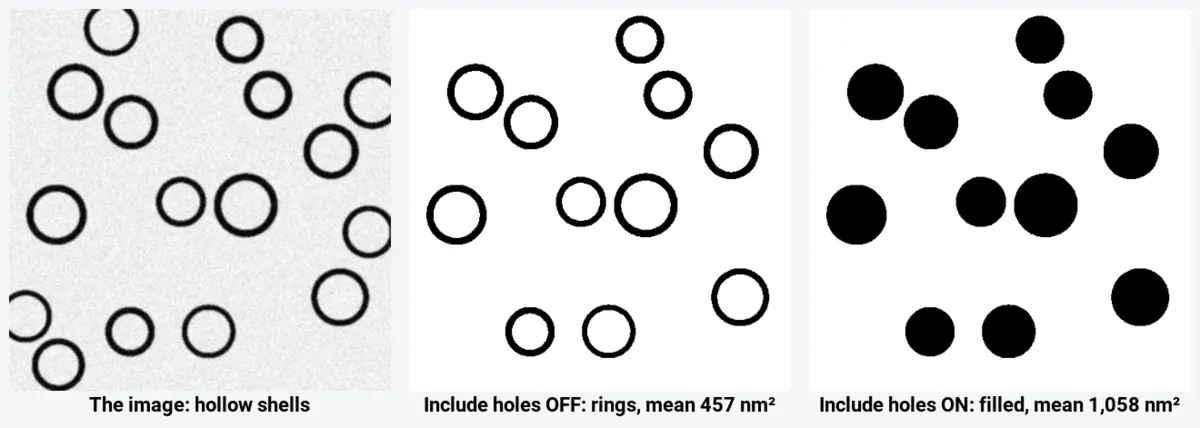
Include holes decides whether the inside of a particle counts. Ticked, every particle is measured by its outer outline, so a speck of bright noise inside a dark nanoparticle does not take a bite out of its area; this is what you want for solid particles. Unticked, holes are left out of the area, which is what you want for the shell itself (the metal in a nanoshell, the wall of a ring). On the synthetic shells the mean area is 1,058 nm² with Include holes and 457 nm² without it.
Process › Binary › Fill Holes before Analyze Particles does the same job as Include holes for solid particles, and makes the mask itself clean.
Composite ROIs matters only when holes are left out and you keep the ROIs (Add to Manager or Overlay). In ImageJ 1.54f a particle with holes is then stored as a composite ROI, the outline minus the holes. Without it the stored ROI is the plain outer outline, which includes the hole if you measure it again.
Overlay
The Overlay checkbox puts the outlines of the counted particles on the analysed image itself, as a non-destructive overlay, so you can check them without a second window. Image › Overlay › Remove Overlay takes them off.
Why does Analyze Particles count zero, or one giant particle?
| Symptom | Most likely cause | Fix |
|---|---|---|
| 0 particles | Nothing is thresholded (no red) and the image is not binary | Set a threshold, or Apply it to make a mask |
| 0 particles | Size range in the wrong units: pixels typed into a nm² field | Divide by the pixel area, or tick Pixel units |
| 0 particles | The background is thresholded and Exclude on edges is on: the only "particle" touches every edge | Flip Dark background, or Edit › Invert the mask |
| 0 particles | Circularity minimum too high for small, pixelated particles | Lower it, or set 0.00-1.00 |
| 1 giant particle | The background is the object (inverted threshold or mask) | Flip Dark background; check Process › Binary › Options › Black background |
| 1 particle per clump | Touching particles share pixels | Process › Binary › Watershed before counting |
| Thousands of tiny particles | Noise specks pass the size filter | Raise the minimum size; a Median filter (radius 1–2) before thresholding |
| Count changes between images | An automatic threshold moves with brightness | Check each image; use one manual threshold for a series when the imaging is identical |
The black-background setting deserves its own line. A mask is foreground on background, and ImageJ reads which is which from Process › Binary › Options… › Black background. If a mask made with one setting is analysed with the other, the background becomes the particle. When a mask looks right but the count is 1, this is the reason.
Reporting it
A methods sentence to adapt:
Particles were analysed in ImageJ 1.54f (Schneider et al., 2012). Images (0.25 nm per pixel) were thresholded with the Otsu method, holes were filled and touching particles separated with the watershed algorithm; particles smaller than 20 nm² and particles touching the image edge were excluded. The Feret diameter of each particle was measured (n = 136 particles from one image).
Give the count of particles and of images, the threshold method, the size filter, whether edge particles and touching particles were handled, and the mean ± SD with the histogram.
How do I run Analyze Particles on many images?
Analyze Particles is one command in a scriptable program, so it scales. Record the steps once with Plugins › Macros › Record…, then run the macro on a folder with Process › Batch › Macro…: each image gets its own row in the Summary table if Summarize is on. Keep the threshold method, size range and options identical across the series, and look at the outlines of a few images from each condition before you trust the numbers.
When a threshold cannot separate the particles, Fiji adds more: MorphoLibJ for label images and 3D particles, Trainable Weka Segmentation for images no threshold can split, and StarDist for crowded round objects.
An easier way: count particles in LabCanvas
LabCanvas Image Analysis does the same job in the browser, with nothing to install and no plugins: threshold, clean-up and count sit in one panel.
- Open the TIFF (drop it on the window or press Ctrl O); the pixel size is read from an ImageJ TIFF.
- In Count › Count particles, choose the Otsu threshold with Dark objects, tick Fill holes, Separate touching objects (watershed) and Exclude particles on the edges, and set the smallest particle to 20 nm².
- Tick Feret's diameter in Set measurements and click Count.
- Click Send to Graphs and pick the Feret column for a histogram with mean ± SD.
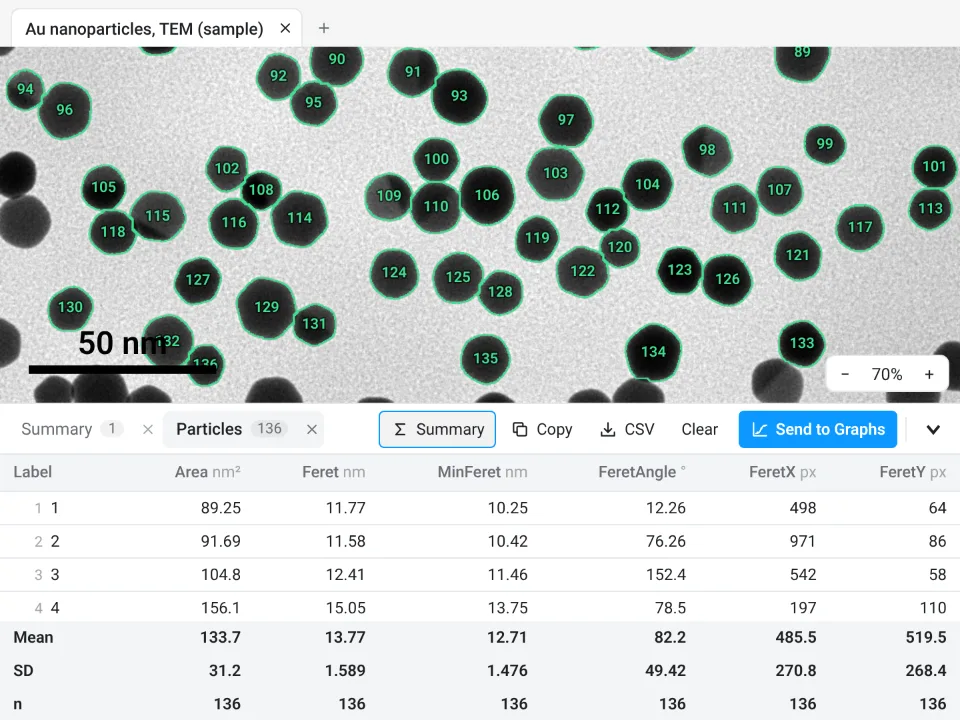
On the same TEM sample LabCanvas counts 136 particles with a Feret diameter of 13.77 ± 1.589 nm; ImageJ gave 136 and 13.777 ± 1.585 nm.
Why it is a good choice for this job:
- Nothing to install: it runs in the browser on any computer or tablet.
- ImageJ's own names: Fill holes, watershed, size, circularity and exclude on edges, and a Summary row with Count, Total Area, Average Size and %Area. Watershed is a tick box, not a separate command.
- An image check flags clipped pixels, JPEG compression and uneven light before you count.
- Results go straight to Graphs for the histogram and statistics, and each table carries a methods sentence to copy.
- Free with a LabCanvas account (CSV download is part of Pro), and every measurement is checked in more than 4,000 automated tests.
There is no macro language; Count › Batch runs the same Count particles settings on many images. Open Image Analysis.
ImageJ and Fiji are independent open-source projects; LabCanvas is not affiliated with them.
References
- Schneider CA, Rasband WS, Eliceiri KW (2012). NIH Image to ImageJ: 25 years of image analysis. Nature Methods 9(7): 671–675. doi:10.1038/nmeth.2089
Frequently asked questions
Why does Analyze Particles count zero particles?
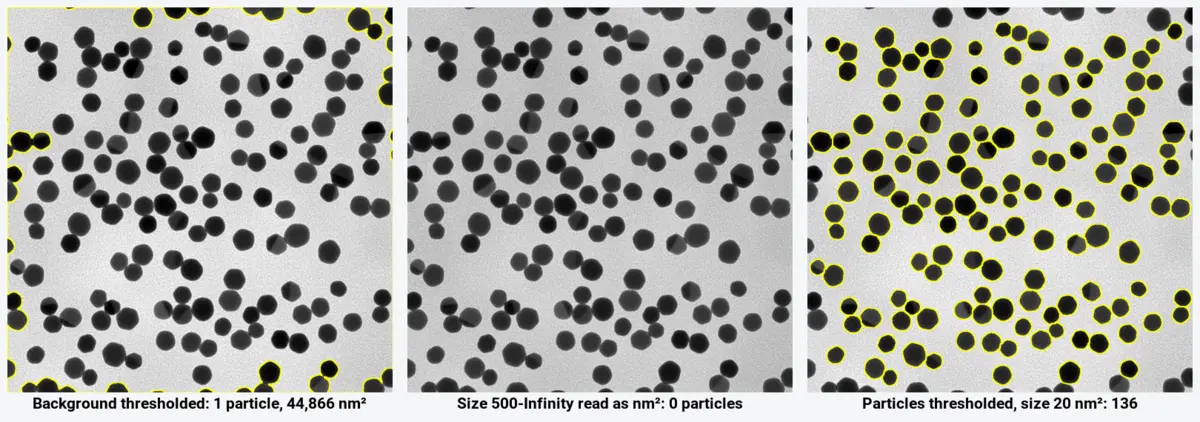
Usually because nothing is thresholded, or the size range is in the wrong units. Analyze Particles needs a thresholded image or a binary mask, and on a calibrated image the Size field is in calibrated units (nm², µm²), not pixels: on our TEM sample a minimum of 500 meant as pixels is 500 nm², bigger than any particle, so the count is 0. Also check Exclude on edges: if the background is what is thresholded, it touches the edges and is excluded, which also gives 0.
Why does Analyze Particles find one huge particle?
The background has been thresholded instead of the particles. On our TEM sample, Otsu with Dark background ticked selects the bright support film: one particle of 44,866 nm² out of a 65,536 nm² image. Untick Dark background (or tick it, for bright particles), or invert the mask with Edit › Invert, and run it again.
Is the Size range in Analyze Particles in pixels or µm²?
In calibrated units whenever the image has a scale: the label shows it, for example Size (nm^2). Tick Pixel units to type the range in pixels instead. Uncalibrated images always use pixels.
What does Exclude on edges do in ImageJ?
It leaves out every particle that touches the edge of the image (or of the selection), because its true size is unknown. On the TEM sample it drops the count from 164 to 136 particles. Keep it on for sizes and shapes; for a count per area, count edge particles as halves or use a guard frame.
What does Include holes do?
With Include holes ticked, each particle is measured by its outer outline, with any holes inside counted as part of it. Unticked, holes are left out of the area. On hollow shells the mean area goes from 457 nm² (ring only) to 1,058 nm² (whole shell).
How do I get a particle size distribution from Analyze Particles?
Tick Feret's diameter (and Area) in Analyze › Set Measurements, run Analyze Particles with Display results, then use Analyze › Distribution… on the Feret column for a histogram with n, mean and SD. For equivalent circle diameters, compute
Try it in LabCanvas
Every app is free to start in your browser. Create an account and begin.
Start Image Analysis free in your browserKeep reading

ImageJ vs LabCanvas Image Analysis: an honest comparison
ImageJ/Fiji or LabCanvas Image Analysis? Six everyday jobs done in both, six newer ones (macros, vendor files, 3D, StarDist, big images) and which to use.

How to use ImageJ: a beginner's tutorial for the 10 everyday jobs (2026)
How to use ImageJ and Fiji: get started, open an image, then 10 everyday jobs (scale, measure, threshold, count, background, blots) with exact menu paths.

How to set the scale and add a scale bar in ImageJ (with a calibration image to practise on)
Set the scale in ImageJ (Analyze › Set Scale) from a micrometer, scale bar or pixel size, add a scale bar, and practise on a free calibration image.