Feret diameter, circularity, aspect ratio and solidity in ImageJ, explained
What ImageJ shape descriptors mean: Feret and MinFeret, circularity, AR, roundness and solidity, with formulas, drawn shapes and real TEM and SEM numbers.
Contents
ImageJ describes the size and shape of a particle with a few numbers: Feret is the longest calliper distance across it and MinFeret the narrowest; circularity
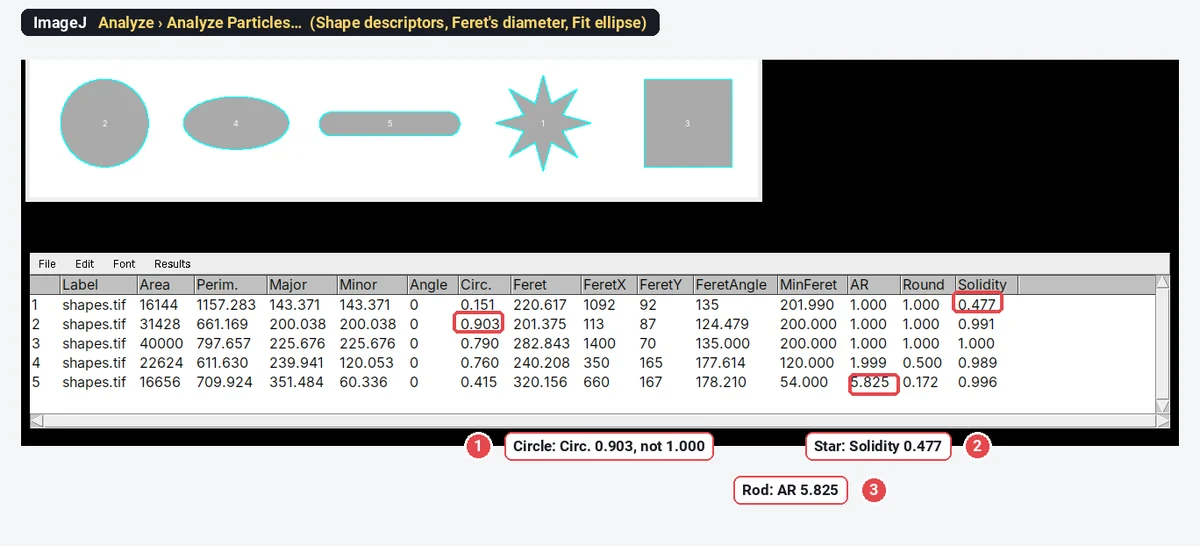
The clearest way to see what each one means is to measure shapes whose answers you know. Below, five shapes drawn by an ImageJ macro at 1 nm per pixel, measured in ImageJ 1.54f; then the same columns on a TEM image of nanoparticles and an SEM image of nanorods.
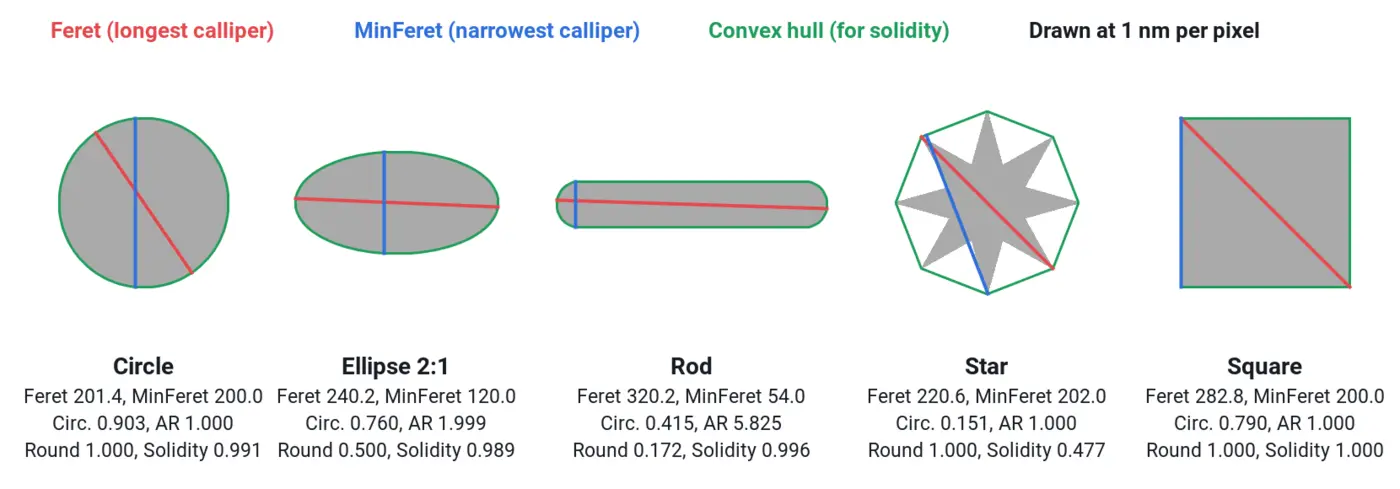
The five shapes, measured
| Shape (drawn size) | Feret | MinFeret | Circ. | AR | Round | Solidity |
|---|---|---|---|---|---|---|
| Circle, 200 px across | 201.375 | 200.000 | 0.903 | 1.000 | 1.000 | 0.991 |
| Ellipse, 240 × 120 px | 240.208 | 120.000 | 0.760 | 1.999 | 0.500 | 0.989 |
| Rod (rounded ends), 320 × 54 px | 320.156 | 54.000 | 0.415 | 5.825 | 0.172 | 0.996 |
| Star, 8 points | 220.617 | 201.990 | 0.151 | 1.000 | 1.000 | 0.477 |
| Square, 200 × 200 px | 282.843 | 200.000 | 0.790 | 1.000 | 1.000 | 1.000 |
Feret and MinFeret are in nm (1 nm per pixel). Read across a row and each descriptor shows what it can and cannot see:
- Feret finds the longest dimension, whatever the shape: the square's diagonal (
- MinFeret is the narrowest width: the rod's 54 nm, the square's side.
- Circularity drops for elongation (ellipse 0.760, rod 0.415), for corners (square 0.790) and above all for notches (star 0.151).
- AR and Round come from the fitted ellipse, so they only see elongation: the square and the star both have AR 1.000.
- Solidity only sees concavity: everything convex is near 1, the star is 0.477.
Feret diameter and MinFeret
Feret's diameter is the longest distance between any two points on a particle's outline, the reading of a calliper closed on the particle in the direction where it is widest. MinFeret is the smallest calliper width, over all directions. ImageJ adds:
- FeretAngle: the angle of the Feret line, 0–180°, measured from the horizontal.
- FeretX and FeretY: the start point of the Feret line, in pixels.
For a nanorod or nanowire, Feret is the length and MinFeret the width. For a faceted nanoparticle, Feret is the corner-to-corner size, slightly more than the face-to-face size a crystallographer might quote. For a circle, Feret and MinFeret are the diameter (201.4 and 200.0 for the drawn 200 px circle: the pixel corners add a little).
In ImageJ 1.x the Feret line can be drawn with a macro: Roi.getFeretPoints(x, y) returns the two end points of the Feret diameter and then the two of MinFeret, which is how the red and blue lines above were made.
Circularity
A circle has the shortest perimeter for its area, so it scores 1; every other shape scores less. ImageJ caps the value at 1.
The catch is the perimeter. ImageJ measures it along the pixelated outline, and a staircase is longer than the smooth curve it approximates. The drawn circle has a perimeter of 661.2 nm against
- Compare circularities only at similar sizes in pixels. A particle 10 pixels across scores lower than the same shape 100 pixels across.
- Noise lowers it. On our AAO pore sample, the mean circularity of the same 160 pores is 0.736 on the raw image and 0.900 after a 2-pixel median filter: the pores did not change, their outlines got smoother.
- Use it as a relative filter, not an absolute measure. A range of 0.6–1.0 keeps round pores and drops merged pairs; "0.903" is not a statement about how round a particle is.
Aspect ratio (AR) and roundness
ImageJ fits an ellipse with the same area and the same second moments as the particle (Fit ellipse gives its Major, Minor and Angle). Then:
Because the fitted ellipse has the same area as the particle, Round is always
AR is not Feret/MinFeret. For smooth convex shapes they are close (the rod: AR 5.825, Feret/MinFeret 320.2/54 = 5.93), but a square has AR 1.000 and Feret/MinFeret 1.414, and on the SEM nanorods below the two ratios differ by two units. For nanorods most people mean length/width, which is Feret/MinFeret; whichever you use, name it.
Solidity and the convex hull
Solidity is the descriptor to use for aggregates and irregular particles: two touching spheres that the watershed missed have a waist, so their solidity drops to about 0.88 (
In ImageJ, Edit › Selection › Convex Hull turns a selection into its hull, so you can see it and measure its area.
On a TEM image: gold nanoparticles
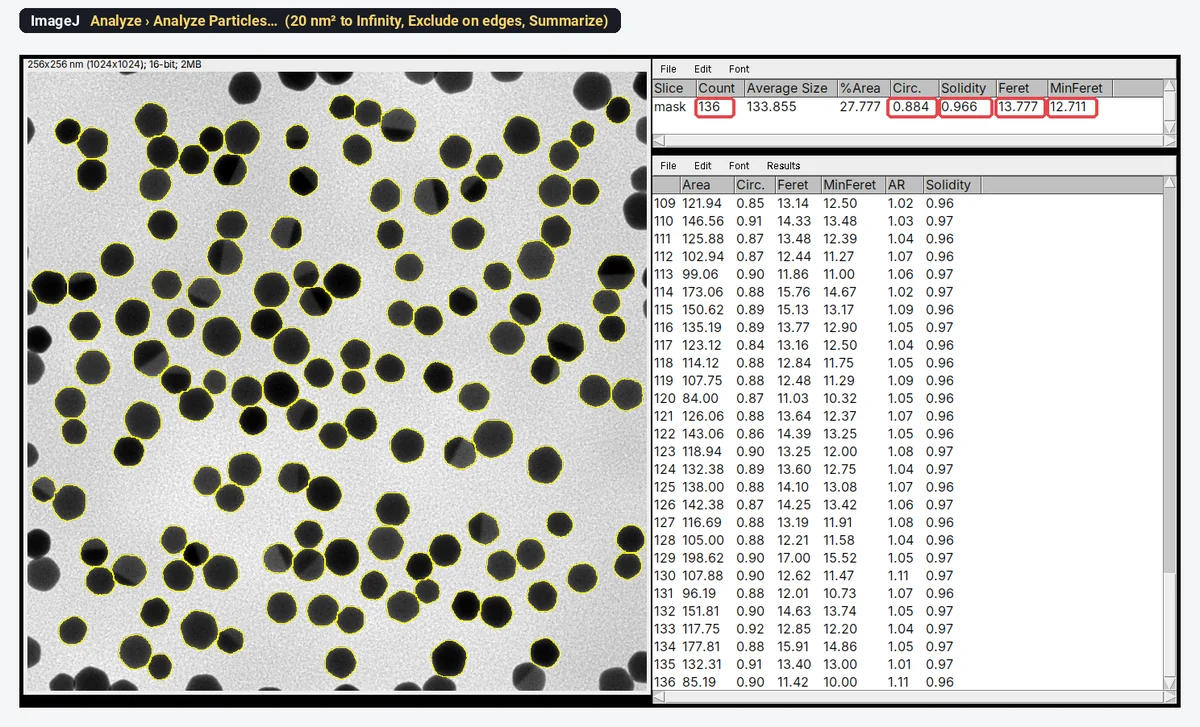
The same columns on the TEM sample (synthetic, 0.25 nm per pixel), measured in ImageJ 1.54f with Otsu, Fill Holes, Watershed and Analyze Particles from 20 nm² with Exclude on edges, 136 particles:
| Column | Mean ± SD |
|---|---|
| Feret | 13.78 ± 1.59 nm |
| MinFeret | 12.71 ± 1.49 nm |
| Equivalent diameter, | 12.97 ± 1.52 nm |
| Circ. | 0.884 ± 0.015 |
| AR | 1.055 ± 0.028 |
| Round | 0.948 ± 0.025 |
| Solidity | 0.966 ± 0.004 |
Three different "diameters" of the same particles differ by more than 1 nm, about 8%. That is larger than many of the differences people try to show between two syntheses, which is why the methods must say which one was measured. The shape columns say the particles are slightly faceted (circularity and solidity below a circle's) and very slightly elongated (AR 1.055).
On an SEM image: nanorods
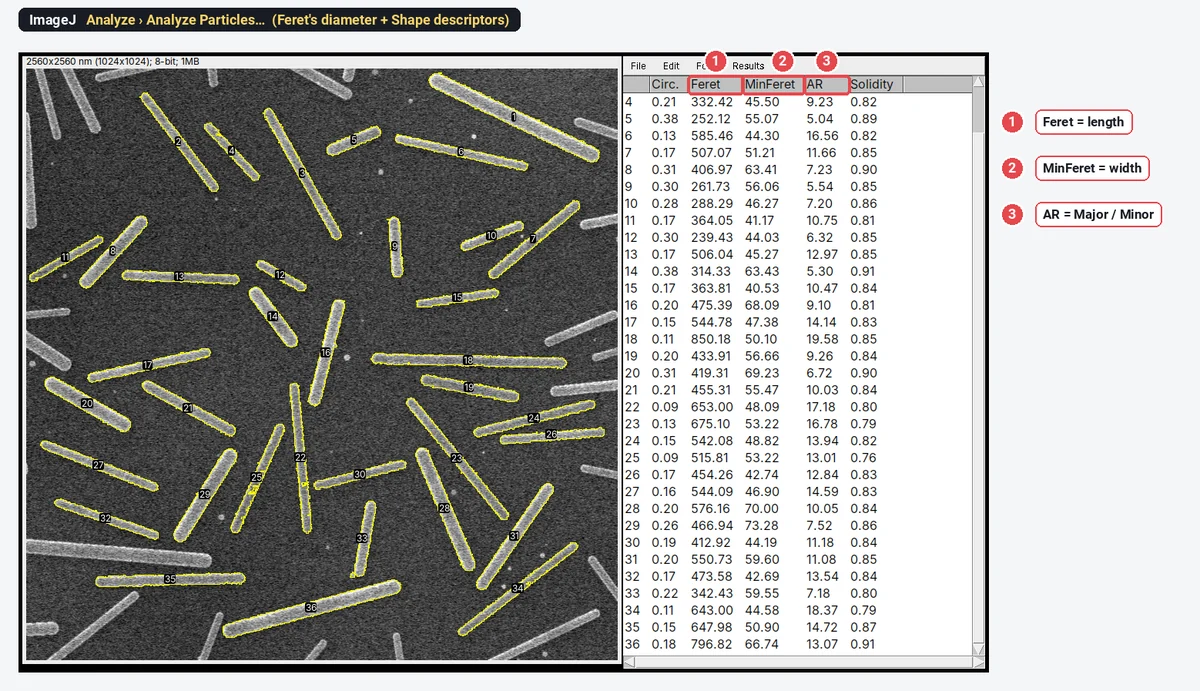
On the SEM nanorod sample (synthetic, 2.5 nm per pixel), measured in ImageJ with Otsu (bright rods), Fill Holes, no watershed (it would cut rods in two), Exclude on edges and a minimum of 4,000 nm², ImageJ finds 36 rods: length (Feret) 496.7 ± 154.6 nm, width (MinFeret) 53.47 ± 10.17 nm, AR 11.51 ± 3.885, solidity 0.839. The per-rod Feret/MinFeret is 9.50 ± 3.06, lower than the ellipse AR. On drawn, perfectly smooth rods the two ratios agree; on rods with real edges they measure different things (a calliper width against a moment-based ellipse) and drift apart. The picture at the top of this article is this run: every rod outlined and numbered, with its Feret, MinFeret and AR in the Results table.
For curved or branched wires neither Feret nor AR is the length: trace them, or skeletonise them, as in nanorod length, width and aspect ratio.
How to measure shape descriptors in ImageJ (or Fiji)
- Set the scale (Analyze › Set Scale…, or from the file), so Feret comes out in nm or µm. Shape descriptors have no units and need no scale.
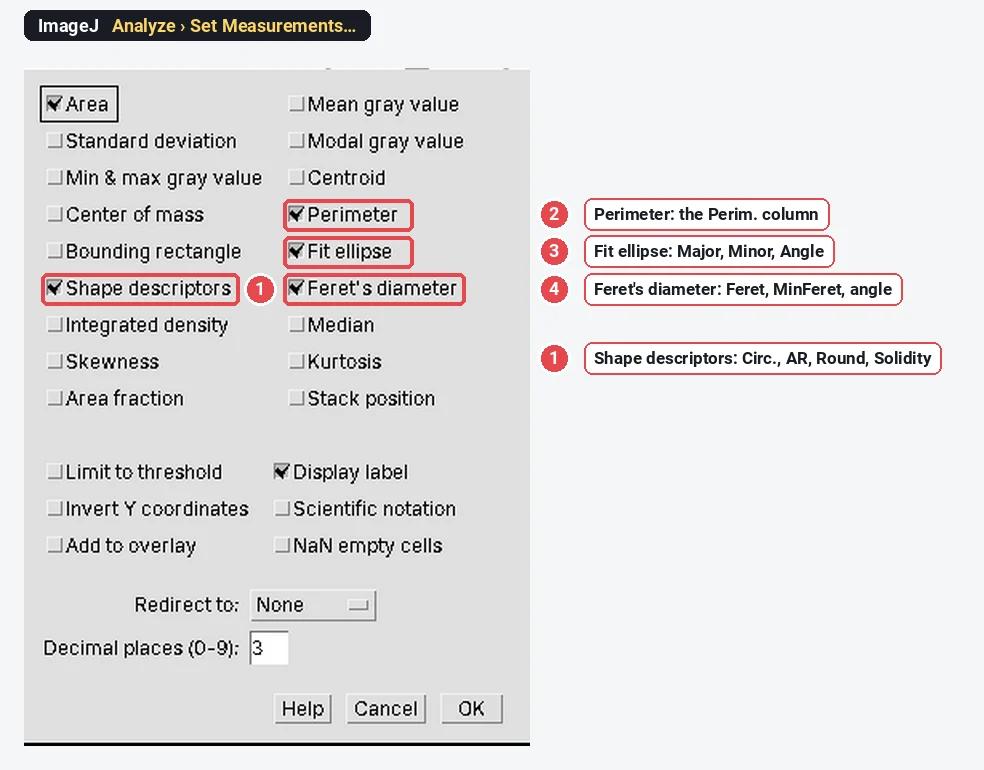
- Analyze › Set Measurements…: tick Area, Perimeter, Shape descriptors, Fit ellipse and Feret's diameter; Display label if you will pool images.
- For one particle: select it (the Wand tool on a thresholded image, or draw it) and press M (Analyze › Measure).
- For all particles: threshold, clean the mask (Fill Holes, Watershed for round touching particles), then Analyze › Analyze Particles… with Display results and Exclude on edges. Every option is in Analyze Particles in ImageJ, explained.
- The equivalent diameter is not a column: add it in a spreadsheet as 2·SQRT(Area/PI()).
Pitfalls
- Comparing circularity across magnifications. The pixel staircase lowers circularity more for small particles. Compare only particles imaged at similar pixel sizes, or smooth first and say so.
- Calling AR "length/width". It is the ellipse ratio; for rods give Feret/MinFeret if you mean length over width.
- Reporting Round and AR as two findings. In ImageJ,
- Feret on cut particles. A particle cut by the image edge has a short Feret; use Exclude on edges.
- Merged particles. Two touching spheres give a Feret of about two diameters. Check the outlines, and watch for solidity below about 0.9.
- Thresholds move outlines. A darker or brighter threshold grows or shrinks every particle by a pixel or so all round: at 0.25 nm per pixel, that is 0.5 nm on every diameter. Keep one threshold method for a series.
Reporting it
Particle outlines were obtained in ImageJ 1.54f (Otsu threshold, holes filled, touching particles separated by watershed, particles touching the image edge excluded). For each particle we report the Feret diameter (maximum calliper distance), MinFeret, circularity (4π·area/perimeter²), aspect ratio (major/minor axis of the fitted ellipse) and solidity (area/convex hull area); n = 136 particles.
Give each descriptor with its definition the first time, its mean ± SD and n, and show the distribution (a histogram for size, a box plot for shape) rather than a mean alone.
ImageJ and Fiji go further where you need it: MorphoLibJ in Fiji adds geodesic diameter and 3D shape measures, and macros pool shape tables over hundreds of images.
An easier way: shape descriptors in LabCanvas
The same columns are measured in the browser by LabCanvas Image Analysis, with nothing to install and under the names ImageJ uses.
- Open the image; the scale comes from the file, or set it in Image › Scale.
- In Measure › Set measurements, tick Shape descriptors, Fit ellipse and Feret's diameter.
- In Count › Count particles, threshold the particles (Otsu, bright or dark), tick Fill holes, Separate touching objects (watershed) for round particles and Exclude particles on the edges, set a minimum size, and click Count.
- Send to Graphs with the Feret, Circ. or AR column for a histogram or a box plot.
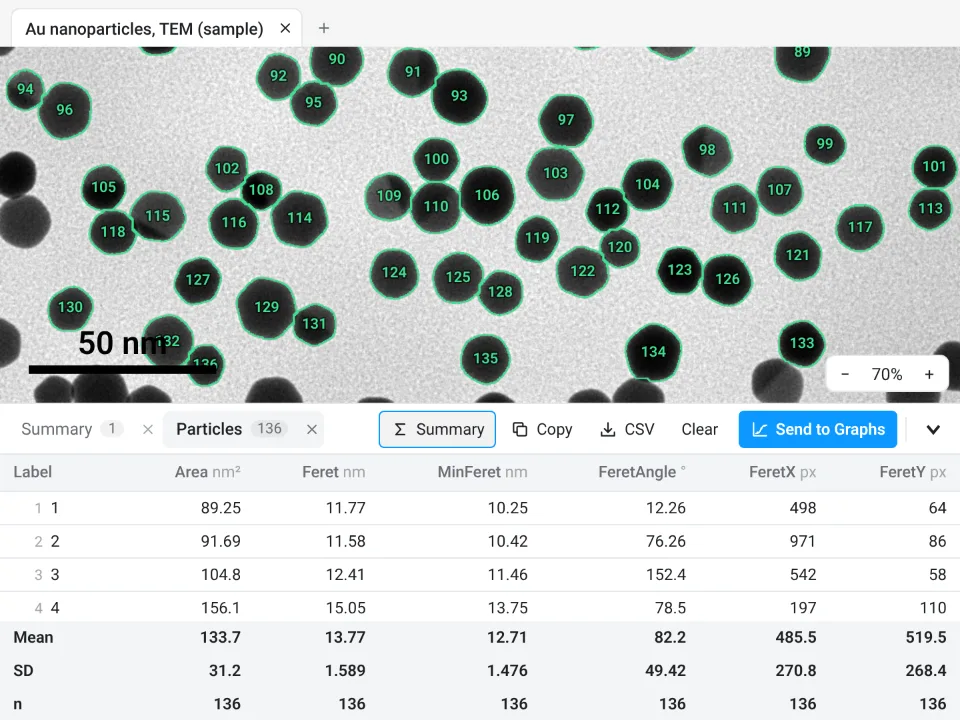
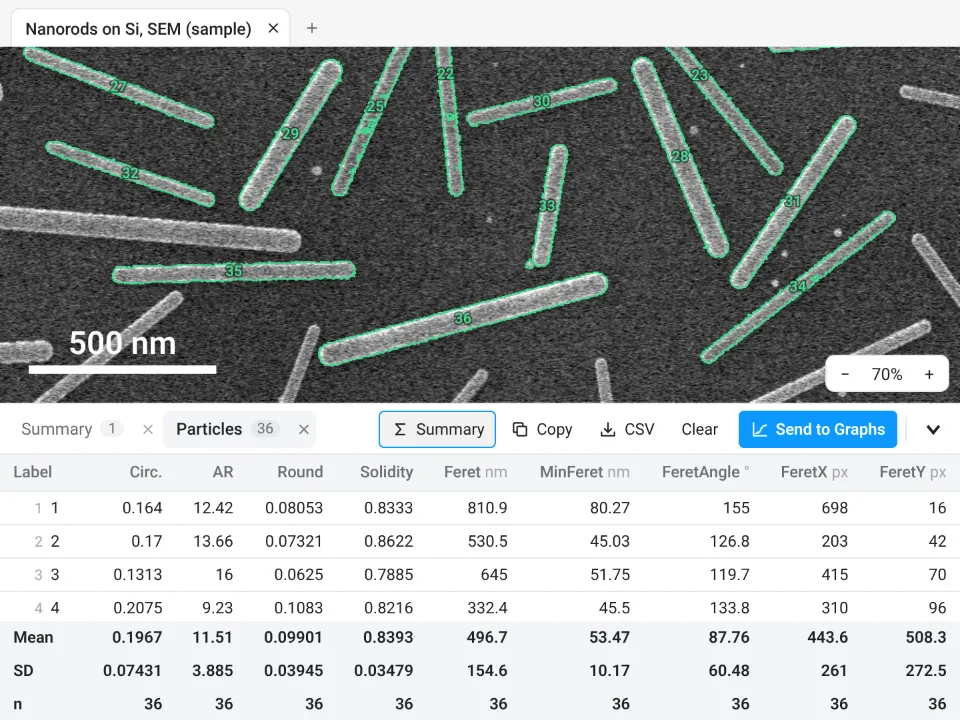
On the same two images it gives the same answers as ImageJ: 136 gold particles with a Feret diameter of 13.77 ± 1.589 nm (ImageJ: 13.777 ± 1.585 nm), and 36 rods, 496.7 ± 154.6 nm long and 53.47 ± 10.17 nm wide, AR 11.51 (its aspect ratio is the fitted-ellipse AR, like ImageJ's).
Why it is a good choice for particle shape:
- ImageJ's own columns: Perim., Circ., AR, Round, Solidity, Major, Minor, Angle, Feret, MinFeret, FeretAngle, FeretX and FeretY, with the same definitions, so your numbers stay comparable.
- Nothing to install: it runs in the browser on any computer or tablet.
- Distributions without a spreadsheet: Send to Graphs gives the histogram or box plot with descriptive statistics, and Summary adds mean, SD and n rows to the table.
- Checked: every measurement is validated against independent software in more than 4,000 automated tests.
- Free with a LabCanvas account; downloading CSV files is part of LabCanvas Pro.
It has no MorphoLibJ-style 3D or geodesic measures; for those, stay in Fiji. Open Image Analysis to measure your own particles. ImageJ and Fiji are independent open-source projects; LabCanvas is not affiliated with them.
References
- Schneider CA, Rasband WS, Eliceiri KW (2012). NIH Image to ImageJ: 25 years of image analysis. Nature Methods 9(7): 671–675. doi:10.1038/nmeth.2089
Frequently asked questions
What is the Feret diameter in ImageJ?
Feret's diameter is the longest distance between any two points on the outline of a particle, the opening of a calliper closed on it in its widest direction. ImageJ also gives MinFeret (the narrowest calliper width), FeretAngle (0–180°) and FeretX, FeretY (where the Feret line starts). Tick Feret's diameter in Analyze › Set Measurements to get them.
How does ImageJ calculate circularity?
What is solidity in ImageJ?
What is the difference between AR and Feret / MinFeret?
ImageJ's AR is Major / Minor of the fitted ellipse, not Feret / MinFeret. For smooth convex shapes they are close (a drawn rod: AR 5.825, Feret/MinFeret 5.93), but they can differ a lot: a square has AR 1.000 but Feret/MinFeret 1.414. Say which one you report.
What is the difference between roundness and circularity?
Which size should I report for nanoparticles: Feret or equivalent diameter?
Either, but name it. Feret is the largest dimension and suits faceted or slightly elongated particles; the equivalent circle diameter,
Try it in LabCanvas
Every app is free to start in your browser. Create an account and begin.
Start Image Analysis free in your browserKeep reading

ImageJ vs LabCanvas Image Analysis: an honest comparison
ImageJ/Fiji or LabCanvas Image Analysis? Six everyday jobs done in both, six newer ones (macros, vendor files, 3D, StarDist, big images) and which to use.

How to use ImageJ: a beginner's tutorial for the 10 everyday jobs (2026)
How to use ImageJ and Fiji: get started, open an image, then 10 everyday jobs (scale, measure, threshold, count, background, blots) with exact menu paths.

How to set the scale and add a scale bar in ImageJ (with a calibration image to practise on)
Set the scale in ImageJ (Analyze › Set Scale) from a micrometer, scale bar or pixel size, add a scale bar, and practise on a free calibration image.