Nanorod and nanowire length, width and aspect ratio from SEM images in ImageJ
Measure nanorod and nanowire length, width and aspect ratio from SEM images in ImageJ: Feret, MinFeret, fit ellipse, edge rods, and why not to watershed.
Contents
To measure nanorod or nanowire length, width and aspect ratio from an SEM image in ImageJ, check the scale (Image › Properties…), threshold the rods (Image › Adjust › Threshold…, Otsu, Dark background for bright rods), tick Feret's diameter, Fit ellipse and Shape descriptors in Analyze › Set Measurements…, then run Analyze › Analyze Particles… with a minimum size and Exclude on edges. Feret is each rod's length, MinFeret its width, and Feret ÷ MinFeret its aspect ratio. Do not use Watershed: it cuts rods into pieces.
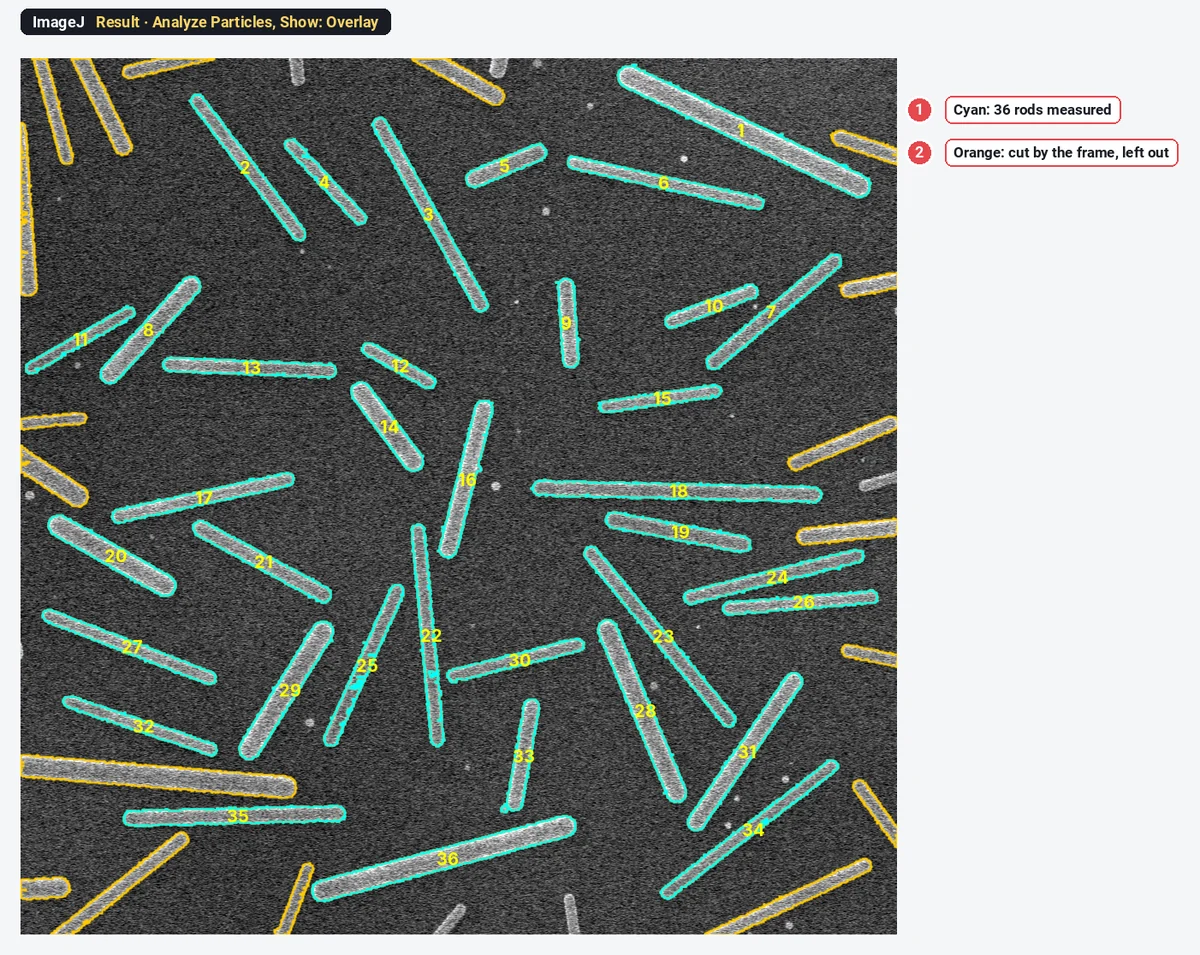
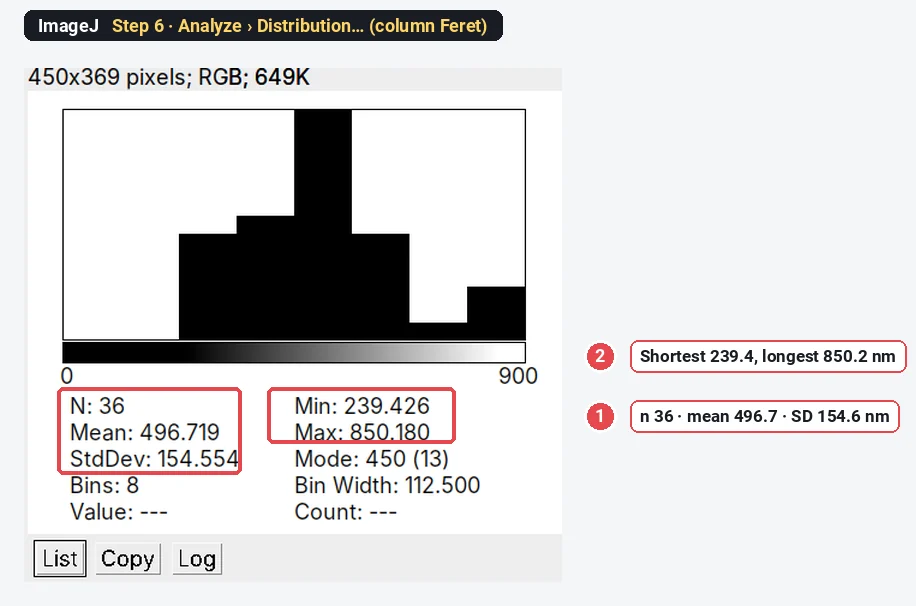
On the sample below ImageJ measures 36 rods: length 496.7 ± 154.6 nm, width 53.47 ± 10.17 nm. Every step has a screenshot of the window you will see.
What you need: ImageJ 1.x or Fiji (all commands are in both). An SEM (or TEM) image of rods or wires lying flat and mostly apart, ideally the microscope's TIFF with its pixel size. The example is a synthetic SEM image of nanorods on silicon, made for practice: 1024 × 1024 pixels at 2.5 nm per pixel, rods 200 to 800 nm long and 30 to 60 nm wide. Time: about 10 minutes.
Length, width and aspect ratio: which ImageJ columns?
| What you want | ImageJ column | Definition |
|---|---|---|
| Length | Feret | The longest distance between two points of the outline (maximum caliper) |
| Width (diameter) | MinFeret | The smallest caliper width |
| Aspect ratio | Feret ÷ MinFeret | Length over width, computed per rod |
| Ellipse aspect ratio | AR | Major ÷ minor axis of the fitted ellipse (Shape descriptors) |
| Ellipse axes | Major, Minor | Axes of the ellipse with the same area and second moments |
For a straight rod, Feret and MinFeret are what you would measure with calipers. The ellipse columns describe an ellipse with the same area and spread as the rod; because a rod is fuller at its ends than an ellipse, its fitted major axis is longer and its minor axis narrower than the rod itself, so AR reads higher than Feret ÷ MinFeret.
How do I measure nanorods in ImageJ? Step by step
Step 1: Open the image and check the scale
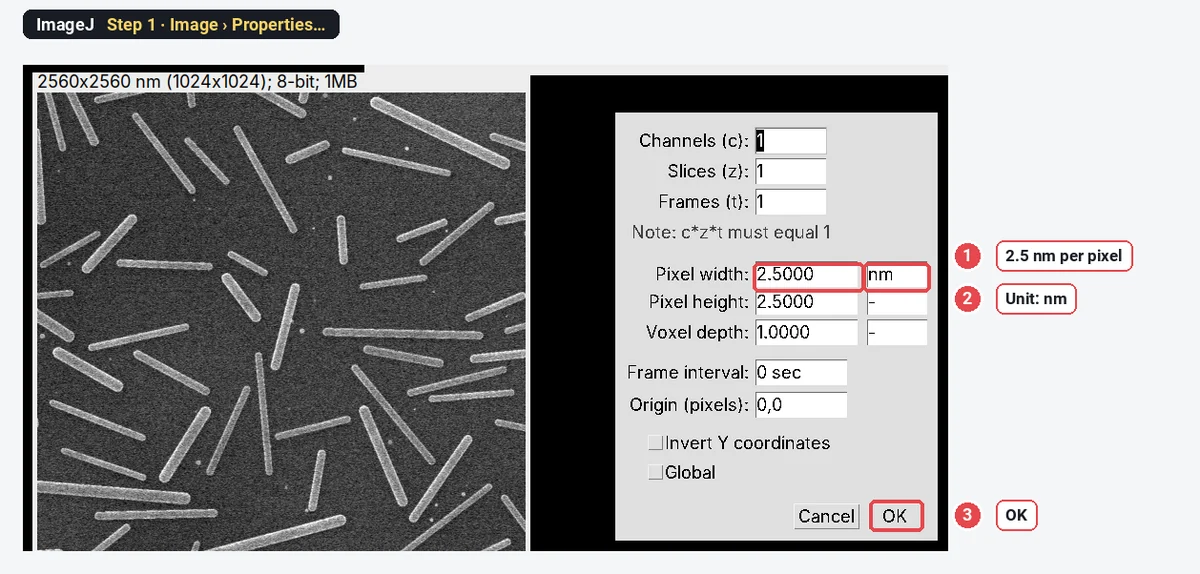
Open the file (File › Open…) and choose Image › Properties…. If the microscope wrote the pixel size into the file, it is here: Pixel width 2.5 nm on this sample. If the unit says "pixel", set the scale from the scale bar with Analyze › Set Scale… first (how to set the scale in ImageJ). Click OK.
Step 2: Threshold the rods
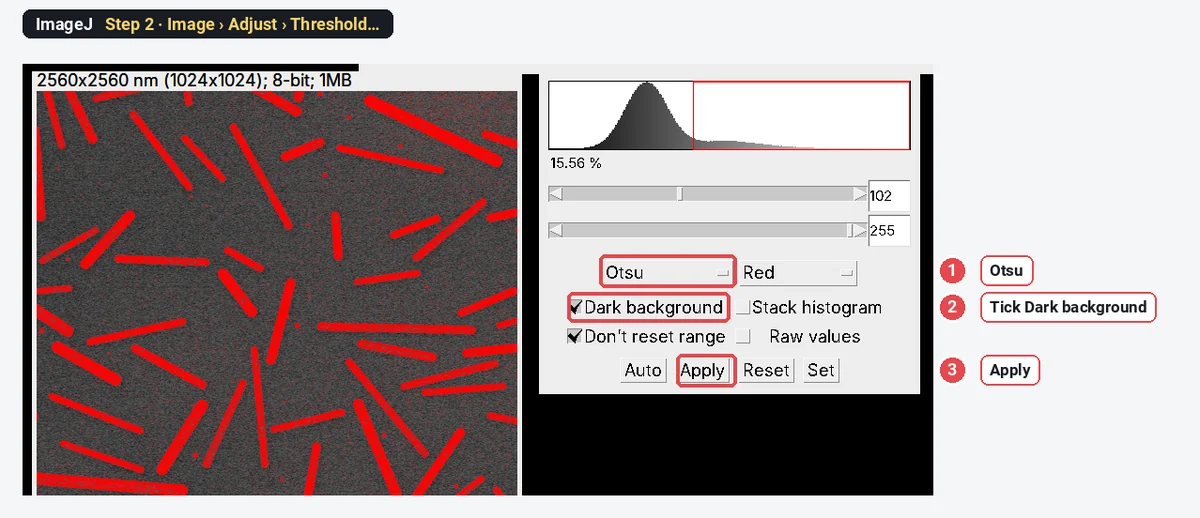
Open Image › Adjust › Threshold…, choose Otsu and tick Dark background (the rods are brighter than the silicon). The rods turn red. Click Apply to make a mask. Then run Process › Binary › Fill Holes, so a rod with a dim centre is measured whole.
Step 3: Choose the measurements
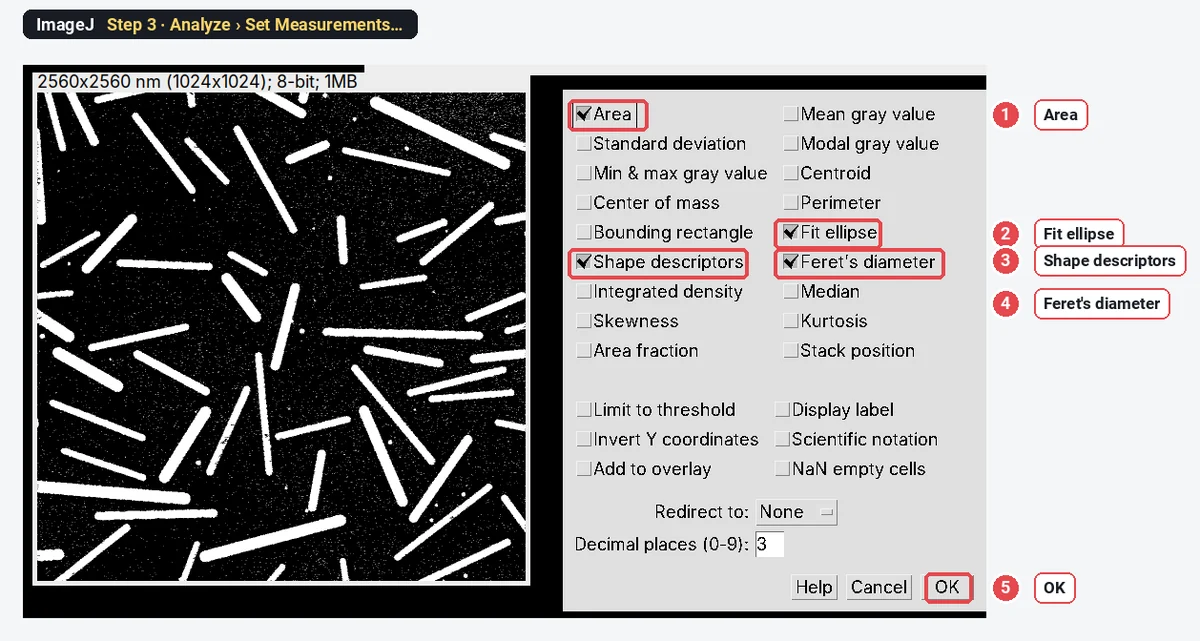
Open Analyze › Set Measurements… and tick Area, Fit ellipse, Shape descriptors and Feret's diameter. Click OK. ImageJ remembers this for the next runs.
Step 4: Analyze Particles
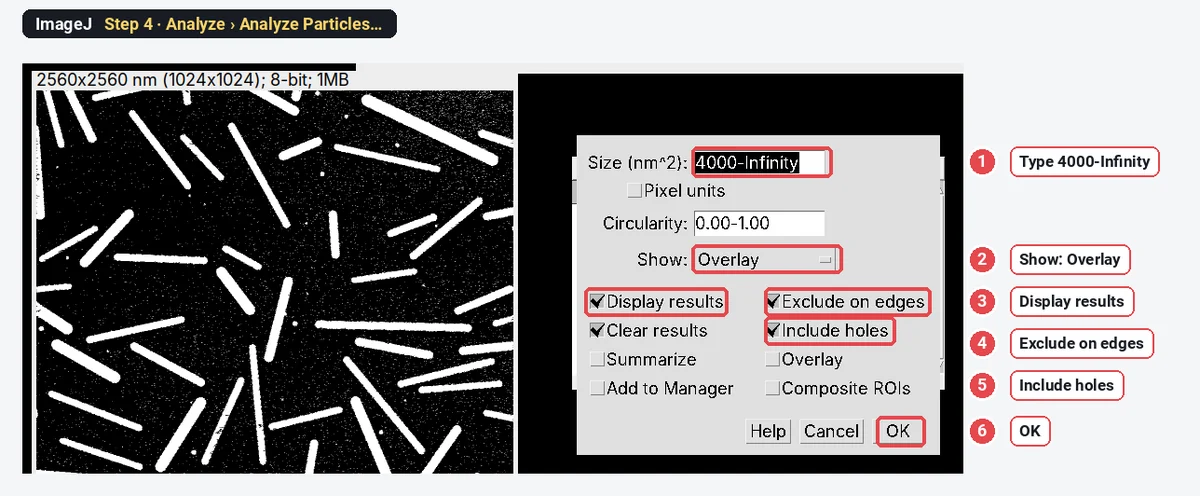
Choose Analyze › Analyze Particles…. Type a size of 4000-Infinity (nm²) so noise specks are skipped; set Show to Overlay to see what was measured; tick Display results, Exclude on edges and Include holes. Click OK.
Step 5: Read Feret, MinFeret and AR
The Results table has one row per rod. Feret is the length, MinFeret the width, AR the ellipse aspect ratio. To add the plain length-over-width ratio as a column, run this one-line macro (Plugins › New › Macro, paste, Run):
for (i = 0; i < nResults; i++) setResult("L/W", i, getResult("Feret", i) / getResult("MinFeret", i));
updateResults();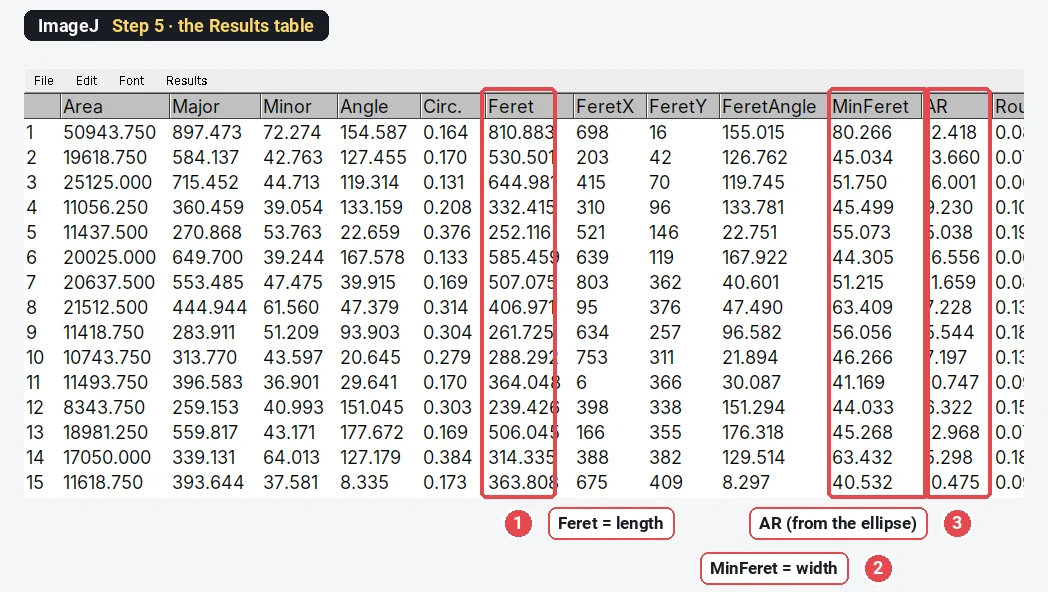
Step 6: Make the length histogram
Choose Analyze › Distribution…, pick Feret and click OK. The window gives the histogram with n, mean, SD, minimum and maximum. Do the same with MinFeret for the widths.
Step 7: Measure crossing wires with the straight line tool
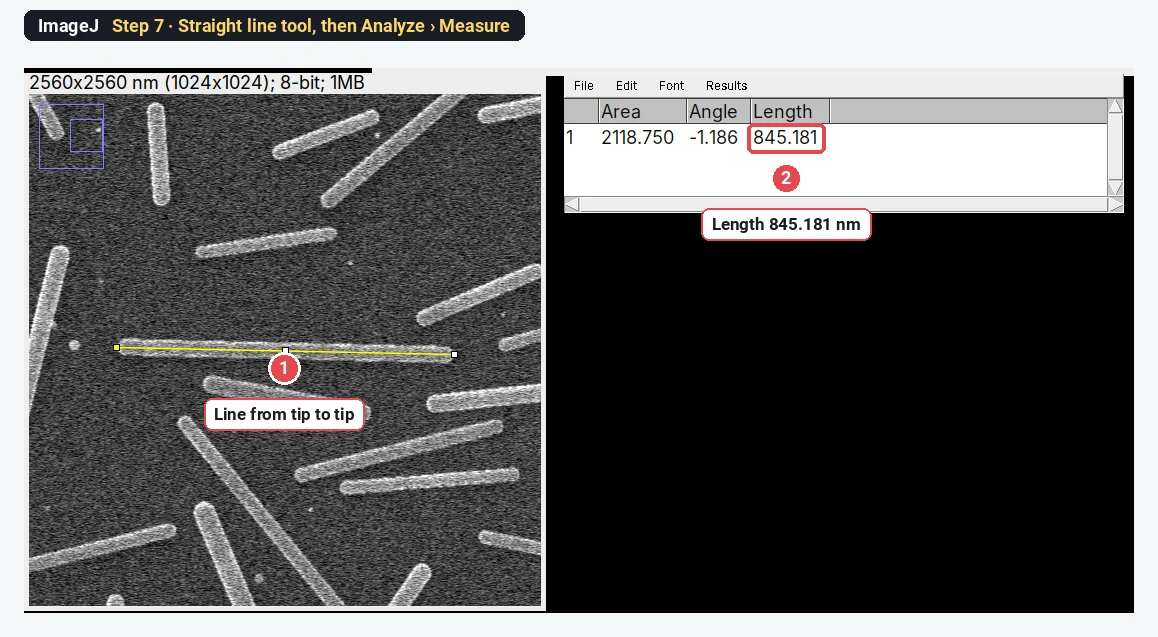
Analyze Particles cannot measure two wires that cross: it sees one X-shaped particle. Measure those by hand. Choose the Straight line tool, zoom in, click on one tip and drag to the other, then press Analyze › Measure (Ctrl M). The Length column is the wire's length in nm. This sample's crossings all lie outside the frame, so the picture shows a single rod: the line gives 845.2 nm, where Analyze Particles gave a Feret of 850.2 nm for the same rod.
The result on the sample
| Measure (36 rods) | Mean ± SD |
|---|---|
| Length (Feret) | 496.7 ± 154.6 nm |
| Width (MinFeret) | 53.47 ± 10.17 nm |
| Aspect ratio, Feret ÷ MinFeret | 9.50 ± 3.06 |
| Aspect ratio, AR (fitted ellipse) | 11.51 ± 3.885 |
The rods were drawn 200 to 800 nm long (plus their rounded caps) and 30 to 60 nm wide, about 43 nm on average. The measured widths come out roughly 10 nm wider: the bright SEM edge and the blur of the image both widen the thresholded outline by a pixel or two on each side. For thin wires only a few pixels wide, that matters: measure the width from a line profile across the wire instead (Analyze › Plot Profile, width at half the maximum) or image at higher magnification.
Why not use Watershed on nanorods?
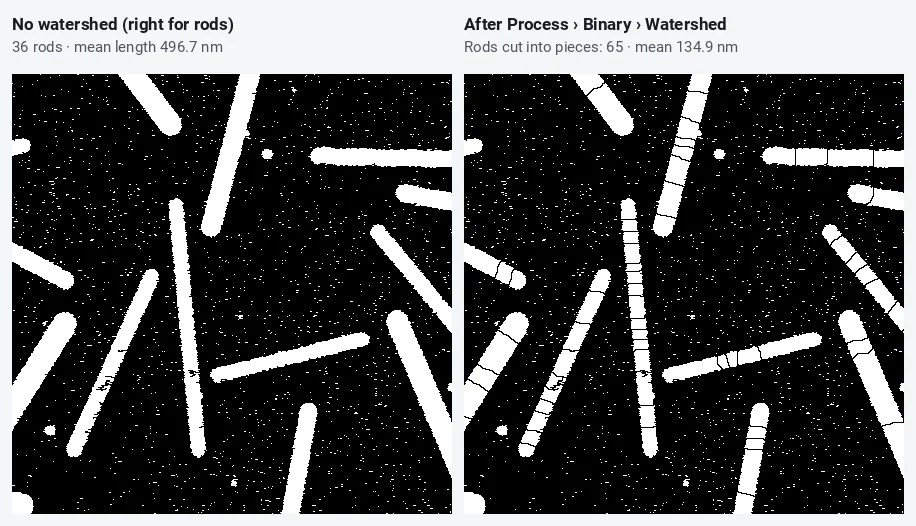
Watershed separates touching round particles by cutting at narrow waists. A long rod with slightly rough edges has many small waists, and Watershed cuts at all of them. It is right for touching spheres (watershed for touching particles) and wrong for rods and wires. If two rods touch end to end or cross, separate them by hand: draw a black line with the pencil tool on the mask, or measure them with the line tool as in Step 7.
Why exclude rods that touch the edge?
A rod cut by the frame is measured shorter than it is. Long rods are more likely to touch the edge, so including them drags the mean down twice over. On the sample, without Exclude on edges, ImageJ finds 54 particles with a mean length of 438.9 nm, against 496.7 nm for the 36 whole rods. If too few whole rods remain, image at a lower magnification so more of each rod fits in the frame.
Pitfalls
- Specks counted as rods. A noisy SEM image gives thousands of one-pixel specks above the threshold. The minimum size (4000 nm² here, smaller than the smallest real rod) drops them; check the overlay.
- Bundles and crossings. Two rods side by side become one wide particle: MinFeret doubles and the aspect ratio halves. Look for outliers in MinFeret and check them on the image.
- Curved wires. Feret is the straight distance between the farthest points, which underestimates a bent wire's length. Skeletonize the mask (Process › Binary › Skeletonize) and measure the skeleton length, or trace the wire with the segmented line tool.
- Charging and edge brightness. SEM edges are brighter than the middle of a wire (edge effect); a threshold on a bright edge can leave a hollow outline. Fill Holes fixes it.
- Wrong scale. A TIFF re-saved by another program can lose its pixel size. Check Image › Properties every time.
- Too few rods. 36 rods give a mean, but the SD of a broad distribution needs a few hundred. Measure several images and pool them.
Reporting it
Nanorod dimensions were measured in [Fiji (ImageJ 1.54)] on [n] SEM images ([2.5] nm per pixel). Rods were segmented with the Otsu threshold, holes filled, and analysed with Analyze Particles (≥ [4000] nm², rods touching the image border excluded, no watershed). Length was taken as the Feret diameter and width as the minimum Feret diameter; the aspect ratio was the length divided by the width for each rod. [N] rods were measured: length [496.7 ± 154.6] nm, width [53.5 ± 10.2] nm (mean ± SD).
Show the lengths as a histogram, the widths as a second one, and give the number of rods.
Switch to LabCanvas: rod length and width in a few clicks
The same measurement runs in LabCanvas Image Analysis in the browser, with nothing to install.
- Open the SEM TIFF; the pixel size is read from the file.
- In Set measurements, tick Shape descriptors and Feret's diameter.
- In the Count tab › Count particles: threshold Otsu, bright objects, Fill holes, no watershed, exclude particles on the edges, a minimum size, then Count.
- Click Send to Graphs on the Particles table for the length and width histograms.
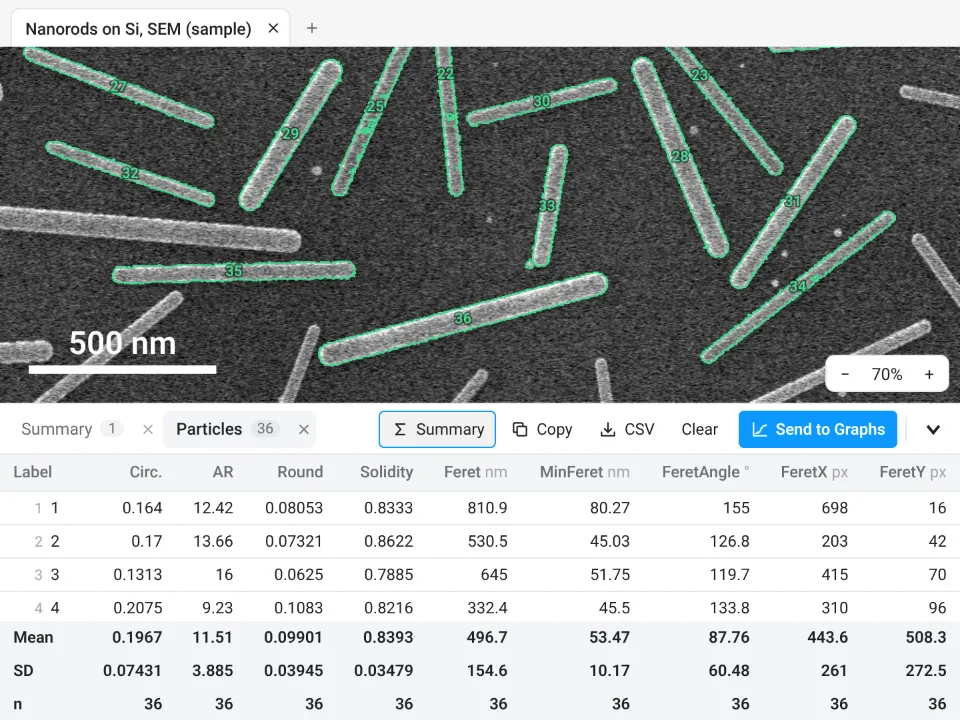
On the same image, LabCanvas measures 36 nanorods: length 496.7 ± 154.6 nm (Feret), width 53.47 ± 10.17 nm (MinFeret), aspect ratio 11.51 ± 3.885, exactly what ImageJ gives with the steps above. That aspect ratio is the fitted-ellipse AR in both programs; Feret ÷ MinFeret is 9.50 ± 3.06.
Why switch for nanorods:
- No install: it runs in any browser, next to the microscope PC.
- ImageJ's own definitions: Feret, MinFeret and AR mean the same as in ImageJ, so the numbers match.
- Straight to Graphs: histograms, mean ± SD and a figure with the scale bar, with a methods sentence to copy.
Fiji stays better for curved wires (skeleton plugins), for microscope formats such as .dm3 or .emi (LabCanvas needs a TIFF), and for long batches through macros.
Open Image Analysis: free with a LabCanvas account (downloading CSV and image files is part of LabCanvas Pro). ImageJ and Fiji are independent open-source projects; LabCanvas is not affiliated with them.
References
- Schindelin J, Arganda-Carreras I, Frise E, et al. (2012). Fiji: an open-source platform for biological-image analysis. Nature Methods 9, 676–682. doi:10.1038/nmeth.2019
- Schneider CA, Rasband WS, Eliceiri KW (2012). NIH Image to ImageJ: 25 years of image analysis. Nature Methods 9, 671–675. doi:10.1038/nmeth.2089
Frequently asked questions
How do I measure nanowire length in ImageJ?
Check the scale (Image › Properties), threshold the wires (Image › Adjust › Threshold, Otsu, Dark background for bright wires on a dark substrate), tick Feret's diameter in Analyze › Set Measurements, and run Analyze › Analyze Particles with a minimum size and Exclude on edges. Feret is the length of each straight wire. For curved wires, skeletonize and measure the skeleton length instead.
How do I measure nanowire diameter from an SEM image?
MinFeret, the smallest caliper width, is the diameter of a straight wire or rod; it comes from the same Analyze Particles run when Feret's diameter is ticked. For a few wires, a straight line drawn across each wire and Plot Profile (the width at half the maximum) is more exact, especially for thin wires only a few pixels wide.
How do I calculate the aspect ratio of nanorods in ImageJ?
Divide Feret (length) by MinFeret (width) for each rod. ImageJ also has an AR column (from Shape descriptors), but that is the major ÷ minor axis of the fitted ellipse, which comes out higher for rods: 11.51 against 9.50 for Feret ÷ MinFeret on our sample. Say which one you report.
Why should I not use Watershed on nanowires?
Watershed splits objects at narrow necks, and a long thin rod has noise-made necks all along it. On our sample, Watershed cut 36 rods into 65 pieces with a mean length of 134.9 nm instead of 496.7 nm. Separate touching or crossing wires by hand instead.
How do I measure crossing or overlapping nanowires?
Analyze Particles sees two crossing wires as one X-shaped particle, whose Feret is neither wire's length. Measure each crossing wire by hand: choose the straight line tool, draw from tip to tip, and press Analyze › Measure; the Length column is the wire's length. Or leave the crossings out and say so.
Why exclude rods that touch the image edge?
A rod cut by the frame looks shorter than it is, so including it biases the mean length down, and long rods are cut more often than short ones. On our sample, counting edge rods gave 54 particles with a mean length of 438.9 nm instead of 36 rods at 496.7 nm.
Try it in LabCanvas
Every app is free to start in your browser. Create an account and begin.
Start Image Analysis free in your browserKeep reading

ImageJ vs LabCanvas Image Analysis: an honest comparison
ImageJ/Fiji or LabCanvas Image Analysis? Six everyday jobs done in both, six newer ones (macros, vendor files, 3D, StarDist, big images) and which to use.

How to use ImageJ: a beginner's tutorial for the 10 everyday jobs (2026)
How to use ImageJ and Fiji: get started, open an image, then 10 everyday jobs (scale, measure, threshold, count, background, blots) with exact menu paths.

How to set the scale and add a scale bar in ImageJ (with a calibration image to practise on)
Set the scale in ImageJ (Analyze › Set Scale) from a micrometer, scale bar or pixel size, add a scale bar, and practise on a free calibration image.