Count γH2AX or 53BP1 foci per nucleus in ImageJ (Find Maxima, step by step)
Count γH2AX or 53BP1 foci per nucleus in ImageJ: nuclei as ROIs, Find Maxima with the right prominence, counts per nucleus and % of cells with ≥5 foci.
Contents
To count γH2AX or 53BP1 foci per nucleus in ImageJ, make one ROI per nucleus from the DAPI channel (Image › Adjust › Threshold…, then Analyze › Analyze Particles… with Add to Manager), run Process › Find Maxima… on the foci channel with a Prominence that marks every focus once, output Single Points, divide that image by 255 (Process › Math › Divide…) and click Measure in the ROI Manager: the RawIntDen column is the number of foci in each nucleus. The share of nuclei with 5 or more foci then takes one line of macro.
Find Maxima finds every local peak that stands out from its surroundings by more than the prominence, so the whole method stands or falls on that one number. This guide shows how to choose it.
What you need: ImageJ 1.x or Fiji (all commands are in both). A two-channel image: nuclei (DAPI or Hoechst) and foci (γH2AX, 53BP1, RAD51 or similar). The example is a synthetic DNA-damage image made for practice: 512 × 512 pixels at 0.2 µm per pixel, 30 nuclei (three pairs touching) with 199 foci in all, 0 to 14 per nucleus. Time: about 15 minutes.
What is a focus, and what does Find Maxima count?
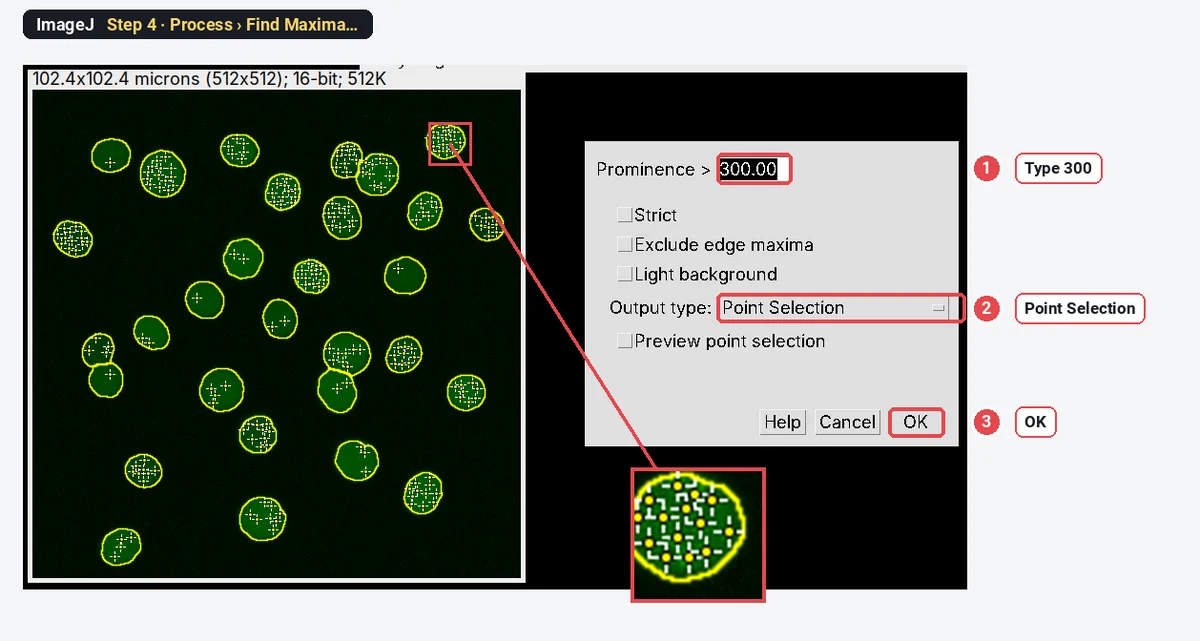
A focus is a small bright spot of a repair protein at a DNA break, about 0.3 to 1 µm across. Find Maxima puts a point on every pixel that is higher than its neighbours and stands out by at least the prominence: the drop you would have to walk down from the peak before you could climb to a higher one. Noise makes many tiny peaks with a small prominence; a real focus is a tall one. So a prominence between the two separates them.
How do I count foci per nucleus in ImageJ? Step by step
Step 1: Open the image and split the channels
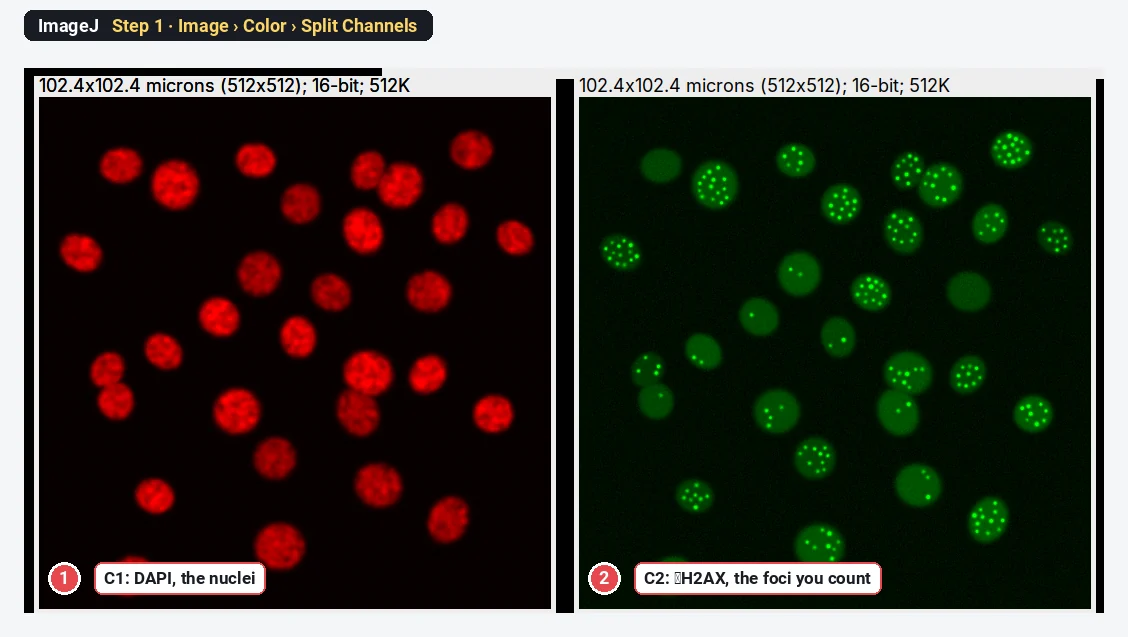
Open the file with File › Open…, then choose Image › Color › Split Channels. C1 holds the nuclei, C2 the foci. For viewing only, Image › Adjust › Brightness/Contrast… › Auto makes the foci easier to see; it does not change the pixel values.
Step 2: Threshold the nuclei
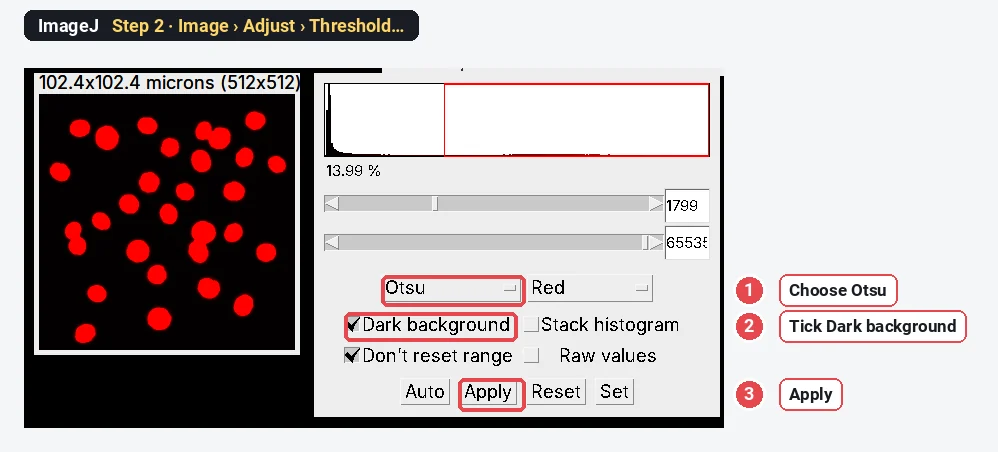
Click C1, make a copy with Image › Duplicate… and blur it with Process › Filters › Gaussian Blur… (Sigma 2) so each nucleus becomes one smooth blob. Open Image › Adjust › Threshold…, choose Otsu, tick Dark background and click Apply.
Step 3: Make one ROI per nucleus
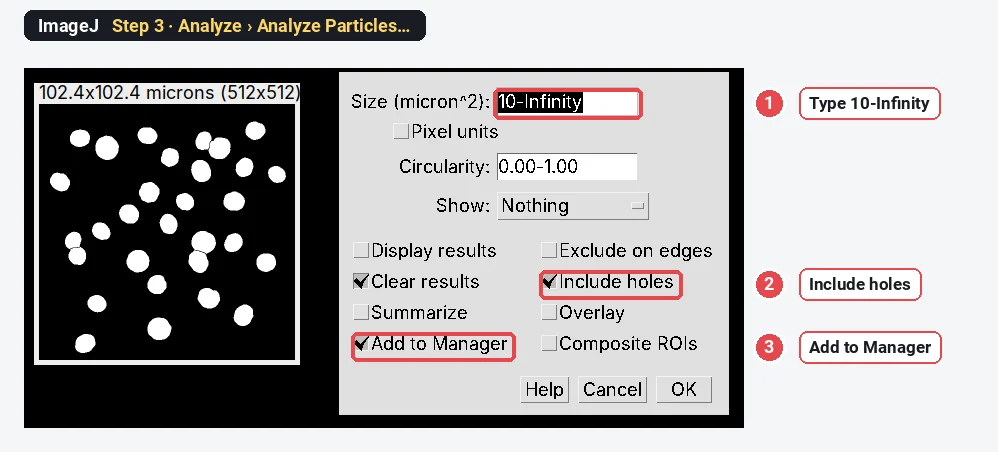
On the mask, run Process › Binary › Fill Holes and Process › Binary › Watershed (it splits the touching pairs). Then Analyze › Analyze Particles… with a size of 10-Infinity (µm²), Include holes and Add to Manager ticked. The ROI Manager now holds 30 nuclei. If some nuclei touch the image edge, tick Exclude on edges too, so half nuclei are not counted.
Step 4: Find the foci and choose the prominence
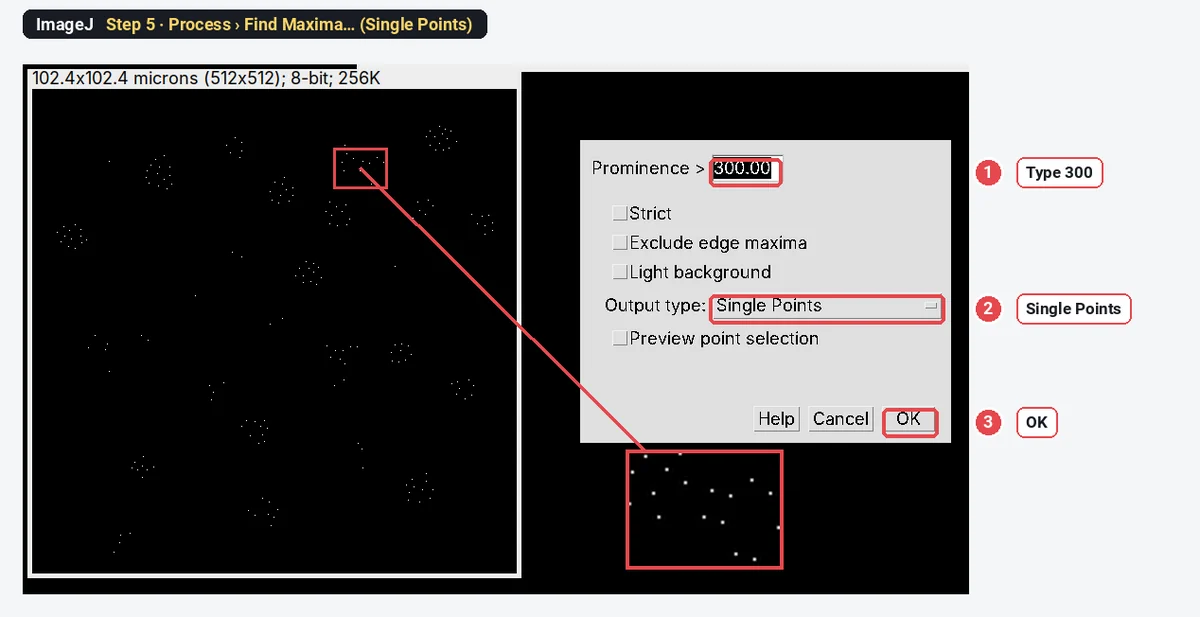
Click C2. Choose Process › Find Maxima…, type a Prominence (start with 300 for a 16-bit image like this one), set Output type to Point Selection and click OK. A small cross appears on every peak. Zoom in on a few nuclei: every focus should have one cross and the nuclear background none. If noise gets crosses, raise the prominence; if dim foci are missed, lower it. Preview point selection shows the crosses while you type.
Step 5: Turn the foci into a points image
Run Process › Find Maxima… again with the same prominence, but set Output type to Single Points and click OK. ImageJ makes a new black image, "C2 Maxima", with one white pixel (value 255) at each focus.
Step 6: Make each point worth 1
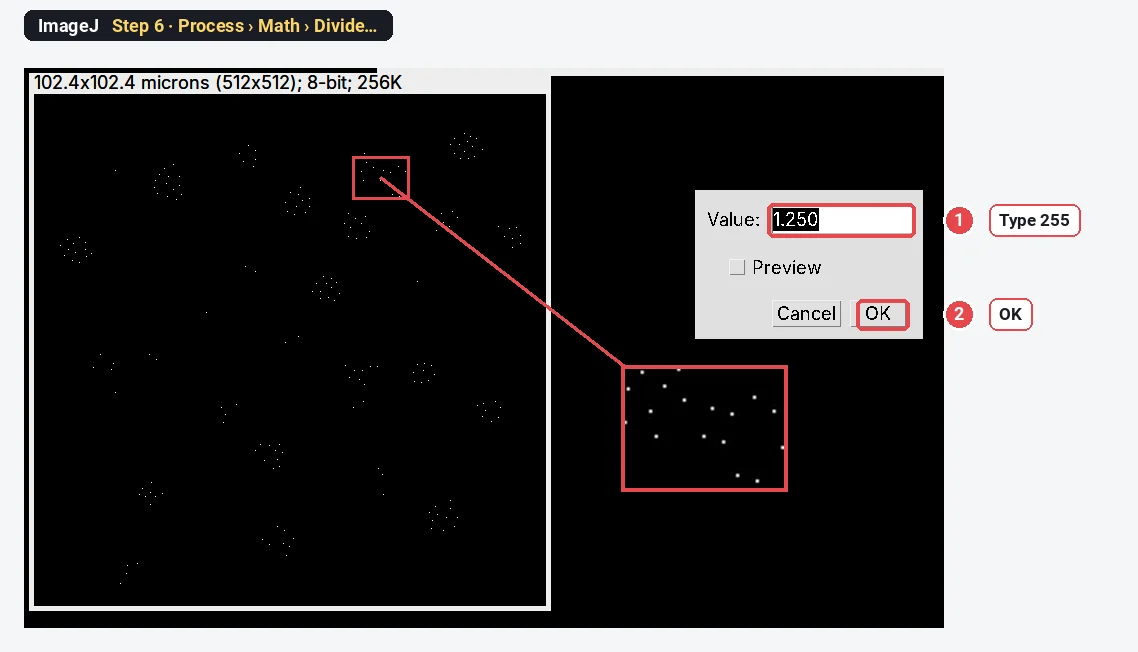
With the points image selected, choose Process › Math › Divide…, type 255 and click OK. Every focus pixel now has the value 1, so the sum of the pixels inside a nucleus is its number of foci.
Step 7: Measure every nucleus
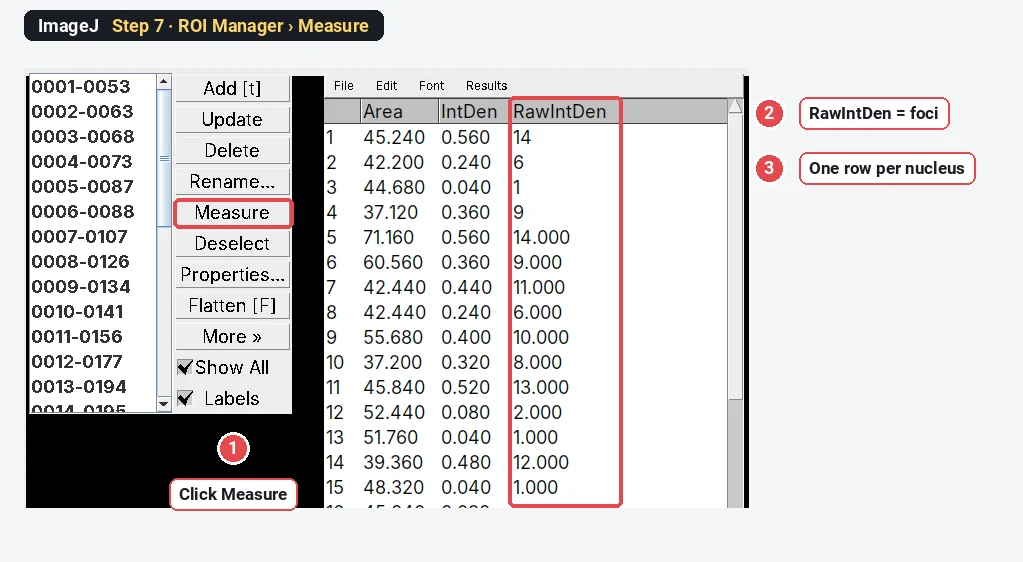
Tick Integrated density in Analyze › Set Measurements… (Area too, if you like). Keep the points image selected, click Deselect in the ROI Manager so that all ROIs are used, then click Measure. One row per nucleus appears; RawIntDen (the plain sum of the pixel values) is the foci count. (IntDen is the same sum times the pixel area, so ignore it here.)
To get the share of positive nuclei, run this after Step 7 (Plugins › New › Macro, paste, Run):
// Share of nuclei with at least "cutoff" foci, from the RawIntDen column
cutoff = 5;
pos = 0;
for (i = 0; i < nResults; i++)
  if (getResult("RawIntDen", i) >= cutoff) pos++;
print(pos + " of " + nResults + " nuclei have " + cutoff + " or more foci (" + d2s(100 * pos / nResults, 1) + "%)");
The result on the sample
Analyze › Distribution… on the RawIntDen column gives the summary:
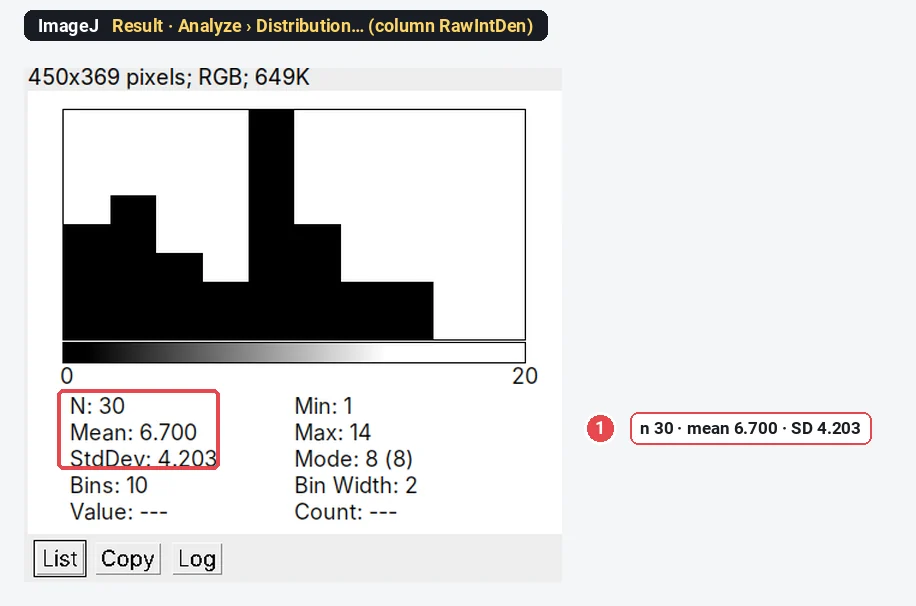
ImageJ counts 201 foci in 30 nuclei: 6.70 ± 4.20 per nucleus, and the macro reports 18 of 30 nuclei (60.0%) with 5 or more. The image was made with 199 foci (6.63 ± 4.30 per nucleus, 18 nuclei with 5 or more), and 28 of the 30 nuclei are counted exactly; the two that are off by one are the two nuclei with no foci at all, where the highest noise peak just passes the prominence. Nuclei without foci are where false points show first, so check a few of them by eye.
How do I choose the prominence?
Run Find Maxima at a few values and watch the count. On this sample:
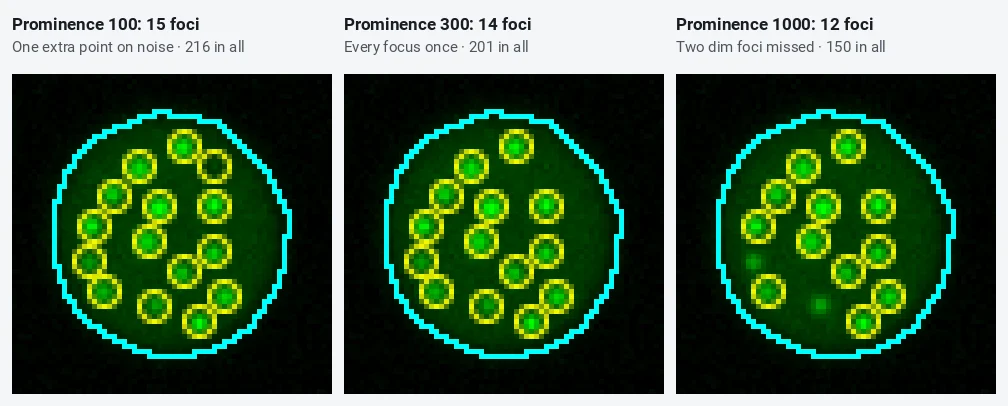
| Prominence | Foci in 30 nuclei | Nuclei counted exactly (of 30) |
|---|---|---|
| 100 | 216 | 18 |
| 200 | 201 | 28 |
| 300 | 201 | 28 |
| 400 | 201 | 28 |
| 600 | 198 | 29 |
| 1000 | 150 | 8 |
The count is flat from 200 to 600: that plateau is where you want to be, because small changes in the setting (or in the image) then barely move the result. Below it noise peaks creep in; above it the dimmest foci drop out. Find the plateau on a few images from your control and your strongest condition, pick a value in the middle, and keep it for the whole experiment. The prominence is in the image's own grey values, so a 16-bit image needs a much larger number than an 8-bit one.
Pitfalls
- A prominence chosen per image. It makes each image its own experiment. Fix it once.
- Foci in the background. Find Maxima finds peaks everywhere, but only points inside the nuclear ROIs are counted. Make sure the nuclear mask covers the whole nucleus (Fill Holes, Include holes).
- Merged foci. Foci closer than their own width count as one. At high doses, report the total γH2AX intensity per nucleus (Mean or RawIntDen of the raw C2 channel) as well as counts.
- Saturated foci. Clipped peaks are flat on top and can split into two maxima or merge. Check the histogram before you count.
- Pan-nuclear staining. Apoptotic and some S-phase cells stain the whole nucleus with γH2AX; they have few distinct maxima but are not undamaged. Flag them by their mean intensity and leave them out or report them apart.
- Comparing different exposures. The prominence is in grey values; images taken with different exposure or gain need the same settings to be comparable.
- Projections. A maximum projection of a z-stack merges foci at different depths; say so if you count on one.
Reporting it
Foci were counted in [Fiji (ImageJ 1.54)]. Nuclei were segmented from the DAPI channel (Gaussian blur σ = 2 pixels, Otsu threshold, watershed, objects ≥ 10 µm²). [γH2AX] foci were detected with Find Maxima (prominence [300]) on the raw [γH2AX] channel, and the maxima within each nucleus were counted. Cells with ≥ [5] foci were scored positive; the cut-off was set on untreated controls. [n] nuclei from [3] independent experiments per condition.
Show foci per nucleus as a dot plot or violin per condition, with the mean of each experiment marked, and the percentage of positive cells as a bar per experiment.
Switch to LabCanvas: foci per cell in a few clicks
The same count runs in LabCanvas Image Analysis in the browser, with no points image and no macro.
- Open your two-channel TIFF and go to the Assays tab › Spots per cell (or click Try it on a sample).
- Under Channels, pick the nuclear and the spot channel; under Nuclei, keep Otsu or adjust it.
- Under Spots, click Auto for the Prominence (6 × the noise) or type your own; add a rolling ball or a blur if needed.
- Under Count, choose the nucleus or the whole cell and the Spots for a positive cell, then click Add to results.
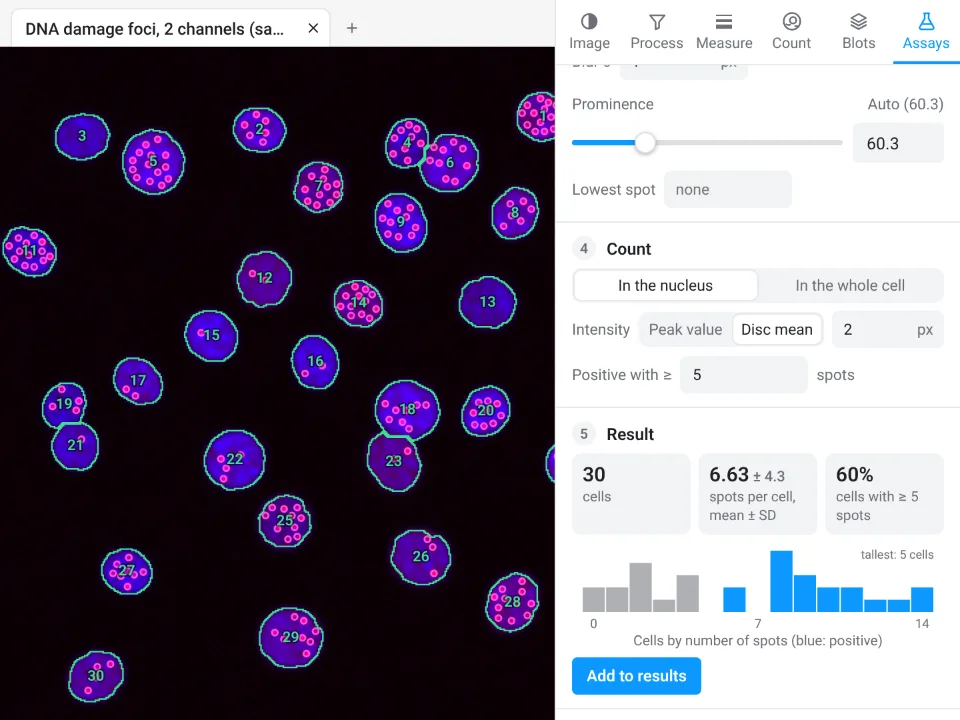
On the same synthetic image, LabCanvas finds 30 cells, 6.63 ± 4.3 spots per cell, 60% with 5 or more; ImageJ with the steps above gives 30 nuclei, 6.70 ± 4.20 foci, 60%.
Why switch for foci counting:
- One panel instead of seven steps: nuclei, spots, counts per cell and the positive share together, with every spot shown on the image.
- A prominence from the noise: Auto sets it from the image, the same rule for every image.
- Straight to Graphs: counts per cell to a graph with statistics, and a methods sentence to copy.
Fiji stays better for 3D foci counting in z-stacks and for long macros over thousands of images.
Open Image Analysis: free with a LabCanvas account (downloading CSV and image files is part of LabCanvas Pro). ImageJ and Fiji are independent open-source projects; LabCanvas is not affiliated with them.
References
- Schindelin J, Arganda-Carreras I, Frise E, et al. (2012). Fiji: an open-source platform for biological-image analysis. Nature Methods 9, 676–682. doi:10.1038/nmeth.2019
- Schneider CA, Rasband WS, Eliceiri KW (2012). NIH Image to ImageJ: 25 years of image analysis. Nature Methods 9, 671–675. doi:10.1038/nmeth.2089
Frequently asked questions
How do I count foci per nucleus in ImageJ?
Make one ROI per nucleus from the DAPI channel (threshold, Analyze Particles with Add to Manager). On the foci channel, run Process › Find Maxima with a prominence that puts one point on every focus and none on the background, output Single Points, divide that image by 255 so each point is worth 1, and click Measure in the ROI Manager with Integrated density ticked: RawIntDen is the number of foci in each nucleus.
What prominence should I use in Find Maxima?
Tick Preview point selection and raise the prominence until noise in the nucleus no longer gets points, while every focus you would count by eye still has one. Look for a range where the count stops changing: on our sample any prominence from 200 to 400 gave the same 201 foci, while 100 added noise points and 1000 lost dim foci. Then use the same value for every image of the experiment.
Should I blur or subtract the background before Find Maxima?
Only if you need to. A light Gaussian blur (sigma 1 pixel) evens out noise when foci are small and the image is noisy, and Subtract Background removes a bright, uneven nuclear haze. Both change the heights of the maxima, so choose the prominence after them, and do the same to every image.
How many γH2AX foci make a cell positive?
There is no universal number. Common cut-offs are 5 or 10 foci per nucleus, chosen from the untreated control so that only a few control cells pass. Report the cut-off, the mean foci per nucleus and the percentage of positive cells.
Why does Find Maxima count two foci as one?
Two foci closer than about their own width merge into one peak, and a prominence that is too high can also swallow the smaller one. Lower the prominence a little, avoid blurring, or image at higher magnification. Very dense foci (late time points, high doses) are better reported as total foci intensity per nucleus.
Can I count foci in 3D?
Find Maxima works on one plane. For a z-stack, either count on a maximum-intensity projection (Image › Stacks › Z Project), which can merge foci at different depths, or use a 3D tool in Fiji such as 3D Objects Counter or the 3D maxima finder of the 3D ImageJ Suite.
Try it in LabCanvas
Every app is free to start in your browser. Create an account and begin.
Start Image Analysis free in your browserKeep reading

ImageJ vs LabCanvas Image Analysis: an honest comparison
ImageJ/Fiji or LabCanvas Image Analysis? Six everyday jobs done in both, six newer ones (macros, vendor files, 3D, StarDist, big images) and which to use.

How to use ImageJ: a beginner's tutorial for the 10 everyday jobs (2026)
How to use ImageJ and Fiji: get started, open an image, then 10 everyday jobs (scale, measure, threshold, count, background, blots) with exact menu paths.

How to set the scale and add a scale bar in ImageJ (with a calibration image to practise on)
Set the scale in ImageJ (Analyze › Set Scale) from a micrometer, scale bar or pixel size, add a scale bar, and practise on a free calibration image.