Image integrity: what you may and may not do to microscopy and blot images
What journals allow when you adjust microscopy and blot images: linear whole-image changes, gamma disclosed, no cloning or selective edits, in ImageJ.
Contents
You may adjust the brightness and contrast of a microscopy or blot image if the change is linear, applied to the whole image and to its controls in the same way, and does not make any information disappear. You must disclose non-linear changes such as gamma, mark every splice, and keep the original file. You may never enhance, remove, move, copy or add a feature in one part of an image: that is falsification, whatever the reason.
What you need: ImageJ 1.x or Fiji (every command here is in both), and your original image. The example is a synthetic western blot (640 × 300 pixels, 16-bit, made for practice). Time: 10 minutes to read, a few minutes per figure after that.
The rules in one table
The wording below is from the guidelines the Journal of Cell Biology wrote and Rossner and Yamada (2004) explained, which many journals have since adopted, and from Cromey's (2010) twelve guidelines for scientific digital images.
| Operation | Allowed? | Condition |
|---|---|---|
| Brightness and contrast (linear) | Yes | Whole image, same for controls, no information lost |
| Gamma, curves, levels with a mid-point | Yes, disclosed | Say so in the figure legend |
| Cropping | Usually | Do not crop out what changes the meaning (a band, dead cells); journals may ask for the uncropped blot |
| Removing lanes and joining the rest | Yes, disclosed | A visible line at every join, stated in the legend; same gel only |
| Pseudo-colour (a LUT) | Yes, disclosed | Say which channel has which colour |
| Filters (smoothing, sharpening, background subtraction) | With care | Same for all images compared; name the filter and settings |
| Adjusting one region, one band or one panel | No | "No specific feature within an image may be enhanced, obscured, moved, removed, or introduced" |
| Clone stamp, healing brush, erasing a spot or a band | No | Falsification |
| Copying a band or a cell from elsewhere | No | Fabrication |
| Bands from different gels shown as one gel | No | Rerun the samples on one gel |
| Cells from several fields shown as one field | No | Unless marked with lines between the pieces |
| Enlarging an image (adding pixels) | No | Re-image at higher magnification |
| Saving the data as JPEG | Avoid | Use TIFF; JPEG changes pixel values |
Rossner and Yamada add a useful test for every change: "Is the image that results from this adjustment still an accurate representation of the original data?"
What do journals say?
The details differ between publishers, but the core is the same everywhere:
- Journal of Cell Biology (the guidelines quoted in Rossner and Yamada 2004): no feature may be enhanced, obscured, moved, removed or introduced; grouping images from different gels, fields or exposures must be made explicit with dividing lines and in the legend; brightness, contrast and colour balance changes are acceptable on the whole image if they do not obscure or eliminate information; non-linear adjustments such as gamma must be disclosed in the legend.
- Nature Portfolio ("Image integrity and standards"): processing such as brightness and contrast is appropriate only when applied equally across the entire image and to controls; contrast should not be adjusted so that data disappear; non-linear adjustments (for example gamma changes) and pseudo-colouring must be disclosed; re-arranged lanes must be clearly marked and stated in the legend; loading controls must be run on the same blot; and life-science papers must supply the unprocessed original images of gels and blots.
- PLOS journals: for manuscripts submitted since 1 July 2019, original, uncropped and minimally adjusted images of every blot and gel in the figures, with the loading order, samples and molecular weight markers labelled.
Read your target journal's own page before you submit: some ask for more (the raw blots as a supplementary file, the acquisition settings, a statement on image processing in the methods).
How to prepare a figure in ImageJ, step by step
This is the safe route for a blot or a micrograph. It changes only a copy, keeps the change linear and whole-image, and leaves a record.
Step 1: Work on a copy
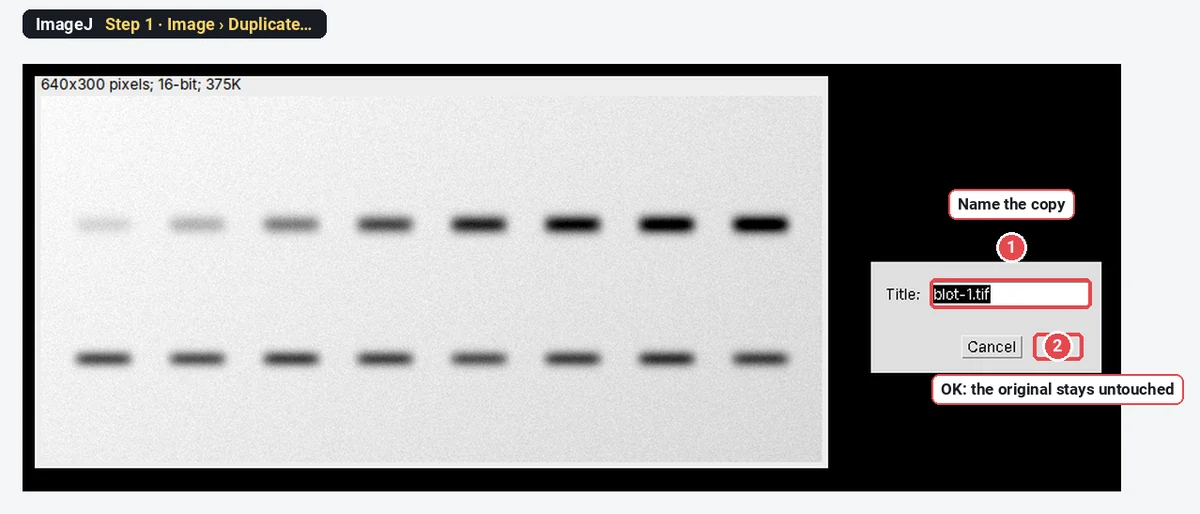
Open the original file (File › Open…). Then click Image › Duplicate…, give the copy a new name and click OK. Do everything below on the copy. The original never changes: it is the file you go back to, and the one an editor may ask for.
Step 2: Look at the histogram
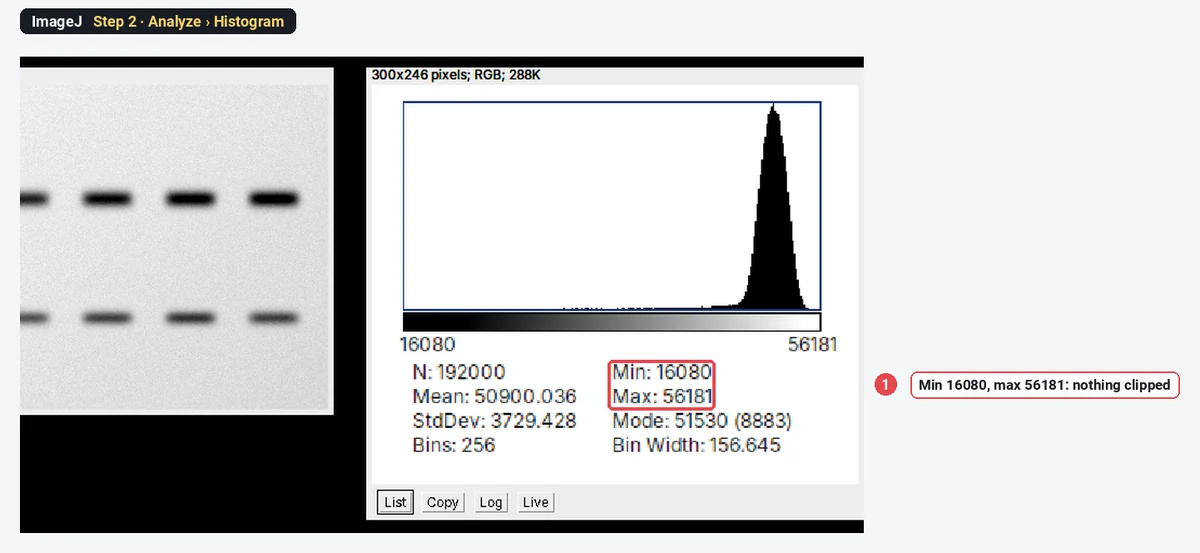
Click Analyze › Histogram. Check the Min and Max. A pile of pixels at 0, or at the top value (255 for 8-bit, 4095 for a 12-bit camera, 65535 for 16-bit), means the image was clipped when it was taken. Clipped pixels have lost their real value, and no adjustment can bring it back. Here the values run from 16080 to 56181: nothing is clipped.
Step 3: Set the display range with Brightness/Contrast
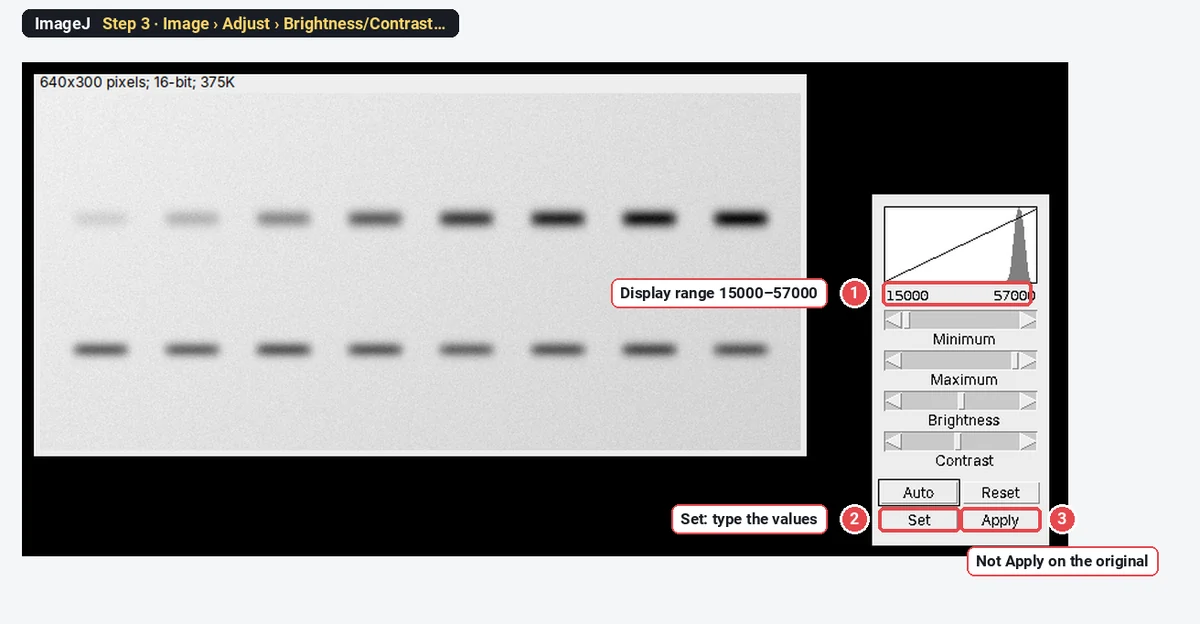
Click Image › Adjust › Brightness/Contrast…. Move the Minimum and Maximum sliders, or click Set and type the values, so that the faintest band is still visible and the background is not white. Here: 15000 and 57000, a little outside the darkest and brightest pixels, so nothing will clip.
So far only the display has changed; the pixel values are the same. Do not click Apply on the original: Apply rewrites the pixel values. And if a selection is active when you click Apply, ImageJ changes only the inside of the selection.
Step 4: Make the 8-bit figure copy
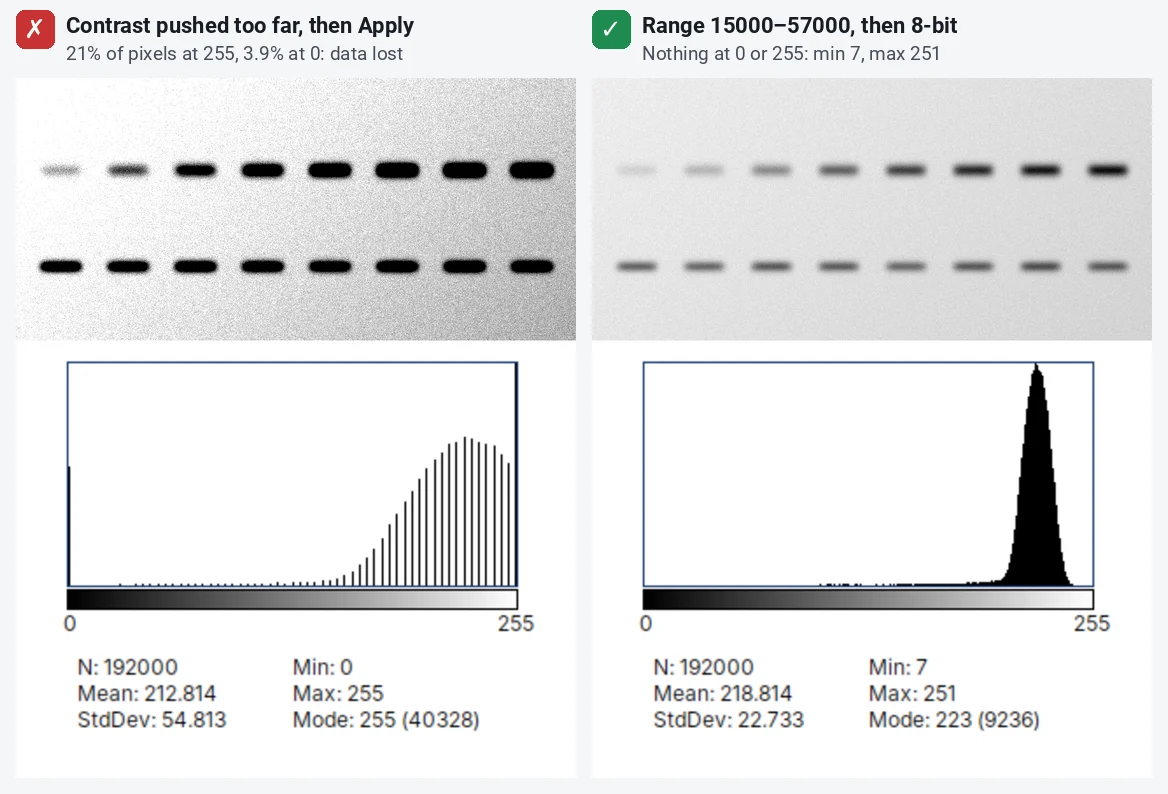
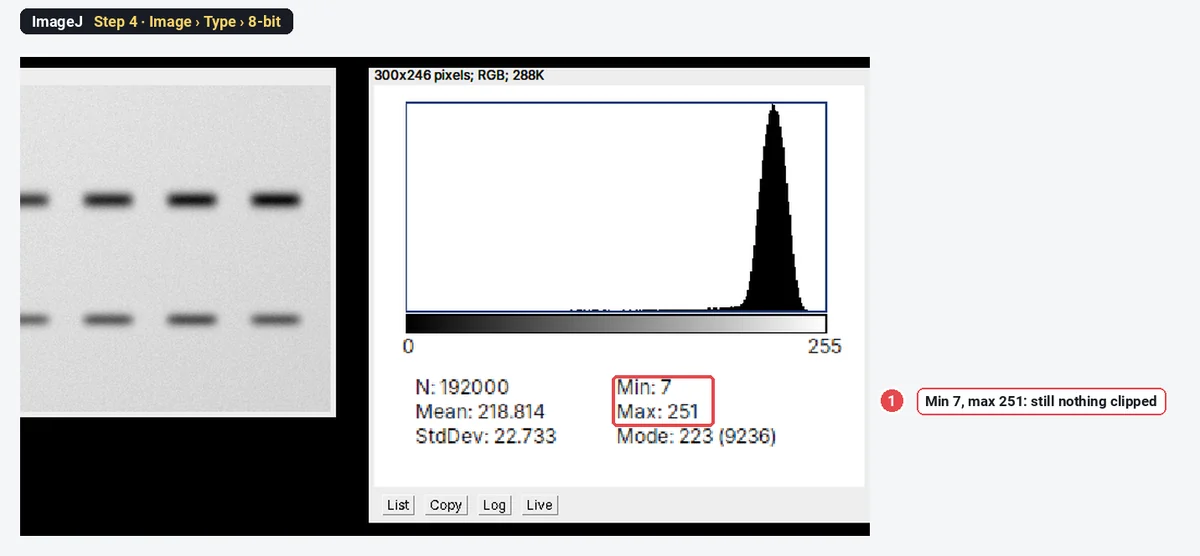
With no selection on the image (Edit › Selection › Select None), click Image › Type › 8-bit. ImageJ maps the display range linearly to 0–255: 15000 becomes 0, 57000 becomes 255, and every value in between is scaled by the same rule. The whole image is treated alike. Check the histogram again: here the 8-bit copy runs from 7 to 251, so still nothing is clipped.
Step 5: Crop with room to spare
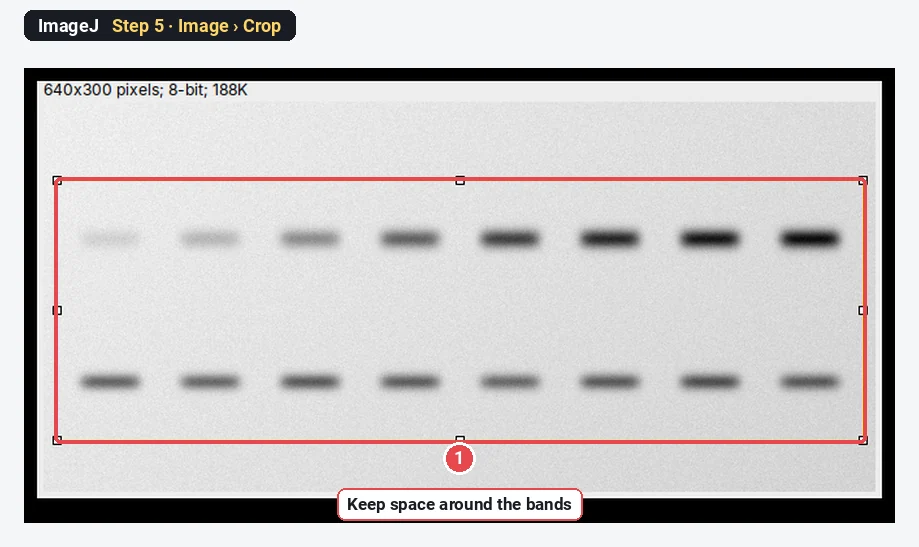
Draw a rectangle with the rectangle tool and click Image › Crop. Keep some space above and below the bands and all the lanes you discuss, with the molecular weight markers if you can. A blot cropped to a thin strip around one band hides everything else on the membrane, and editors know it.
Step 6: Save the copy as TIFF and keep both
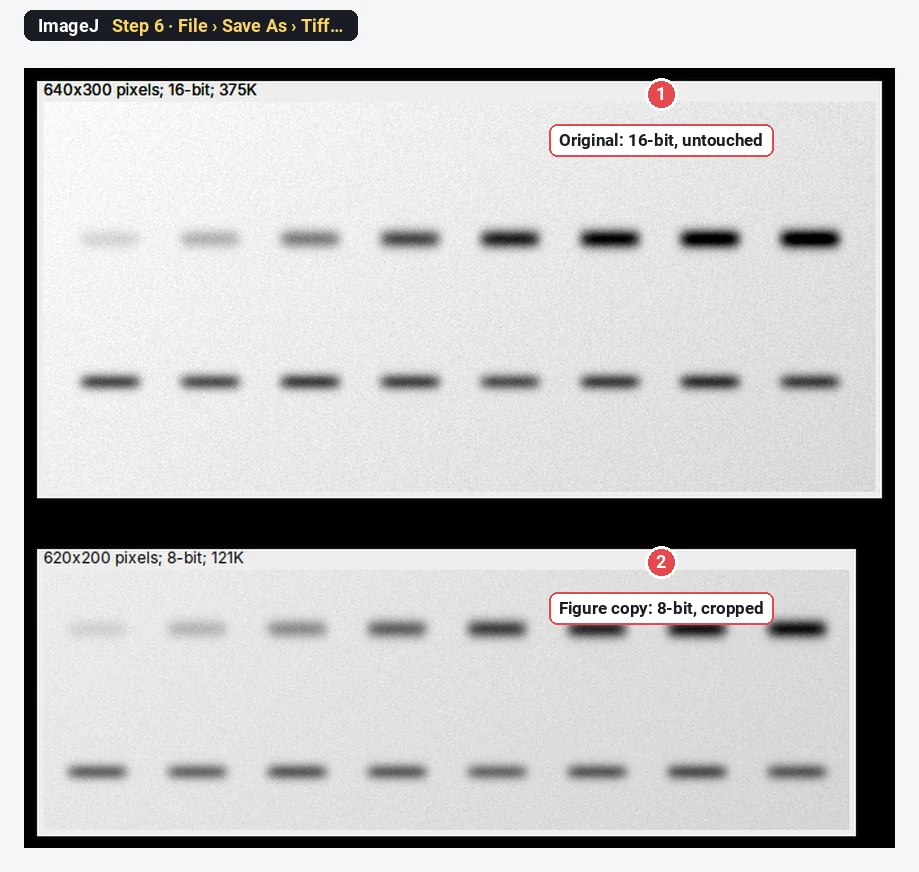
Click File › Save As › Tiff… and save the figure copy under a new name. Keep the original file exactly as it came from the imager, with its markers, next to the figure. Write down the display range (15000–57000), the crop and any other step; Plugins › Macros › Record… records the commands as you click them, which is the easiest way to keep that record.
What may I not do? Right and wrong, side by side
Adjusting one part of the image
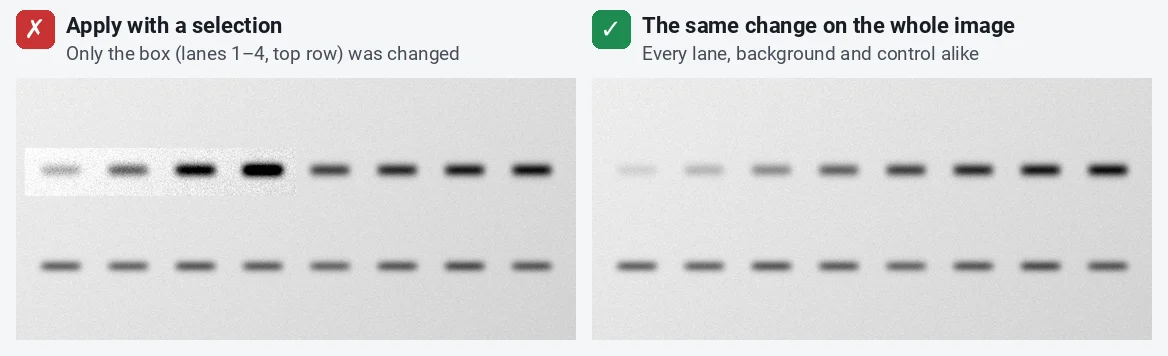
Rossner and Yamada call this a violation even when it does not change the conclusion. In ImageJ it happens easily: draw a rectangle, open Brightness/Contrast, click Apply, and only the selection changes. On the left, the top row of lanes 1–4 was "improved" that way; the box edge is plain to see, as it usually is to an editor.
Pushing the contrast until data disappear
Even applied to the whole image, contrast can go too far. On the left, a narrow display range was applied: 21% of the pixels became 255 and 3.9% became 0. The background is clean and every band looks equally strong, but the differences between the strong bands are gone. The gaps in that histogram are another sign of an over-stretched image. Rossner and Yamada point out that a background that drops out completely should make reviewers wonder what else dropped out with it.
Gamma: allowed, but say so
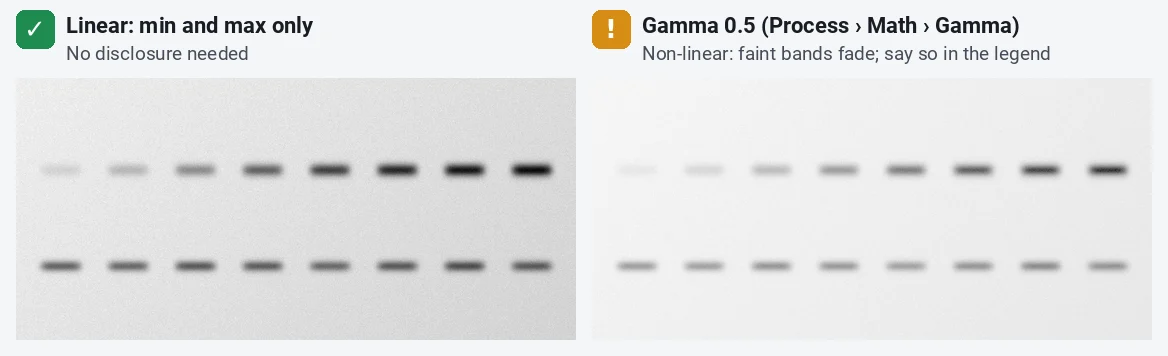
Process › Math › Gamma… raises every pixel value to a power. Unlike a linear stretch, it changes mid-tones more than the dark and bright values, so the relative strength of bands changes. On this blot, gamma 0.5 lightens everything and the faint bands nearly vanish. Gamma is sometimes the honest way to show dim and bright features in one panel, but it must be stated in the legend ("gamma 0.5 applied to the whole image").
Copying a band versus marking a splice
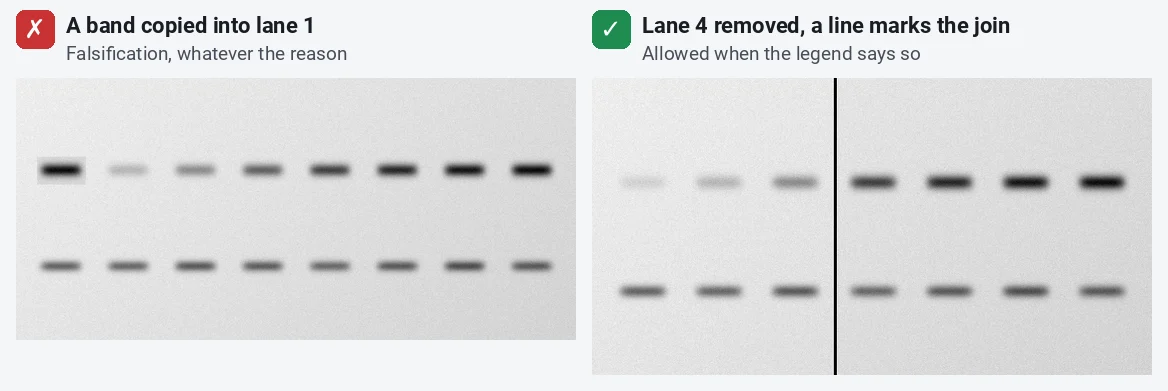
Copying a band into another lane (Edit › Copy, Edit › Paste) creates data that do not exist. It is fabrication, even if you "know" the protein is there. Removing a lane you do not need and joining the rest is allowed, if a visible line marks the join and the legend says so.
Pitfalls
- Adjusting images one by one. Treated and control images must be acquired with the same settings and processed with the same display range; a brighter control is a misrepresentation even if each image looks fine. In ImageJ, set the range on one image and use Set with Propagate to all other open images, or type the same values on each.
- Clipping at acquisition. Increasing the exposure or gain until the bands saturate loses information that no later step can recover. Check the histogram on the microscope or imager.
- Measuring the figure copy. Measure the original file, not the adjusted 8-bit copy: the stretch and the 8-bit conversion change the values. See western blot quantification in ImageJ.
- JPEG, PowerPoint and resizing. JPEG compression and PowerPoint both change pixel values; enlarging adds pixels that were never measured. Assemble figures from TIFFs, change the size once, and add the scale bar before resizing.
- "Auto" buttons. Auto in Brightness/Contrast saturates a small share of pixels by design. Fine for looking; check the histogram before you use it for a figure.
- Background subtraction and filters. They can be right (a rolling-ball subtraction before measuring), but they change the data: apply them the same way to every image compared, and name them with their settings.
Reporting it
A sentence for the methods or the legend:
Images were processed in [ImageJ 1.54f]. Brightness and contrast were adjusted linearly and identically for all panels in a figure [display range 15000–57000, then conversion to 8-bit]; [a gamma of 0.5 was applied to the whole image in panel C]. Lanes from the same gel that were not adjacent are separated by black lines. Uncropped original blots are shown in Supplementary Figure [S1]. Quantification was performed on the original, unprocessed files.
Cite ImageJ (Schneider et al. 2012) or Fiji (Schindelin et al. 2012), and keep the originals for at least as long as your institution and funder require.
Switch to LabCanvas: check the image before you adjust it
LabCanvas Image Analysis runs in the browser, with nothing to install, and checks every image for the problems above the moment you open it.
- Click Open an image and choose the original TIFF from the microscope or imager.
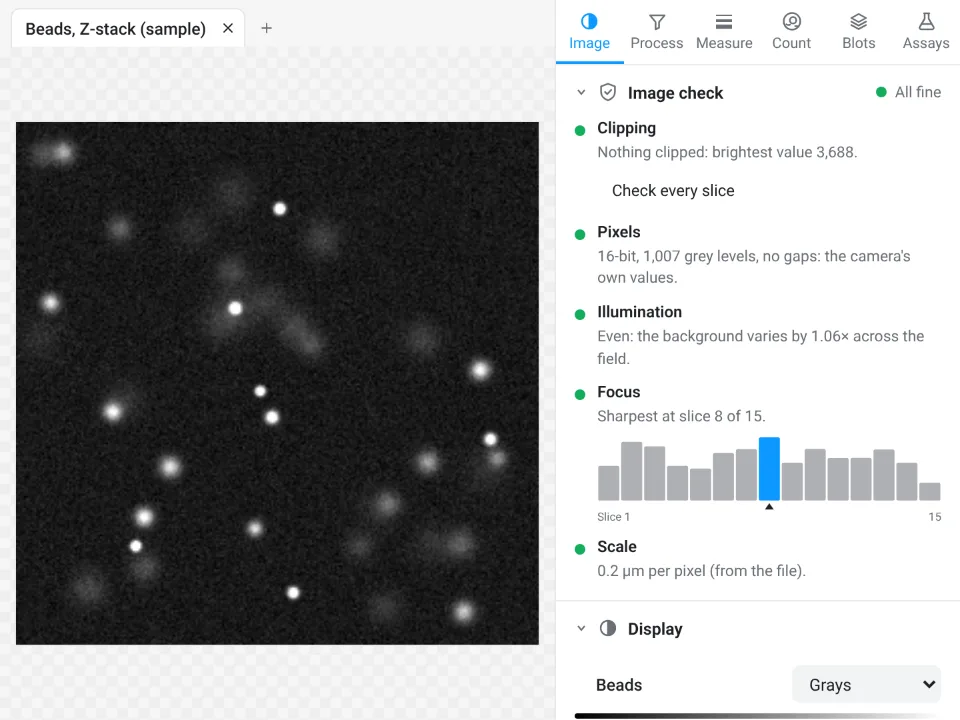
- Read the Image check at the top of the Image tab: Clipping (pixels at 0 or the top value, with Show where), Pixels (JPEG, a picture taken from a figure, gaps from earlier processing), Illumination and Focus.
- Use Display to set the minimum and maximum: it changes only how the image looks, and every measurement still reads the raw values.
- Add to a figure sends the image, with its scale bar, to a figure.
Why switch for this job:
- The image check runs first, so a clipped, compressed or re-saved image is flagged before you measure or publish it.
- Display never touches the data: there is no Apply button that rewrites pixels, so a selective edit cannot happen by accident.
- A methods sentence to copy with every result, and every measurement validated in more than 4,000 automated tests.
ImageJ and Fiji stay the tools for full control over processing, macros and the microscope makers' own file formats (.czi, .nd2, .lif), which LabCanvas needs as TIFF first.
Open Image Analysis: free with a LabCanvas account (downloading files is part of LabCanvas Pro). ImageJ and Fiji are independent open-source projects; LabCanvas is not affiliated with them.
References
- Cromey DW (2010). Avoiding twisted pixels: ethical guidelines for the appropriate use and manipulation of scientific digital images. Science and Engineering Ethics 16, 639–667. doi:10.1007/s11948-010-9201-y
- Rossner M, Yamada KM (2004). What's in a picture? The temptation of image manipulation. Journal of Cell Biology 166, 11–15. doi:10.1083/jcb.200406019
- Schindelin J, Arganda-Carreras I, Frise E, et al. (2012). Fiji: an open-source platform for biological-image analysis. Nature Methods 9, 676–682. doi:10.1038/nmeth.2019
- Schneider CA, Rasband WS, Eliceiri KW (2012). NIH Image to ImageJ: 25 years of image analysis. Nature Methods 9, 671–675. doi:10.1038/nmeth.2089
- Nature Portfolio. Image integrity and standards. nature.com/authors/policies/image.html
- PLOS. Figures: blot and gel reporting requirements (the same on each PLOS journal's Figures page), for example journals.plos.org/globalpublichealth/s/figures
Frequently asked questions
Is it acceptable to adjust brightness and contrast on a western blot?
Yes, if the change is linear, applied to the whole image (and to the controls in the same way), and does not hide or remove information. Rossner and Yamada (2004) and Nature Portfolio’s policy both put it this way. Pushing the contrast until the background turns white or faint bands disappear is not acceptable, even when applied to the whole image.
Do I have to disclose gamma changes in a figure?
Yes. Gamma is a non-linear adjustment: it changes the mid-tones more than the dark and bright values. The JCB guidelines quoted by Rossner and Yamada (2004) and Nature Portfolio’s policy both say non-linear adjustments such as gamma changes must be stated in the figure legend.
Can I splice lanes from a western blot together?
You may remove lanes from the same gel and join the rest, if a visible line marks every join and the legend says so. Bands from different gels must not be presented as if they ran on one gel, and a band must never be moved or copied into another lane. Rerun the samples on one gel when you want to compare them.
Does Brightness/Contrast in ImageJ change my data?
Not until you click Apply. Moving the Minimum and Maximum sliders or using Set changes only the display range; the pixel values stay the same, and measurements still read them. Apply rewrites the pixel values, and if a selection is active it changes only the selected area, which is exactly the selective edit journals forbid.
Do journals want the original uncropped blots?
Increasingly, yes. Nature Portfolio asks for unprocessed original images of gels and blots for life-science papers, and PLOS journals have required original, uncropped and minimally adjusted images of all blots and gels since July 2019. Keep the raw file from the imager with its markers.
Is it acceptable to save microscopy images as JPEG?
Not for data. JPEG compression changes pixel values and blurs fine detail, so measure and archive TIFF files (or the microscope’s own format) and use JPEG, if at all, only for a web copy made last.
Try it in LabCanvas
Every app is free to start in your browser. Create an account and begin.
Start Image Analysis free in your browserKeep reading

ImageJ vs LabCanvas Image Analysis: an honest comparison
ImageJ/Fiji or LabCanvas Image Analysis? Six everyday jobs done in both, six newer ones (macros, vendor files, 3D, StarDist, big images) and which to use.

How to use ImageJ: a beginner's tutorial for the 10 everyday jobs (2026)
How to use ImageJ and Fiji: get started, open an image, then 10 everyday jobs (scale, measure, threshold, count, background, blots) with exact menu paths.

How to set the scale and add a scale bar in ImageJ (with a calibration image to practise on)
Set the scale in ImageJ (Analyze › Set Scale) from a micrometer, scale bar or pixel size, add a scale bar, and practise on a free calibration image.