Best ImageJ alternatives in 2026 (free, online and desktop)
The best ImageJ alternatives compared: browser tools, Fiji, CellProfiler, QuPath, ilastik, napari, Icy, MIPAR, and Image Lab and Empiria for blots.
Contents
The best ImageJ alternative depends on the job. For plugins and macros, stay with Fiji, which is ImageJ with the plugins built in; for thousands of images, use CellProfiler; for whole slides, QuPath; for machine-learning segmentation, ilastik; in Python, napari. With nothing to install, ImageJ.JS runs ImageJ itself in the browser, and browser apps such as LabCanvas Image Analysis cover the everyday measurements. For western blots, Bio-Rad's Image Lab has a free standard edition and LI-COR sells Empiria Studio.
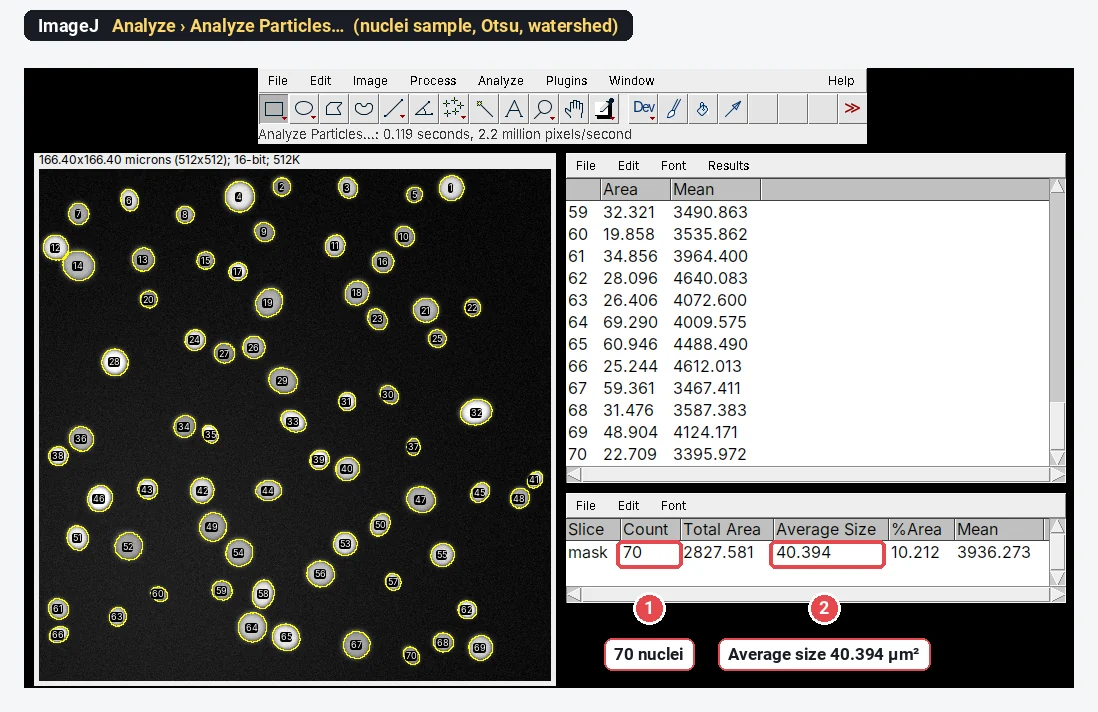
This article is on the LabCanvas website, and our own browser tool is one of the eleven. We have tried to be fair to every tool: each fact about the others comes from the project's or vendor's own site, linked in its section, checked in November 2026. The picture above is ImageJ 1.54f itself counting the nuclei sample, the job most of these tools are measured against.
The comparison at a glance
| Tool | Best for | Price and licence | Runs on | Main limit |
|---|---|---|---|---|
| Fiji | Everything ImageJ does, plus many plugins | Free, open source (GPL) | Windows, macOS, Linux | Many menus to learn; a desktop install |
| ImageJ.JS | ImageJ 1.x without installing anything | Free | Web browser | Slower than desktop ImageJ; plugins that need native code may not work |
| LabCanvas Image Analysis | Everyday measurements, blots and guided assays, with results sent to graphs and figures | Free with an account; downloads need LabCanvas Pro | Web browser | No plugins, macros, 3D object analysis, deep learning or vendor file formats |
| CellProfiler | Pipelines run on thousands of images | Free, open source (BSD 3-Clause) | Windows, macOS, Linux | Built for batches, not for one image by hand |
| QuPath | Whole-slide images and pathology | Free, open source (GPL) | Windows, macOS, Linux | Not intended for clinical diagnosis |
| ilastik | Segmentation learnt from a few brush strokes | Free, open source (GPL) | Windows, macOS, Linux | 8 GB of RAM or more recommended; pixel labels still need turning into objects |
| napari | Viewing and annotating n-D images from Python | Free, open source (BSD 3-Clause) | Windows, macOS, Linux | A viewer first; analysis comes from plugins |
| Icy | Visual workflows (protocols) and plugins | Free, open source (GPLv3) | Windows, macOS, Linux | Needs a separate Java 8 installation |
| MIPAR | Materials micrographs, deep learning, support | Paid, annual or perpetual; 14-day trial | Windows, macOS | Price on request |
| Bio-Rad Image Lab | Gels and western blots | Standard edition free; Security Edition paid | Windows, macOS | Gels and blots only |
| LI-COR Empiria Studio | Western blots from LI-COR imagers | Paid per-user licence; free trial | Windows, macOS | Built around LI-COR instruments |
Free desktop software
1. Fiji
Fiji is the "batteries-included" distribution of ImageJ: ImageJ2 and ImageJ 1.x with plugins for life-science image analysis already installed (Bio-Formats for microscope files, TrackMate for tracking and many more), an updater, and a script editor for macros, Python (Jython) and Groovy.
- Price: free, open source under the GNU General Public License.
- Runs on: Windows, macOS and Linux. It is portable: unpack the archive and start the launcher, no installer.
- Limits: many menus and plugins to learn; plugins vary in quality and upkeep; it is a desktop application.
Pick it if you need a specific plugin, a macro, 3D analysis, deep-learning segmentation (StarDist has a Fiji plugin), a vendor file format or very large data. If you are new to it, start with how to use ImageJ and Fiji vs ImageJ.
2. CellProfiler
CellProfiler is free, open-source software from the Broad Institute for measuring phenotypes in images automatically. You build a pipeline of modules (find nuclei, find cells, measure intensity, texture and shape), adjust it on a few images, then run it on a whole experiment, which can be millions of images, with no programming. CellProfiler Analyst explores the results with machine learning.
- Price: free, BSD 3-Clause licence.
- Runs on: Windows and macOS, with a Flatpak for Linux.
- Limits: it is built for batches; measuring one image by hand, or quantifying a blot, is quicker elsewhere.
Pick it if you run high-content screens or many plates and need the same pipeline on every image.
3. QuPath
QuPath is open-source software for digital pathology and whole-slide image analysis: cell and tissue detection, interactive machine learning for object and pixel classification, and Groovy scripting. Its developers note that it can be used for many other kinds of image too.
- Price: free, GNU General Public License.
- Runs on: Windows, macOS (Intel and Apple silicon builds) and Linux.
- Limits: its developers state that it is not intended for clinical, diagnostic or therapeutic use.
Pick it if you work with whole-slide images, immunohistochemistry across tissue sections, or very large 2D images.
4. ilastik
ilastik is interactive machine learning for image analysis: you paint a few labels on each class and a random forest classifies every pixel, using intensity, edge and texture features at several scales. Its workflows cover pixel classification, object classification, tracking and counting, on data up to 3D with time and channels, and a trained project can run on new data from the command line.
- Price: free, GNU General Public License (version 2 or later).
- Runs on: Windows, macOS (Apple silicon and Intel) and Linux, 64-bit only; the documentation recommends at least 8 GB of RAM.
- Limits: pixel classification gives a class for each pixel; to get separate objects you add the object-classification workflow or another tool.
Pick it if a threshold cannot separate what you want (uneven backgrounds, textures, membranes) and you would rather paint examples than write code.
5. napari
napari is a fast, interactive viewer for multi-dimensional images in Python. Analysis comes from plugins, installed from its Plugins menu and listed on the napari hub, and from Python libraries such as scikit-image, StarDist or Cellpose.
- Price: free, BSD 3-Clause licence.
- Runs on: Windows, macOS and Linux, as a Python package or as a standalone app (some plugins need the full Python install).
- Limits: a viewer first; without Python or plugins it measures little.
Pick it if you already work in Python and want to look at, annotate and segment large n-D data next to your code.
6. Icy
Icy is an open community platform for bioimage informatics, started in 2011 by the BioImage Analysis Lab at Institut Pasteur. Plugins install from inside the program, protocols let you build workflows graphically by linking blocks, and a script editor runs JavaScript and Python.
- Price: free, open source (GPLv3).
- Runs on: Windows, macOS and Linux, with Java 8 installed separately.
- Limits: you manage the Java installation yourself.
Pick it if you want to chain analysis steps visually, without code, and reuse the workflow on many images.
In the browser
7. ImageJ.JS (ImageJ in the browser)
ImageJ.JS is ImageJ 1.x compiled to WebAssembly with CheerpJ, a compiler that runs Java programs in the browser. It started in the ImJoy project (ij.imjoy.io); the current version is at ij.aicell.io. You get the real ImageJ menus, with no installation and no Java, and it works on tablets.
- Price: free. ImageJ is in the public domain, and the original ImageJ.JS code is MIT-licensed.
- Limits, from its own README: slower than desktop ImageJ; plugins that need native code may not work; reading and writing folders on your computer works only in Chrome and Edge.
Pick it if you know ImageJ's menus and need them on a computer where you cannot install anything, such as a shared PC or a tablet. ImageJ online goes through what works in the browser and what does not.
8. LabCanvas Image Analysis
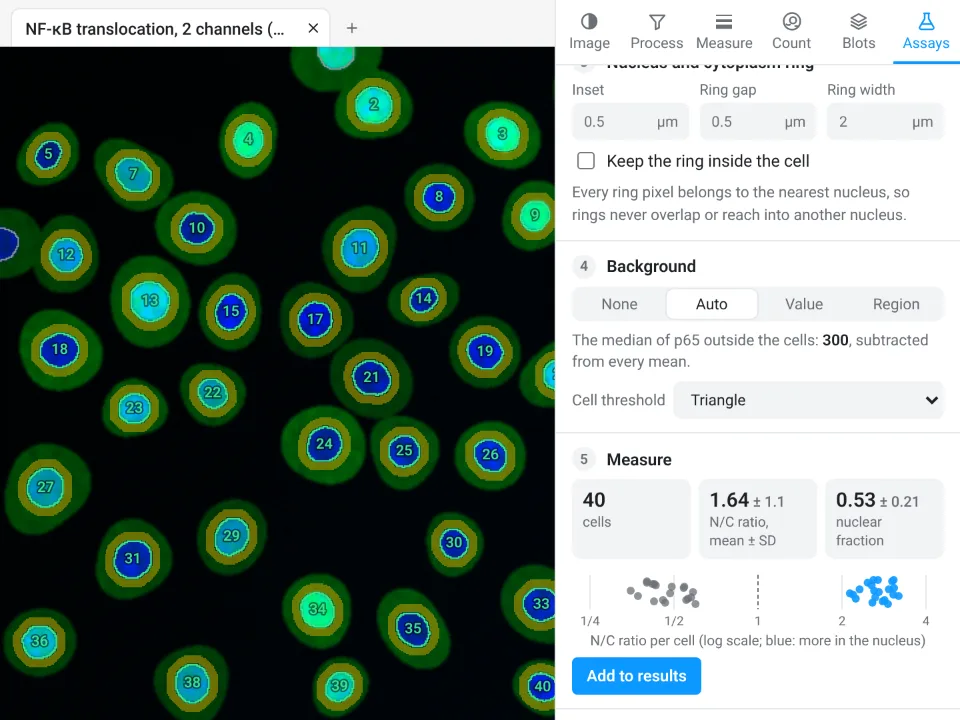
LabCanvas Image Analysis measures microscope images, western blots and gels in the browser, on the raw pixel values, with ImageJ's names and measurement definitions: an ROI list with Measure and Set measurements (Area, Mean, IntDen, RawIntDen, Feret and the rest), Count particles for Analyze Particles, sixteen automatic threshold methods, rolling-ball background subtraction, Z projection, Find Maxima and a cell counter. On top of that come guided assays for nuclear translocation, foci, colonies, wound healing, FRAP, calcium imaging, tracking, kymographs, branching, Sholl analysis and tube formation; a pixel classifier trained with a few brush strokes; and an image check that flags clipped pixels, JPEG compression and uneven illumination before you measure.
- Price: free to use with a LabCanvas account, including measuring, Copy table, Send to Graphs, Add to a figure and the methods sentence. Downloading files (CSV, TIFF, PNG) is part of LabCanvas Pro (see pricing).
- Files: TIFF and BigTIFF (stacks and hyperstacks, 8-, 16- and 32-bit), OME-TIFF, PNG, JPEG, WebP, GIF and BMP, and ImageJ's .roi files and RoiSet.zip.
- Limits: no plugins and no macro language; no 3D object analysis or deep-learning segmentation; files in a microscope maker's format (.czi, .nd2, .lif) must be exported as TIFF first; no DICOM.
Pick it if you want the everyday jobs (scale, length and area, intensity, counting, blots, common assays) in the browser on any computer, today, without installing Java or hunting for plugins, and you want the numbers in a graph with statistics and the image in a figure. The beginner's tutorial maps ten ImageJ jobs to it; screenshots are in the last section of this article.
Paid
9. MIPAR
MIPAR is commercial image-analysis software with many materials applications (grains, nanofibres, ceramic defects) as well as cell biology. Deep-learning training, Spotlight AI and a 3D toolbox are licence extensions, and it reads more than 150 file formats.
- Price: no public price list. Licences are annual or perpetual, quoted for the extensions and the number of computers you need; a fully functional 14-day trial is free. Check the vendor's site for current terms.
- Runs on: Windows 10 and 11 (64-bit) and macOS.
Pick it if you analyse materials images in an industrial or core lab, want vendor support, and have a budget.
For western blots and gels
10. Bio-Rad Image Lab
Image Lab is Bio-Rad's software for gel and blot images: automatic lane and band detection, lane normalisation, molecular weight from a ladder and reports. It reads images from Bio-Rad's ChemiDoc and Gel Doc imagers and opens external 8- and 16-bit greyscale TIFFs.
- Price: the standard edition is free to download (you sign in with a free Bio-Rad account). The Security Edition, for FDA 21 CFR Part 11 compliance, is paid and Windows-only.
- Runs on: Windows and macOS.
Pick it if you image blots on a Bio-Rad system, or want free desktop densitometry with automatic lanes.
11. LI-COR Empiria Studio, and what happened to Image Studio Lite
Empiria Studio is LI-COR's western blot analysis software, designed for images from LI-COR imaging systems, with workflows for normalisation to a housekeeping protein or a total protein stain, linear-range determination and replicate analysis.
- Price: paid. Each user needs a licence linked to their LI-COR account; a licence gives lifetime access with a year of updates, and renewals are optional. LI-COR lists the prices on its site and offers a free trial.
- Runs on: Windows 10 and 11 (64-bit) and macOS.
- Image Studio Lite, LI-COR's free quantification software, has been discontinued, and LI-COR replaced it with Empiria Studio. Its Image Studio Lite page now offers the full Image Studio software as a free download, "for a limited time"; check the terms there before you build a workflow on it.
Pick it if you image on a LI-COR Odyssey and want its validated western blot workflows.
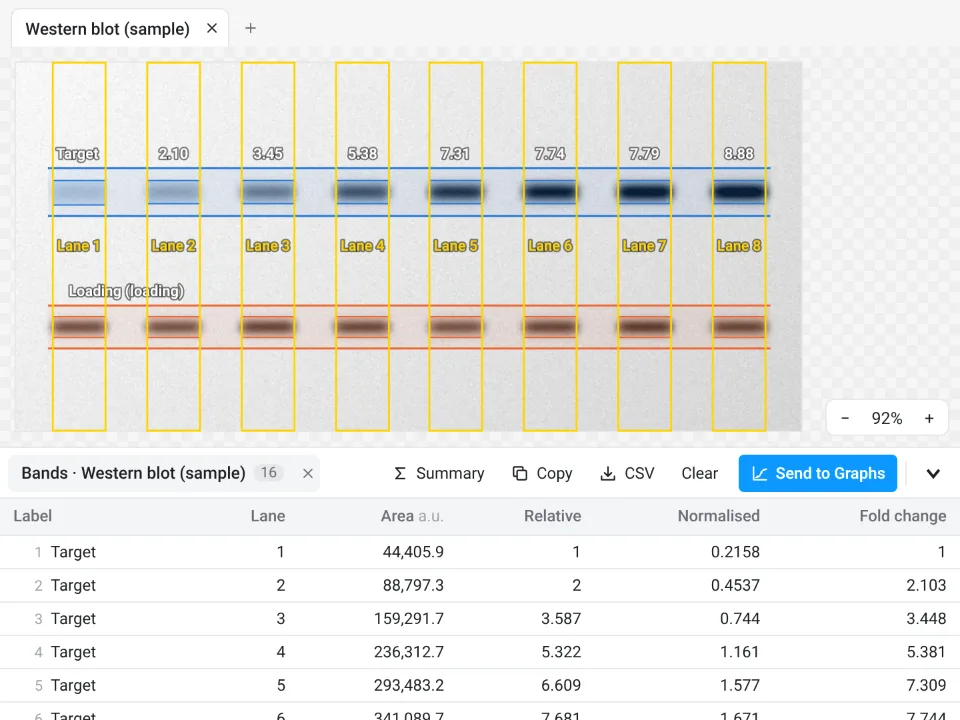
For blots, the free options are ImageJ's Analyze › Gels commands (step by step), Image Lab's standard edition and the Blots tab in LabCanvas, which finds lanes and bands, reads molecular weights from the ladder and normalises to a loading control or a total-protein stain.
How to choose
| If you need | Start with |
|---|---|
| A specific plugin, a macro, 3D or a vendor file format | Fiji |
| ImageJ's own menus without installing | ImageJ.JS |
| The everyday jobs now, in a browser, with graphs and figures | LabCanvas Image Analysis |
| The same pipeline on thousands of images | CellProfiler |
| Whole-slide pathology images | QuPath |
| Segmentation where thresholds fail, without code | ilastik (or the LabCanvas pixel classifier for 2D) |
| Python, with a viewer | napari |
| Visual workflows | Icy |
| Materials images with vendor support | MIPAR |
| Blots from a Bio-Rad or LI-COR imager | Image Lab or Empiria Studio |
Where Fiji is still the answer
Fiji (and ImageJ) remains the right tool for its plugin ecosystem, for macros and scripting, for 3D object analysis, for deep-learning segmentation through StarDist or Cellpose, for every vendor file format through Bio-Formats (.czi, .nd2, .lif and others), for DICOM files and for very large datasets. You can use both: Fiji for the special cases, and a quicker tool for the routine measurements.
AI segmentation: StarDist and Cellpose
Two free, open-source deep-learning tools do most of the AI segmentation in microscopy. StarDist describes each object as a star-convex polygon, which suits round nuclei packed close together; its pretrained models cover fluorescent and H&E-stained nuclei, and it has plugins for Fiji, napari, QuPath and Icy. Cellpose is a generalist model for cells and nuclei that works on many kinds of image without retraining; it has its own graphical interface and a web demo, and you can retrain it on your images. Both run outside LabCanvas: its pixel classifier learns from your brush strokes with a random forest, which is fast and often enough in 2D, but it is not a deep-learning model.
An easier way for the everyday jobs: LabCanvas Image Analysis
If what you do most is set a scale, measure, count, quantify a blot or run a common assay, LabCanvas Image Analysis does it in the browser, with no install and no plugins to find. Counting nuclei, the job in the ImageJ picture at the top:
- Click Open an image (TIFF with its scale, PNG or JPEG), or the Nuclei sample on the start screen.
- In the Count tab, click Find nuclei (Otsu threshold, fill holes, watershed and a sensible minimum size), or set the Threshold and the Count particles options yourself and click Count.
- Read the Particles table and the Summary row (Count, Total Area, Average Size, %Area, Mean).
- Send to Graphs for a graph with statistics, or Add to a figure for the image with its scale bar.
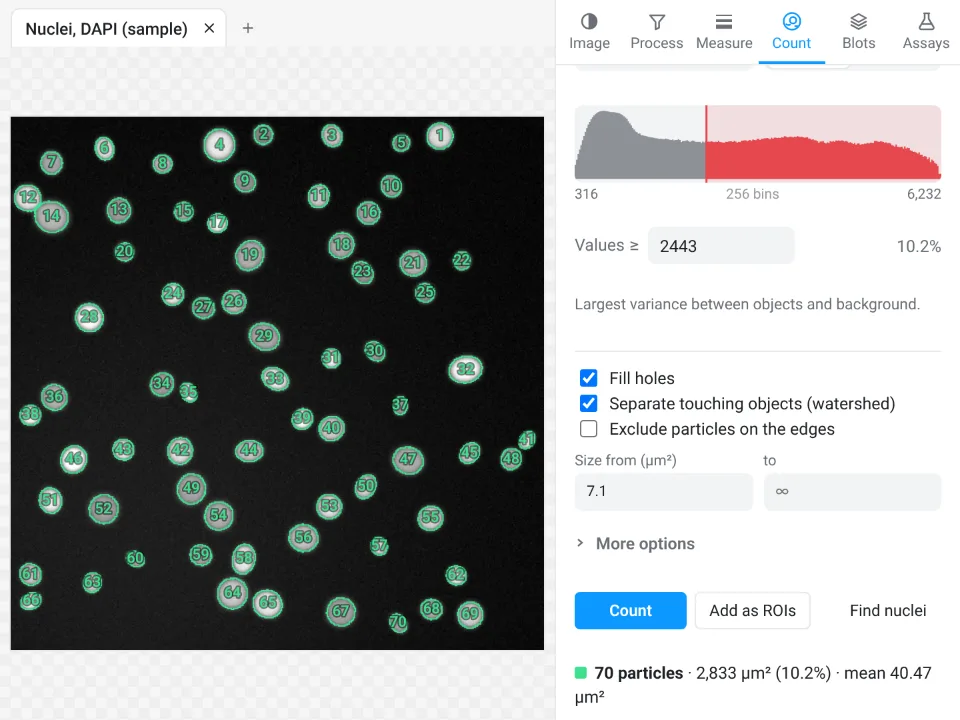
On that nuclei sample LabCanvas counts 70 nuclei with a mean area of 40.47 µm²; ImageJ 1.54f, in the cover picture, counts the same 70 with an average size of 40.394 µm².
Why it is a good choice for the everyday jobs:
- Nothing to install: it runs in the browser on any computer or tablet, including locked-down lab PCs.
- ImageJ's own names and definitions: Area, Mean, IntDen, RawIntDen, Feret and the rest, and it opens ImageJ .roi files and RoiSet.zip.
- Guided assays instead of plugins and macros: translocation, foci, colonies, wound healing, FRAP, calcium, tracking, kymographs, branching, Sholl and tube formation.
- An image check that flags clipped pixels, JPEG compression and uneven light before you measure.
- Results into Graphs and figures, with a methods sentence to copy; free with a LabCanvas account (downloads are part of LabCanvas Pro), and every measurement checked in more than 4,000 automated tests.
Its limits stay the same as in the list above: no plugins or macros, no 3D object analysis or deep learning, no DICOM, and .czi, .nd2 and .lif files must be exported as TIFF first. ImageJ's menus, mapped to their place in LabCanvas, are in how to use ImageJ. Open Image Analysis and try a sample. ImageJ and Fiji are independent open-source projects; LabCanvas is not affiliated with them.
References
- Schneider CA, Rasband WS, Eliceiri KW (2012). NIH Image to ImageJ: 25 years of image analysis. Nature Methods 9, 671–675. doi:10.1038/nmeth.2089
- Schindelin J, Arganda-Carreras I, Frise E, et al. (2012). Fiji: an open-source platform for biological-image analysis. Nature Methods 9, 676–682. doi:10.1038/nmeth.2019
- Stirling DR, Swain-Bowden MJ, Lucas AM, et al. (2021). CellProfiler 4: improvements in speed, utility and usability. BMC Bioinformatics 22, 433. doi:10.1186/s12859-021-04344-9
- Bankhead P, Loughrey MB, Fernández JA, et al. (2017). QuPath: open source software for digital pathology image analysis. Scientific Reports 7, 16878. doi:10.1038/s41598-017-17204-5
- Berg S, Kutra D, Kroeger T, et al. (2019). ilastik: interactive machine learning for (bio)image analysis. Nature Methods 16, 1226–1232. doi:10.1038/s41592-019-0582-9
- de Chaumont F, Dallongeville S, Chenouard N, et al. (2012). Icy: an open bioimage informatics platform for extended reproducible research. Nature Methods 9, 690–696. doi:10.1038/nmeth.2075
- Schmidt U, Weigert M, Broaddus C, Myers G (2018). Cell detection with star-convex polygons. In Medical Image Computing and Computer Assisted Intervention (MICCAI 2018), Lecture Notes in Computer Science 11071, 265–273. doi:10.1007/978-3-030-00934-2_30
- Stringer C, Wang T, Michaelos M, Pachitariu M (2021). Cellpose: a generalist algorithm for cellular segmentation. Nature Methods 18, 100–106. doi:10.1038/s41592-020-01018-x
Frequently asked questions
What is the best software for image processing in the lab?
There is no single best one; it depends on the job. Fiji is the most complete free tool for microscopy, with plugins for almost everything. CellProfiler is built for thousands of images, QuPath for whole-slide pathology images, ilastik for machine-learning segmentation and napari for Python users. For everyday measurements with nothing to install, there are browser tools: ImageJ.JS (ImageJ itself) and LabCanvas Image Analysis. Photo editors are not made for measuring: they do not keep a calibrated scale or report areas and intensities.
What is the best AI tool for microscopy image analysis?
For segmenting cells and nuclei, the two most used deep-learning tools are StarDist and Cellpose. StarDist describes each nucleus as a star-convex polygon and has pretrained models for fluorescent and H&E-stained nuclei, with plugins for Fiji, QuPath, napari and Icy. Cellpose is a generalist model for cells and nuclei that works on many image types without retraining; it has its own interface and a web demo. Both are free and open source. ilastik and the LabCanvas pixel classifier learn from a few brush strokes instead, using a random forest rather than deep learning.
Is ImageJ good for medical imaging?
For research measurements on medical images, yes. ImageJ opens uncompressed DICOM files with File › Open, opens a DICOM series with File › Import › Image Sequence, and shows the DICOM header with Image › Show Info. It is research software, not a clinical viewer for diagnosis. LabCanvas Image Analysis does not read DICOM files, so for medical images ImageJ or Fiji is the better choice.
Is ImageJ free?
Yes. ImageJ 1.x is public-domain software from the US National Institutes of Health, and Fiji is open source under the GNU General Public License, so both are free for any use. Most of the alternatives here are free as well (ImageJ.JS, CellProfiler, QuPath, ilastik, napari, Icy and the standard edition of Bio-Rad Image Lab); MIPAR and LI-COR Empiria Studio are paid. LabCanvas Image Analysis is free with an account, and downloads are part of LabCanvas Pro.
Is there an ImageJ alternative that runs online?
Two stand out. ImageJ.JS runs ImageJ 1.x itself in the browser, compiled to WebAssembly, so the menus are the ones you know. LabCanvas Image Analysis is built for the browser, with ImageJ's measurement names, guided assays, an image check and results that go to Graphs and figures. Neither replaces Fiji's plugins.
Is there a free replacement for Image Studio Lite?
LI-COR has discontinued Image Studio Lite and replaced it with the paid Empiria Studio; its Image Studio Lite page now offers the full Image Studio software as a free download "for a limited time". Free options for blot densitometry are ImageJ's Analyze › Gels commands, the standard edition of Bio-Rad Image Lab, and the Blots tab of LabCanvas Image Analysis.
Try it in LabCanvas
Every app is free to start in your browser. Create an account and begin.
Start Image Analysis free in your browserKeep reading

ImageJ vs LabCanvas Image Analysis: an honest comparison
ImageJ/Fiji or LabCanvas Image Analysis? Six everyday jobs done in both, six newer ones (macros, vendor files, 3D, StarDist, big images) and which to use.

How to use ImageJ: a beginner's tutorial for the 10 everyday jobs (2026)
How to use ImageJ and Fiji: get started, open an image, then 10 everyday jobs (scale, measure, threshold, count, background, blots) with exact menu paths.

How to set the scale and add a scale bar in ImageJ (with a calibration image to practise on)
Set the scale in ImageJ (Analyze › Set Scale) from a micrometer, scale bar or pixel size, add a scale bar, and practise on a free calibration image.