Count bacterial colonies in ImageJ (or from a plate photo, free online)
Count colonies in ImageJ: oval on the dish, threshold, Watershed, Analyze Particles. Then CFU/mL from the count and dilution, with a worked example.
Contents
To count colonies in ImageJ, set the scale from the dish, draw an oval just inside the rim and clear everything outside it, threshold the colonies (Image › Adjust › Threshold…), split touching ones with Process › Binary › Watershed, and run Analyze › Analyze Particles… with a minimum size and Summarize ticked. Then CFU/mL = colonies ÷ (volume plated in mL × dilution): 60 colonies from 100 µL of a 10⁻⁵ dilution is 6.0 × 10⁷ CFU/mL.
The plate in this example
A synthetic photo of a 60 mm dish, 720 × 720 pixels, made for testing: 60 dark colonies on light agar, 0.3 to 3.4 mm² each, including five pairs that touch, with the uneven lighting and the darker edge you get from a real phone photo. Knowing the true count lets you check every step.
How do I count colonies in ImageJ? Step by step
These commands are in ImageJ 1.x, so they are the same in Fiji.
- Open the photo (File › Open). JPEG from a phone is fine for counting; keep the original.
- Set the scale from the dish. Draw a straight line across the dish from inner wall to inner wall through the centre, then Analyze › Set Scale…: Known distance 60 (or your dish's inner diameter), Unit mm. Here the line was 636 pixels, so 0.0943 mm per pixel. Zoom in before you click the ends; one pixel off at each end is 0.2 mm on the diameter. (Details: how to set the scale in ImageJ.)
- Image › Type › 8-bit. For coloured colonies on coloured agar, Image › Color › Split Channels and keep the channel with the most contrast is often better (here the green channel: agar about 214, colonies about 52).
- Keep only the inside of the dish. Pick the oval tool, Shift-drag a circle a little inside the rim (here 600 pixels across on a 636-pixel dish, about 1.7 mm in from the wall), then Edit › Clear Outside. The rim, its shadow and the bench are gone; with white as the background colour (Edit › Options › Colors…) they no longer look like colonies.
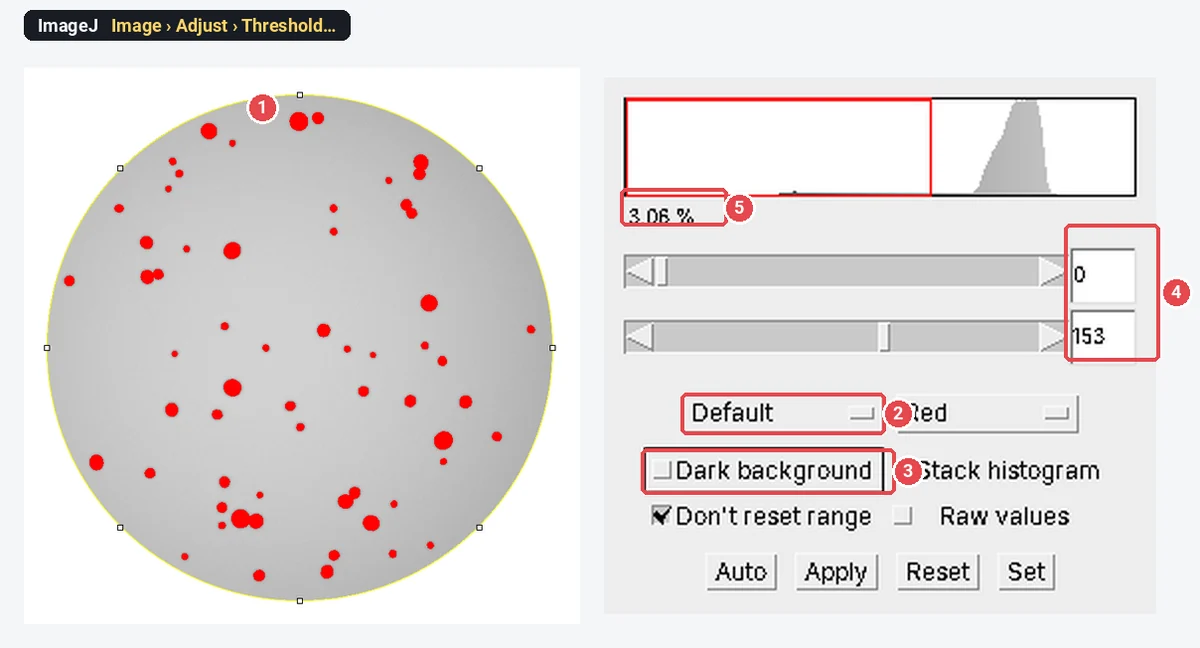
- Threshold. Image › Adjust › Threshold…, method Default, Dark background off (dark colonies on light agar; tick it for light colonies on dark agar). Check that every colony is red and the agar is not. Here Default chose 0–153, 3.06% of the image. Click Apply.
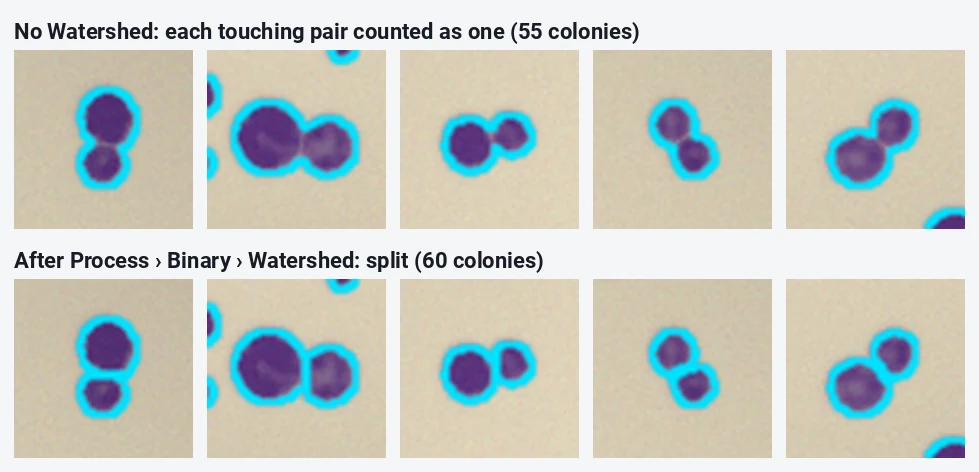
- Clean up the mask. Process › Binary › Convert to Mask (if Apply did not already), Process › Binary › Fill Holes (colonies with a pale centre), then Process › Binary › Watershed to split touching colonies.
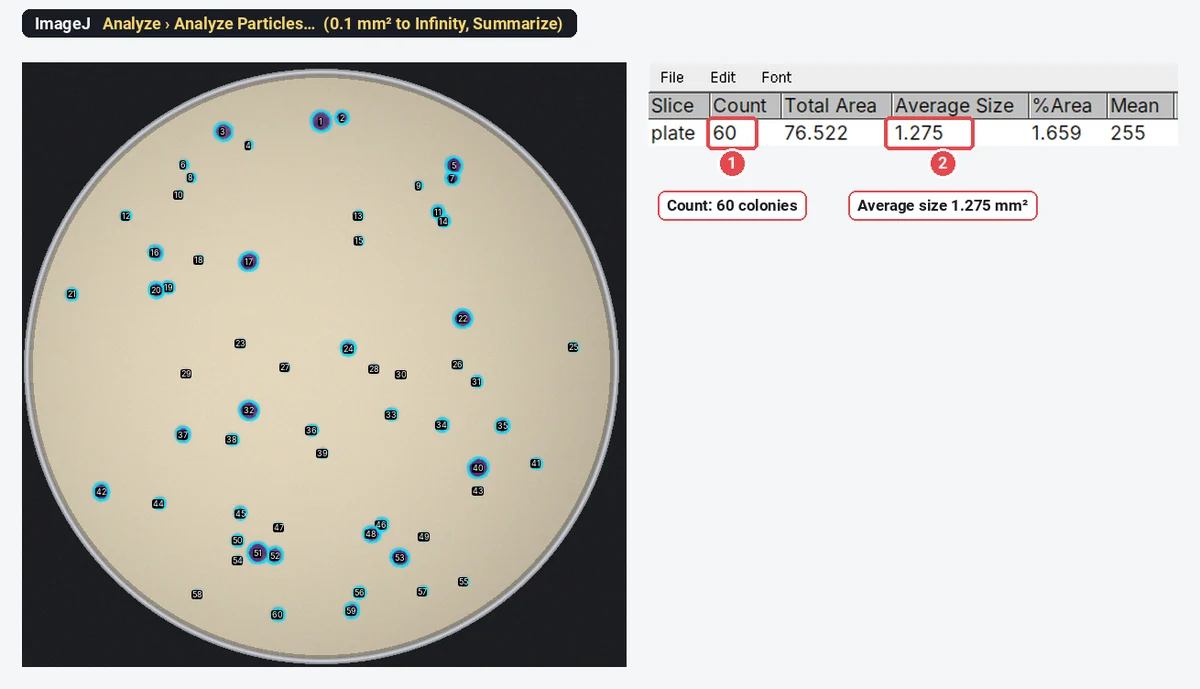
- Count. Analyze › Analyze Particles…, Size 0.1–Infinity mm² (drops specks of dust and agar texture), Circularity 0.00–1.00, Show Outlines or Overlay, Summarize ticked, and Add to Manager if you want to check the outlines on the colour photo.
On this plate, ImageJ found 60 colonies, all of them. Without Watershed it found 55: each of the five touching pairs counted as one.
Why does Analyze Particles count the rim, or nothing at all?
- The rim or the bench is counted: you skipped Clear Outside, or the oval touches the wall. Draw it a little smaller.
- One huge particle, or a count of 0: the threshold selected the agar, not the colonies. Flip Dark background, or invert the mask with Edit › Invert.
- Hundreds of tiny particles: the minimum size is too small, or the threshold reaches into the agar's texture. Raise the size to the smallest real colony (about a fifth of a typical one) or blur slightly first (Process › Filters › Gaussian Blur…, sigma 1).
- Colonies near the edge are missed: the light falls off towards the wall. Subtract the background first (Process › Subtract Background…, light background ticked, radius larger than the biggest colony), or threshold each half separately.
How do I calculate CFU/mL from the count?
A colony-forming unit (CFU) is one viable cell, or clump of cells, that grew into a colony. The formula:
Worked example with this plate: you made a tenfold serial dilution of an overnight culture, spread 100 µL of the 10⁻⁵ tube, and counted 60 colonies.
| Step | Value |
|---|---|
| Colonies counted | 60 |
| Volume plated | 100 µL = 0.1 mL |
| Dilution of the plated tube | 10⁻⁵ |
| CFU/mL in the original culture |
Plan the series with the dilution calculator (its serial dilution planner gives the volumes tube by tube).
Some rules that keep the number honest:
- Count plates in the countable range, about 30 to 300 colonies on a standard 90–100 mm plate (some standards use 25–250). Below it, chance dominates; above it, colonies merge and the count falls short. On a 60 mm dish, the top of the range is lower.
- Average the replicate plates of the same dilution before you apply the formula, and if two consecutive dilutions are both in range, check that they agree within about tenfold.
- Report it as CFU/mL (or CFU/g), never as "cells": a chain or a clump gives one colony.
- With too few colonies, say so: "fewer than 30 colonies; estimated count" rather than a precise figure.
How should I photograph the plates?
The count is only as good as the photo.
- Lid off, or the lid's reflections and condensation look like colonies.
- Straight above, camera parallel to the plate. A tilted phone makes the dish an ellipse and the scale wrong across it. A copy stand or a box with a hole in the lid helps.
- Even light: a light box underneath for clear agar, or diffuse light from the side on a dark background for opaque agar. Avoid a ring light's reflection in the middle of the agar.
- The whole dish, filling the frame, and the same zoom, light and exposure for every plate in the experiment.
- A scale: the dish's inner diameter is enough; a ruler beside the dish is better.
- Label each plate in the picture (on the side of the base), so photo and plate cannot be mixed up.
When is a count by hand better than ImageJ?
Swarming or spreading colonies, colonies of several morphologies to score separately, or plates with hundreds of tiny colonies defeat a threshold. Count those by hand: in Fiji, Plugins › Analyze › Cell Counter keeps a tally per marker type as you click; in plain ImageJ, the Multi-point tool numbers each click and Analyze › Measure gives the count. OpenCFU (Geissmann 2013) is a free desktop colony counter built for this job, and a Fiji macro that repeats the steps above is the route when you have thousands of plates and want the whole pipeline scripted.
Pitfalls
- Merged colonies. Watershed splits round pairs; it cannot split a spreading lawn. If more than a few colonies touch, plate a higher dilution.
- Debris and bubbles. Air bubbles in the agar and dust look like small dark colonies. The minimum size drops most of them; look at the outlines on the photo before you trust the count.
- Colonies on the wall. Colonies growing up the side of the dish are hidden in the rim. Count those by eye and add them, or accept a small, consistent undercount and say so.
- Different settings per plate. Choose the threshold method and size limit on a few plates, then keep them for the whole experiment.
- Never checked. Count three plates by hand and compare with the automatic count before you rely on it.
Reporting it
Plates were photographed from above on a [light box] with a [phone camera] at a fixed height. Colonies were counted in [Fiji (ImageJ 1.54)]: scale from the [60] mm dish, 8-bit, an oval region inside the rim, [Default] threshold, Fill Holes, Watershed and Analyze Particles from [0.1] mm²; automatic counts were checked against manual counts on [3] plates. Plates with 30–300 colonies were used, and CFU/mL was calculated as colonies ÷ (volume plated × dilution).
Cite ImageJ (Schneider et al. 2012) or Fiji (Schindelin et al. 2012). Plot CFU/mL on a log axis, with each biological replicate as a point.
An easier way: count colonies in LabCanvas
The same count runs in the browser in LabCanvas Image Analysis, with nothing to install and no oval to draw: its Colonies assay finds the dish for you.
- Open the plate photo, or click Try it on a sample (this plate is built in).
- In the Assays tab, choose Colony counting.
- Keep Round dish (it finds the dish and leaves out the rim), pick dark-on-light colonies, set the Smallest colony in mm², and leave Fill holes and Split touching colonies on.
- Read the count, colonies per cm², the mean size and the area covered; tick List every colony for each colony's size.
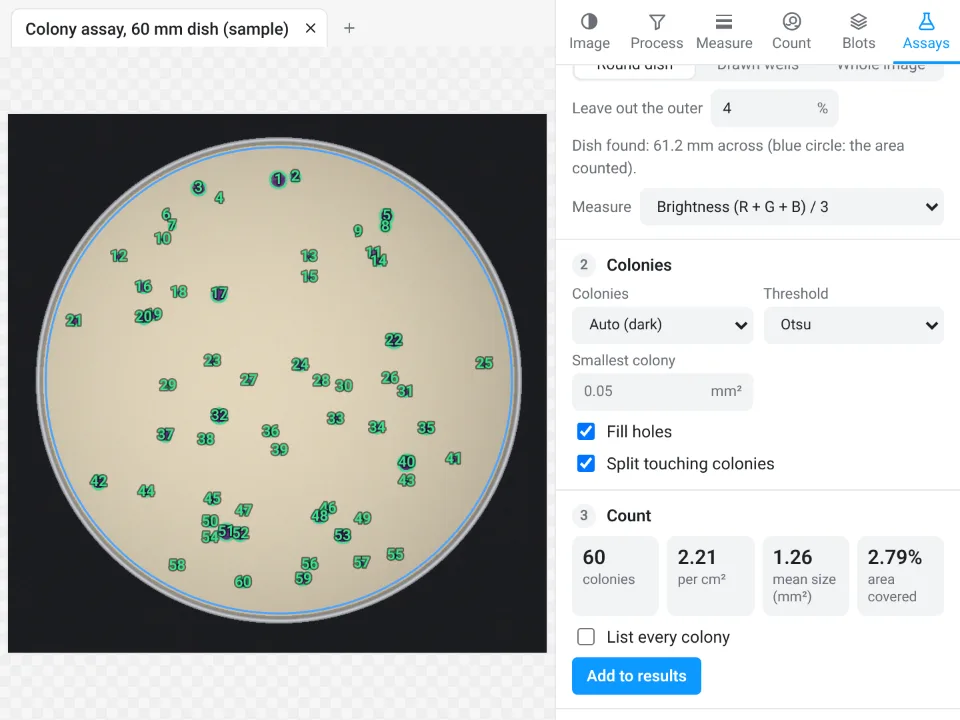
On this plate both programs found all 60 colonies. The mean sizes differ a little (1.275 mm² in ImageJ with the Default threshold, 1.26 mm² in LabCanvas with Otsu) because the threshold sets where each colony's edge is. ImageJ's %Area (1.659) is a share of the whole picture; LabCanvas gives a share of the dish (2.79%).
Why it is a good choice for plate counts:
- Nothing to install: it runs in the browser on any computer or tablet, so you can count at the bench.
- No manual steps: the dish is found, the rim left out and touching colonies split in one assay, instead of an oval, Clear Outside and four binary commands.
- An image check first: it flags JPEG compression, clipped pixels and uneven light before you count.
- Straight into Graphs: Run on many images gives one row per plate and Send to Graphs plots the counts per condition. Counting, Copy and Send to Graphs are free with a LabCanvas account; downloading CSV files is part of LabCanvas Pro.
- Checked: every measurement is validated in more than 4,000 automated tests.
Swarming colonies still need a count by hand; the Cell counter in the Count tab counts clicks in named categories. Open Image Analysis to count your own plates. ImageJ and Fiji are independent open-source projects; LabCanvas is not affiliated with them.
References
- Geissmann Q (2013). OpenCFU, a new free and open-source software to count cell colonies and other circular objects. PLoS ONE 8, e54072. doi:10.1371/journal.pone.0054072
- Schindelin J, Arganda-Carreras I, Frise E, et al. (2012). Fiji: an open-source platform for biological-image analysis. Nature Methods 9, 676–682. doi:10.1038/nmeth.2019
- Schneider CA, Rasband WS, Eliceiri KW (2012). NIH Image to ImageJ: 25 years of image analysis. Nature Methods 9, 671–675. doi:10.1038/nmeth.2089
Frequently asked questions
How do I count colonies in ImageJ?
Set the scale from the dish diameter, convert to 8-bit, draw an oval just inside the rim and use Edit › Clear Outside, threshold with Image › Adjust › Threshold (Dark background off for dark colonies on light agar), Convert to Mask, Fill Holes and Watershed, then Analyze › Analyze Particles with a minimum size and Summarize ticked. The Summary window gives the count.
How do I calculate CFU/mL from a colony count?
CFU/mL = colonies ÷ (volume plated in mL × dilution). For 60 colonies from 100 µL of a 10⁻⁵ dilution:
Why does ImageJ count two touching colonies as one?
Touching colonies form one connected blob in the mask. Process › Binary › Watershed cuts round blobs apart along their narrowest point; on our sample plate it raised the count from 55 to the true 60. Very irregular or spreading colonies are better counted by hand.
Is there a free colony counter online?
Yes. LabCanvas Image Analysis has a Colonies assay that runs in the browser, finds the dish and counts the colonies, free with a LabCanvas account (see the last section). OpenCFU is a free desktop program for the same job.
How should I photograph plates for counting?
Lid off, camera straight above and parallel to the plate, evenly lit from the side or from below on a dark background, no reflections on the agar, the whole dish in the frame, and the same settings for every plate. Put a ruler beside the dish or use its known diameter to set the scale.
Can ImageJ count colonies on a plate with hundreds of colonies?
It can, but accuracy drops as colonies merge into each other, and plates above about 300 colonies are outside the range a plate count should use anyway. Plate a higher dilution instead, and check a few automatic counts against a count by hand.
Try it in LabCanvas
Every app is free to start in your browser. Create an account and begin.
Start Image Analysis free in your browserKeep reading

ImageJ vs LabCanvas Image Analysis: an honest comparison
ImageJ/Fiji or LabCanvas Image Analysis? Six everyday jobs done in both, six newer ones (macros, vendor files, 3D, StarDist, big images) and which to use.

How to use ImageJ: a beginner's tutorial for the 10 everyday jobs (2026)
How to use ImageJ and Fiji: get started, open an image, then 10 everyday jobs (scale, measure, threshold, count, background, blots) with exact menu paths.

How to set the scale and add a scale bar in ImageJ (with a calibration image to practise on)
Set the scale in ImageJ (Analyze › Set Scale) from a micrometer, scale bar or pixel size, add a scale bar, and practise on a free calibration image.