Measure contact angle from a drop photo in ImageJ
Measure contact angle in ImageJ with the Angle tool along the tangent, or from drop height and base width: θ = 2·arctan(2h/d). Worked example, plugins.
Contents
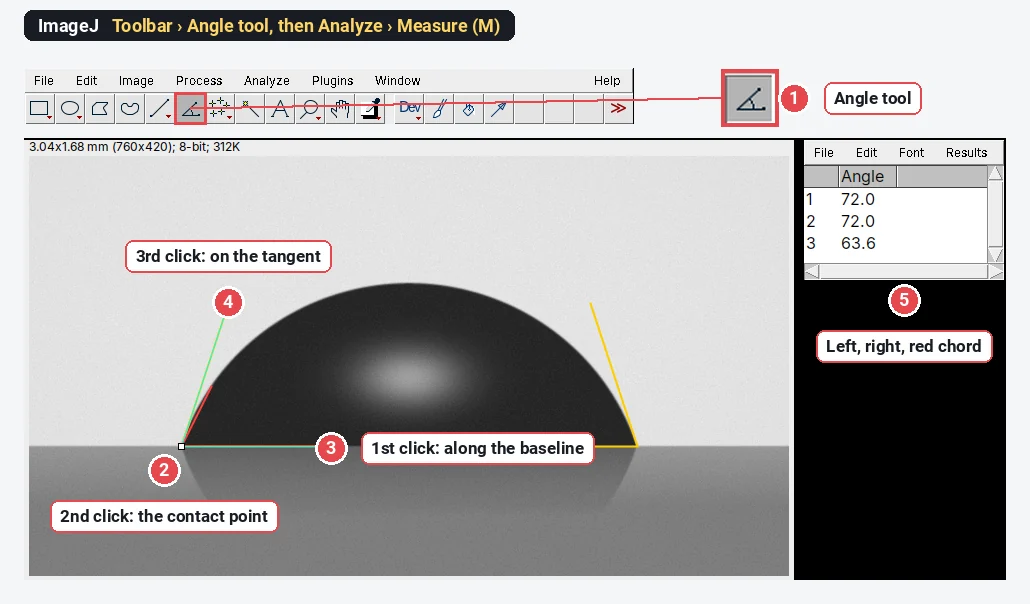
To measure a contact angle in ImageJ, open the side-view drop photo, pick the Angle tool in the toolbar, click once on the baseline, once on the contact point and once along the tangent to the drop edge, then press M (Analyze › Measure): the Angle column is the contact angle. For a small drop you can instead measure its height h and base width d and use the spherical-cap formula,
On our test drop, whose true contact angle is 72.0°, the Angle tool read 72.0° on both sides and the spherical-cap formula 71.1°. The rest of this guide shows both methods, where each goes wrong, and the two ImageJ plugins that do it more carefully.
What you are measuring
The contact angle
The sessile drop method measures it from a side view: a drop sits on the sample, a camera looks at it horizontally, backlit, so the drop is a dark silhouette on a light background with its mirror image in the surface below.
The test image
To check the methods we made a synthetic photo with a known answer: a 1 µL water drop (surface tension 72 mN/m, density 998 kg/m³) with a contact angle of exactly 72°. Its outline is not drawn as a circle: it was computed from the Young–Laplace equation, which includes gravity, as a real drop's would be. It is 760 × 420 pixels at 4 µm per pixel (250 pixels per mm), backlit, with a reflection under the baseline and a little noise. The base is 1.822 mm wide and the drop 0.652 mm high.
Method 1: the Angle tool along the tangent
- Open the photo and set the scale if you also want lengths (Analyze › Set Scale…; from the needle's known outer diameter or a calibration target; see how to set the scale in ImageJ). The angle itself needs no scale.
- Level the baseline. If the surface is tilted in the picture, rotate the image first (Image › Transform › Rotate…) so that the baseline is horizontal, or simply include the baseline as one arm of the angle, as below, so the tilt cancels.
- Zoom in on the left contact point (press + several times, to 400% or more). The contact point is where the drop's silhouette meets its reflection: the narrowest point of the dark "waist".
- Pick the Angle tool: it is the toolbar icon with an angle on it, between the line and point tools.
- Click three times: first a point on the baseline under the drop, then the contact point (the vertex), then a point on the tangent to the drop edge, just above the contact point. Before the third click, slide the arm until it lies along the last few pixels of the edge.
- Press M (Analyze › Measure). The Results table shows the Angle in degrees, between 0 and 180.
- Repeat on the right side and report the mean of the two. A difference of more than a few degrees means a tilted stage, a drop that is not symmetrical, or a tangent drawn badly.
The tangent is where the error lives. The red line in the picture goes from the contact point to a point on the edge only 60 pixels (0.24 mm) higher. That is a chord, not a tangent, and because the edge curves away it reads 63.6°, 8.4° too low. Keep the third click close to the contact point and line the arm up with the very bottom of the edge.
Two practical asides. A drop that is out of focus has a soft edge several pixels wide: focus on the contact line, not on the top of the drop. And the reflection is your friend: the contact point is where the drop and its mirror image meet, which is easier to see than the end of a blurred edge.
Method 2: the spherical-cap formula, θ = 2·arctan(2h/d)
A small drop is close to a slice of a sphere (a spherical cap). For a spherical cap of base width d (twice the base radius) and height h:
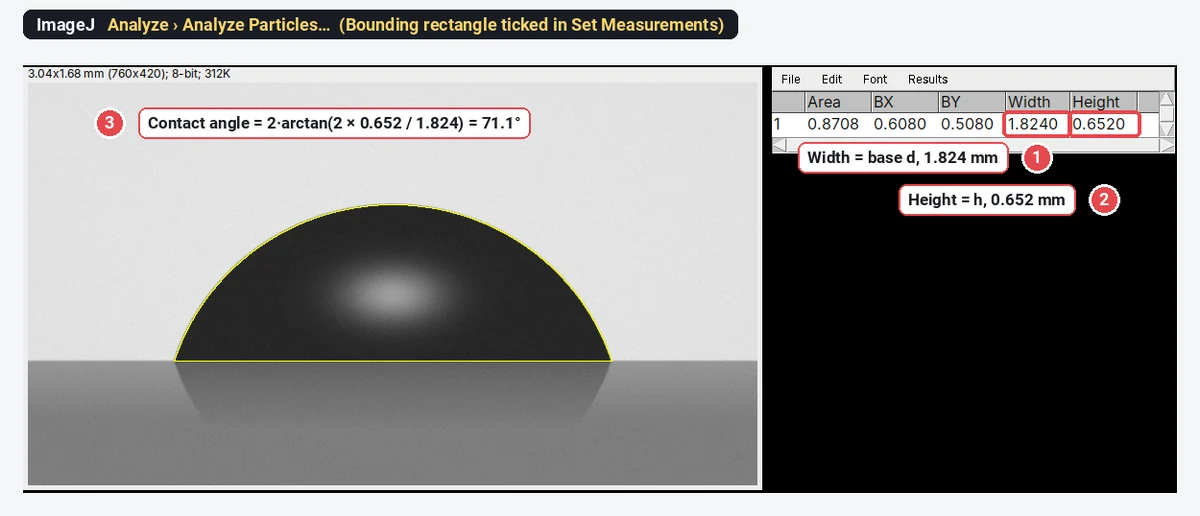
The method needs two lengths instead of a tangent, so it is less sensitive to how you click, but it assumes the shape. Steps in ImageJ:
- Set the scale (here 250 pixels = 1 mm).
- Draw a rectangle from the top of the image down to the baseline (not past it, or the reflection is included) and duplicate it (Image › Duplicate…).
- Image › Adjust › Threshold…, method Default, so that the drop is selected; Apply, then Process › Binary › Fill Holes (the bright highlight in the middle of a backlit drop leaves a hole).
- In Analyze › Set Measurements… tick Bounding rectangle, then Analyze › Analyze Particles… with Display results. Width is d and Height is h.
You can also draw two straight lines and press M for each: one between the contact points (d) and one from the apex straight down to the baseline (h).
The worked example
| Quantity | Value |
|---|---|
| Base width d (ImageJ, Width) | 1.824 mm (true 1.822 mm) |
| Height h (ImageJ, Height) | 0.652 mm (true 0.652 mm) |
| 35.56° | |
| 71.1° | |
| True contact angle | 72.0° |
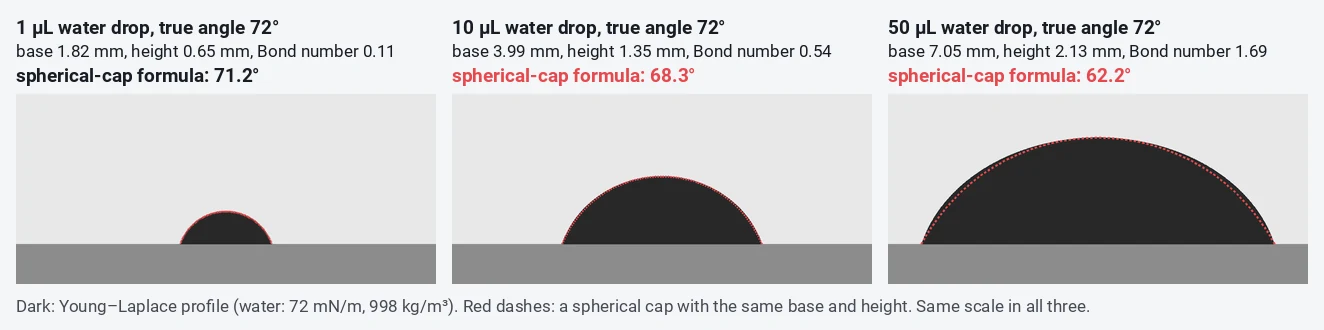
The formula is 0.9° low, and almost all of that is physics, not pixels: even with the exact outline, a 1 µL water drop gives 71.2° by the spherical-cap formula, because gravity has already flattened it slightly.
When does the spherical-cap assumption fail? (Bond number)
Gravity flattens a drop; surface tension rounds it. The Bond number compares the two:
where
| Drop volume (water, true θ 72°) | Base width | Height | Bond number | Error | |
|---|---|---|---|---|---|
| 0.5 µL | 1.44 mm | 0.52 mm | 0.07 | 71.5° | −0.5° |
| 1 µL | 1.82 mm | 0.65 mm | 0.11 | 71.2° | −0.8° |
| 2 µL | 2.30 mm | 0.82 mm | 0.18 | 70.7° | −1.3° |
| 5 µL | 3.14 mm | 1.09 mm | 0.34 | 69.6° | −2.4° |
| 10 µL | 3.99 mm | 1.35 mm | 0.54 | 68.3° | −3.7° |
| 50 µL | 7.05 mm | 2.13 mm | 1.69 | 62.2° | −9.8° |
Rules of thumb from the table: for the spherical-cap formula, keep water drops at about 1 µL or below (Bond number around 0.1); for the common 2–5 µL drops, use the tangent method or a Young–Laplace fit. Liquids with lower surface tension (oils, ethanol, diiodomethane) flatten more at the same volume. The formula also fails for any drop that is not axisymmetric: on a rough, patterned or chemically patchy surface, or a drop pinned on one side.
The ImageJ contact angle plugins: DropSnake and LB-ADSA
Two free plugins from the Biomedical Imaging Group at EPFL do the fitting for you; download them from the group's Drop Analysis page and put them in the plugins folder of ImageJ or Fiji, then restart.
- DropSnake (Stalder et al. 2006) fits a smooth B-spline curve (a "snake") to the drop edge, starting from a few points you click, and reads the angle at each contact point from the fitted curve. It assumes no particular shape, so it also works on drops that are not symmetrical, but it needs a clear edge.
- LB-ADSA, low-Bond axisymmetric drop shape analysis (Stalder et al. 2010), fits the Young–Laplace equation (with a first-order correction for gravity) to the whole outline of an axisymmetric sessile drop, and gives the contact angle and an estimate of the surface tension. It suits small, symmetric drops, the same regime as the Bond number table above, and it is less dependent on the few pixels near the contact point.
For routine measurements on many samples, a commercial goniometer with its own Young–Laplace fitting software is faster; the plugins are the free route when you have a camera, a light and a stage.
Taking a good drop photo
- Camera level with the surface, looking exactly along it. Tilting the camera down a few degrees shows the top of the surface and moves the apparent contact points.
- Backlight through a diffuser behind the drop, so the drop is dark and the edge sharp; no light from the front.
- Fill the frame with the drop and a stretch of baseline on both sides, with the edge in sharp focus.
- The same volume every time, dispensed gently from a fixed height; note it.
- Photograph at a fixed time after deposition (for example 10 s), because drops spread and evaporate. For advancing and receding angles, grow and shrink the drop with the needle in it, or tilt the stage.
Pitfalls
- Chord instead of tangent. The most common error, and always in the same direction for a convex drop: too low. On our drop, 63.6° instead of 72.0°.
- Wrong contact point. Mistaking the end of the reflection, or the blurred edge, for the contact point shifts the angle by several degrees. Find the waist where drop and reflection meet.
- A large drop with the cap formula. At 10 µL of water the formula is already 3.7° low.
- Left and right disagree. More than a few degrees apart: level the stage, check that the drop is not pinned, and report both.
- Too few drops. Contact angles scatter from drop to drop by a few degrees. Measure at least three to five drops per sample, in different places, and give the mean ± SD.
- Static is not the whole story. A single static angle sits somewhere between the advancing and receding angles; their difference (the hysteresis) says how sticky the surface is.
Reporting it
Static water contact angles were measured by the sessile drop method: [2] µL drops of [deionised water] were deposited on the [sample] at [22] °C and photographed from the side after [10] s with a [camera, lens] under diffuse backlighting. Angles were measured in [Fiji (ImageJ 1.54)] with the Angle tool along the tangent at both contact points [or: with the DropSnake plugin], and are given as the mean ± SD of [5] drops on [3] samples.
Cite ImageJ (Schneider et al. 2012) or Fiji (Schindelin et al. 2012), and the plugin you used.
An easier way: contact angle in LabCanvas
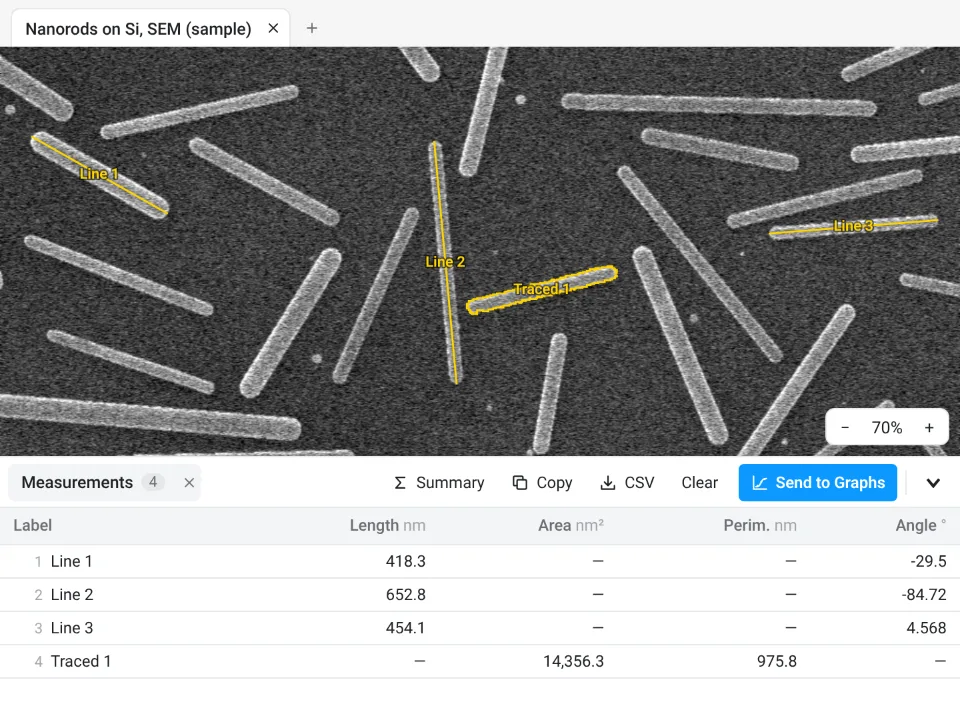
The same two methods work in the browser, with nothing to install, in LabCanvas Image Analysis. It has no dedicated contact-angle tool, but its straight Line tool gives every line a Length and an Angle in the Measurements table, in calibrated units.
- Open the drop photo and set the scale in Image › Scale: draw along a known length, type the Known distance and click Set scale.
- Tangent method: with the Line tool (L), drag from the left contact point up along the edge and click Measure. The Angle is from the horizontal, so on a level baseline it is the left contact angle; on the right side, drawn the same way, it is 180° minus the contact angle. On a tilted baseline, draw a line along it too and subtract its angle.
- Spherical-cap method: draw one line between the contact points (d) and one from the apex down to the baseline (h), select both and Measure; then
- Send to Graphs to plot the angles by sample or treatment, or Copy the table to a spreadsheet.
Why it is a good choice for drop photos:
- Nothing to install: it runs in the browser on any computer or tablet, so you can measure at the goniometer bench.
- ImageJ's own names: Length and Angle in the table, and it opens the RoiSet.zip of lines and angles you drew in ImageJ (angles come in as two-segment lines).
- Straight into Graphs: Send to Graphs plots the angles by sample without retyping, and Summary adds mean, SD and n rows to the table; each table also carries a methods sentence to copy.
- Free with a LabCanvas account: measuring, Copy and Send to Graphs are free; downloading CSV files is part of LabCanvas Pro. The measurements are checked in more than 4,000 automated tests.
LabCanvas does not fit drop shapes: for Young–Laplace fitting or snake-based contact points, use DropSnake or LB-ADSA in ImageJ or Fiji, or a goniometer's software. Open Image Analysis to try it on your own drop photos. ImageJ and Fiji are independent open-source projects; LabCanvas is not affiliated with them.
References
- Schindelin J, Arganda-Carreras I, Frise E, et al. (2012). Fiji: an open-source platform for biological-image analysis. Nature Methods 9, 676–682. doi:10.1038/nmeth.2019
- Schneider CA, Rasband WS, Eliceiri KW (2012). NIH Image to ImageJ: 25 years of image analysis. Nature Methods 9, 671–675. doi:10.1038/nmeth.2089
- Stalder AF, Kulik G, Sage D, Barbieri L, Hoffmann P (2006). A snake-based approach to accurate determination of both contact points and contact angles. Colloids and Surfaces A: Physicochemical and Engineering Aspects 286, 92–103. doi:10.1016/j.colsurfa.2006.03.008
- Stalder AF, Melchior T, Müller M, Sage D, Blu T, Unser M (2010). Low-bond axisymmetric drop shape analysis for surface tension and contact angle measurements of sessile drops. Colloids and Surfaces A: Physicochemical and Engineering Aspects 364, 72–81. doi:10.1016/j.colsurfa.2010.04.040
Frequently asked questions
How do I measure contact angle in ImageJ?
Open a side-view photo of the drop, pick the Angle tool in the toolbar, click a point on the baseline, then the contact point (where drop, solid and air meet), then a point on the tangent to the drop edge, and press M (Analyze › Measure). The Angle column gives the contact angle. Measure both sides and average them.
What is the spherical-cap formula for contact angle?
If the drop is a spherical cap,
Is there an ImageJ contact angle plugin?
Yes. DropSnake and LB-ADSA, from the Biomedical Imaging Group at EPFL, are free ImageJ plugins (Stalder et al. 2006 and 2010). DropSnake fits a smooth curve to the drop edge and reads the angle at each contact point; LB-ADSA fits the Young–Laplace equation to axisymmetric sessile drops and also estimates the surface tension.
When does the spherical-cap method fail?
When gravity flattens the drop, which depends on the Bond number,
Why do I get a different angle every time I draw the tangent?
The tangent is drawn by eye, right where the edge is blurred by the reflection and the meniscus. Zoom in to 400% or more, find the contact point first, and draw the tangent along the last few pixels of the edge, not to a point further up the drop: on our sample, a line to a point 0.24 mm up the edge read 63.6° instead of 72.0°.
What contact angle means hydrophobic?
By the usual convention, below 90° the surface is hydrophilic (water wets it), above 90° hydrophobic, and above about 150° superhydrophobic. Report the liquid, the drop volume and whether the angle is static, advancing or receding.
Try it in LabCanvas
Every app is free to start in your browser. Create an account and begin.
Start Image Analysis free in your browserKeep reading

ImageJ vs LabCanvas Image Analysis: an honest comparison
ImageJ/Fiji or LabCanvas Image Analysis? Six everyday jobs done in both, six newer ones (macros, vendor files, 3D, StarDist, big images) and which to use.

How to use ImageJ: a beginner's tutorial for the 10 everyday jobs (2026)
How to use ImageJ and Fiji: get started, open an image, then 10 everyday jobs (scale, measure, threshold, count, background, blots) with exact menu paths.

How to set the scale and add a scale bar in ImageJ (with a calibration image to practise on)
Set the scale in ImageJ (Analyze › Set Scale) from a micrometer, scale bar or pixel size, add a scale bar, and practise on a free calibration image.