Lateral size of 2D flakes (graphene, MoS₂) from SEM or TEM in ImageJ
Measure graphene or MoS₂ flake lateral size in ImageJ: scale, threshold, Analyze Particles with Feret diameter, edge flakes, overlaps and a size histogram.
Contents
To measure the lateral size of 2D flakes (graphene, MoS₂, h-BN) in ImageJ, set the scale, tick Area and Feret's diameter in Analyze › Set Measurements…, smooth the noise with a Gaussian blur, threshold the flakes and click Apply, fill holes, then run Analyze › Analyze Particles… with a minimum size and Exclude on edges ticked. The Feret column is each flake's lateral size (its longest dimension); Analyze › Distribution… turns it into a size histogram.
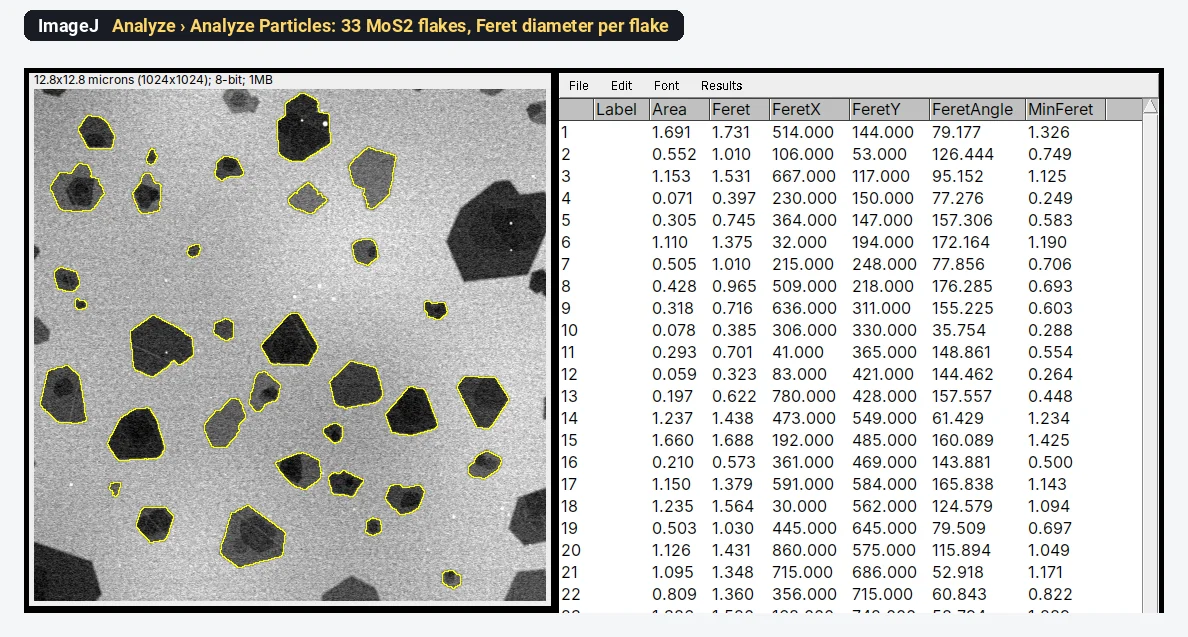
On the synthetic MoS₂ sample used below, this gives 33 whole flakes with a lateral size (Feret) of 1.011 ± 0.441 µm, from 0.323 to 1.731 µm.
What you need: ImageJ 1.x or Fiji (every command here is in both). An SEM or TEM image of flakes on a plain background, ideally a TIFF from the microscope with its pixel size. The example is a synthetic SEM image of exfoliated MoS₂ flakes on SiO₂/Si (1024 × 1024 pixels, 0.0125 µm per pixel), made for practice, with flakes of known shape. Time: about 10 minutes.
What "lateral size" means
Lateral size is the size of a flake in the plane of the substrate, not its thickness. Flakes are angular, so "size" can mean several things, and they differ by 20% or more on the same flake:
- Feret diameter (Feret's diameter, or maximum caliper): the longest distance across the flake. This is what most graphene and MoS₂ papers call the lateral size or length, L; liquid-exfoliation studies such as Backes et al. (2014) measure the longest dimension of each nanosheet in TEM.
- MinFeret: the narrowest width, as if measured with calipers.
- Equivalent circle diameter (ECD): the diameter of a circle with the same area,
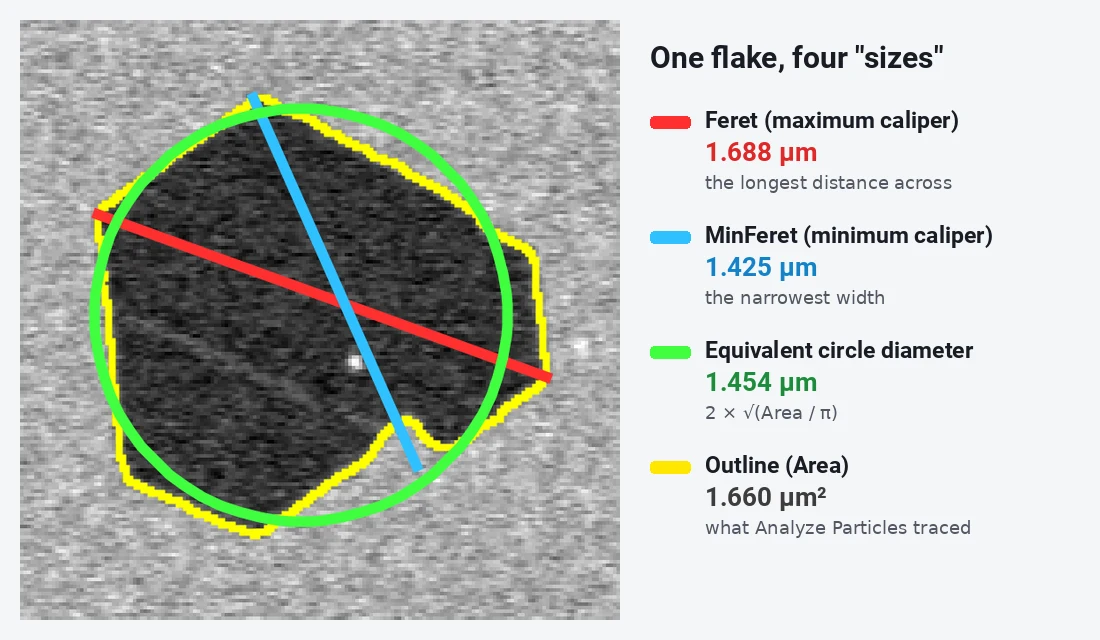
Pick one before you start, name it in the paper, and keep it the same for every sample. This guide uses the Feret diameter.
How do I measure flake size in ImageJ? Step by step
Step 1: Open the image
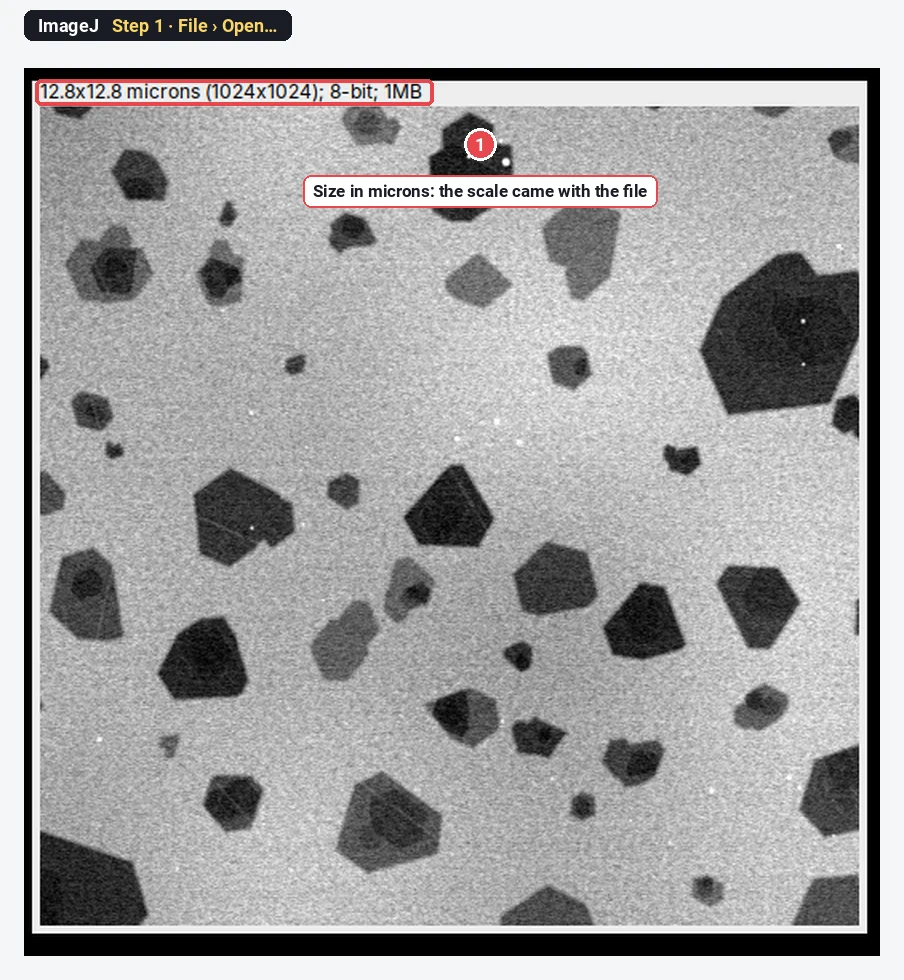
Click File › Open… and choose your TIFF. The line above the image shows its size in calibrated units: here 12.8x12.8 microns (1024x1024). If it says pixels instead, the file has no scale and Step 2 matters.
Step 2: Check the scale
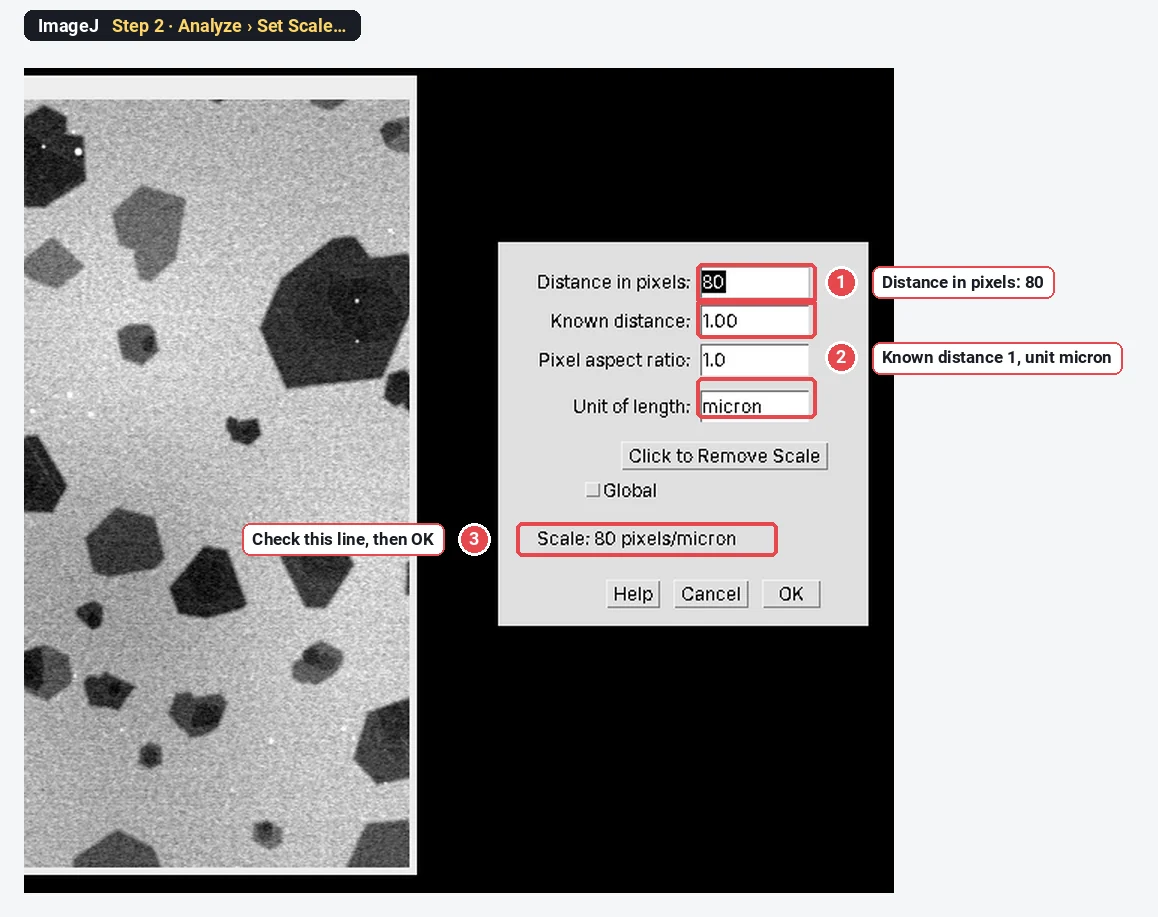
Click Analyze › Set Scale…. For this file it reads Distance in pixels: 80, Known distance: 1, Unit of length: micron, so 80 pixels = 1 µm. Click OK.
If your image has no scale, draw a line along the scale bar first with the straight-line tool, then open Set Scale: the distance in pixels is filled in, and you type the bar's length and unit. How to set the scale in ImageJ shows this in detail.
Step 3: Choose what to measure
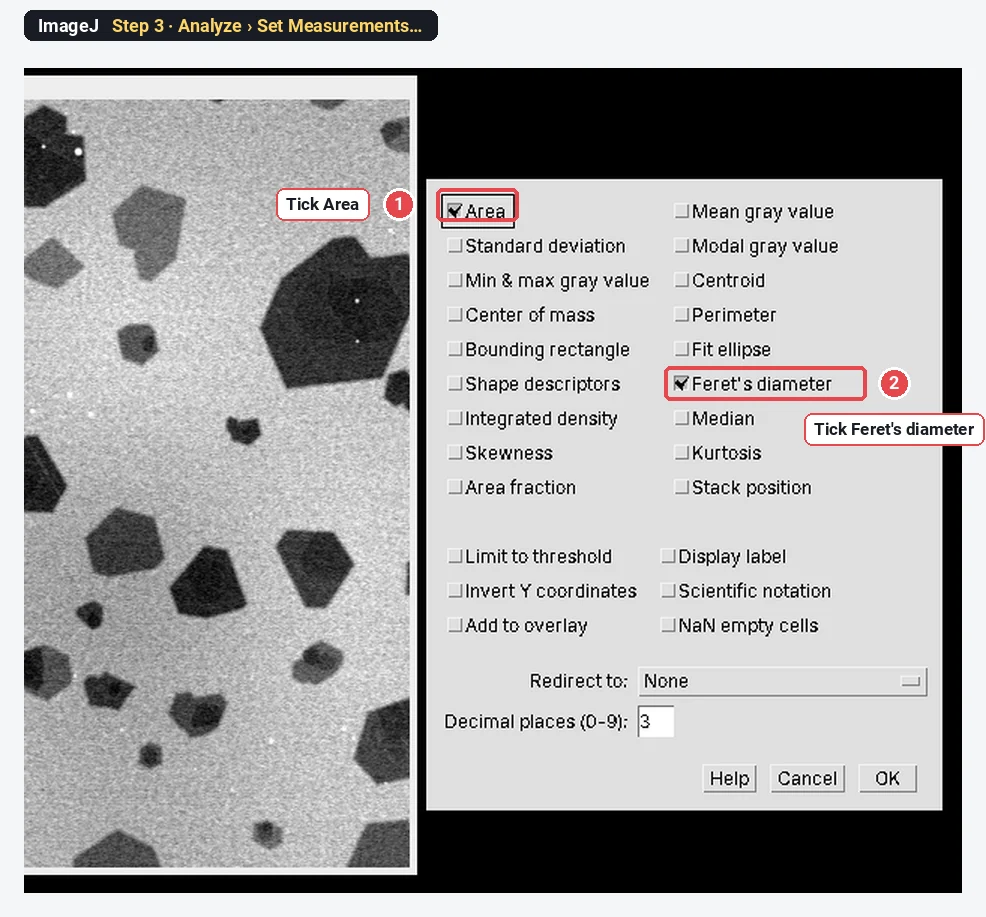
Click Analyze › Set Measurements…. Tick Area and Feret's diameter, and click OK. Feret's diameter adds five columns: Feret, FeretX, FeretY, FeretAngle and MinFeret. Tick Shape descriptors too if you want solidity to spot merged flakes (see below).
Step 4: Make a copy and smooth the noise
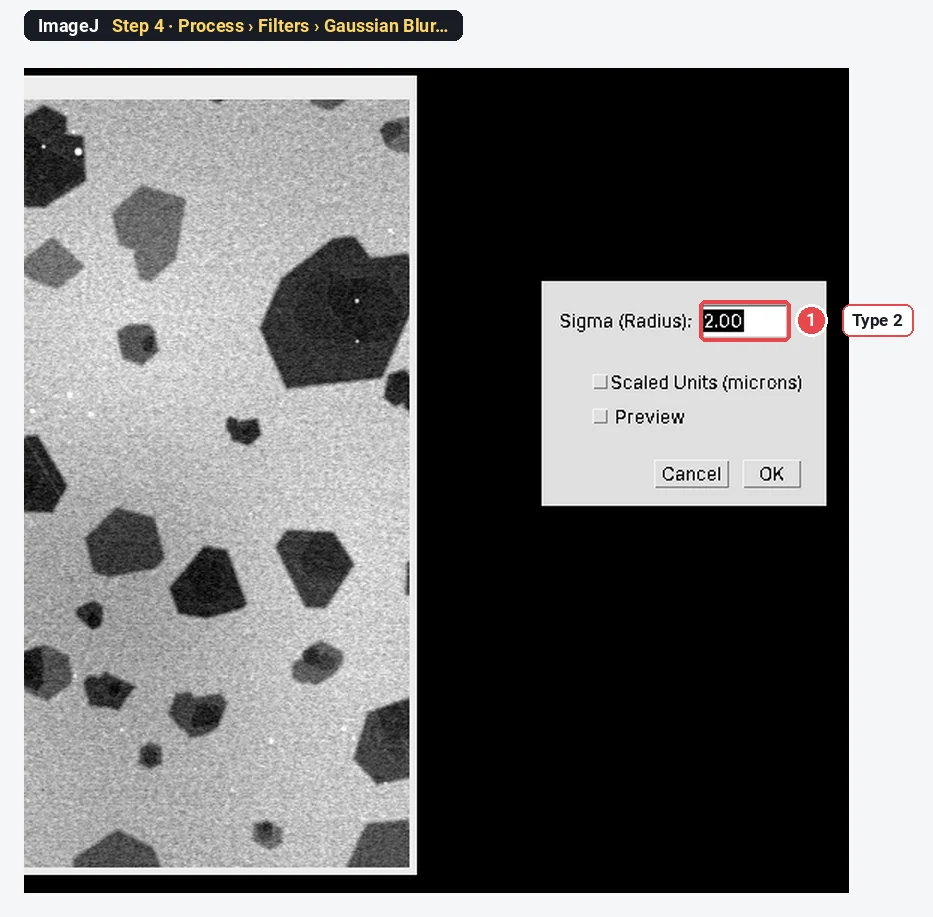
Click Image › Duplicate… and OK, so the original stays untouched. On the copy, click Process › Filters › Gaussian Blur…, type 2 in Sigma (Radius) and click OK.
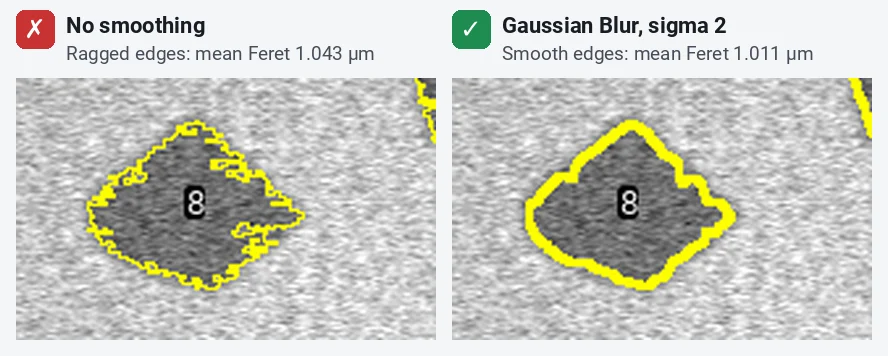
SEM images are grainy. Without smoothing, the noise makes the flake edges ragged, and ragged edges make the Feret diameter a little too long.
Step 5: Threshold the flakes
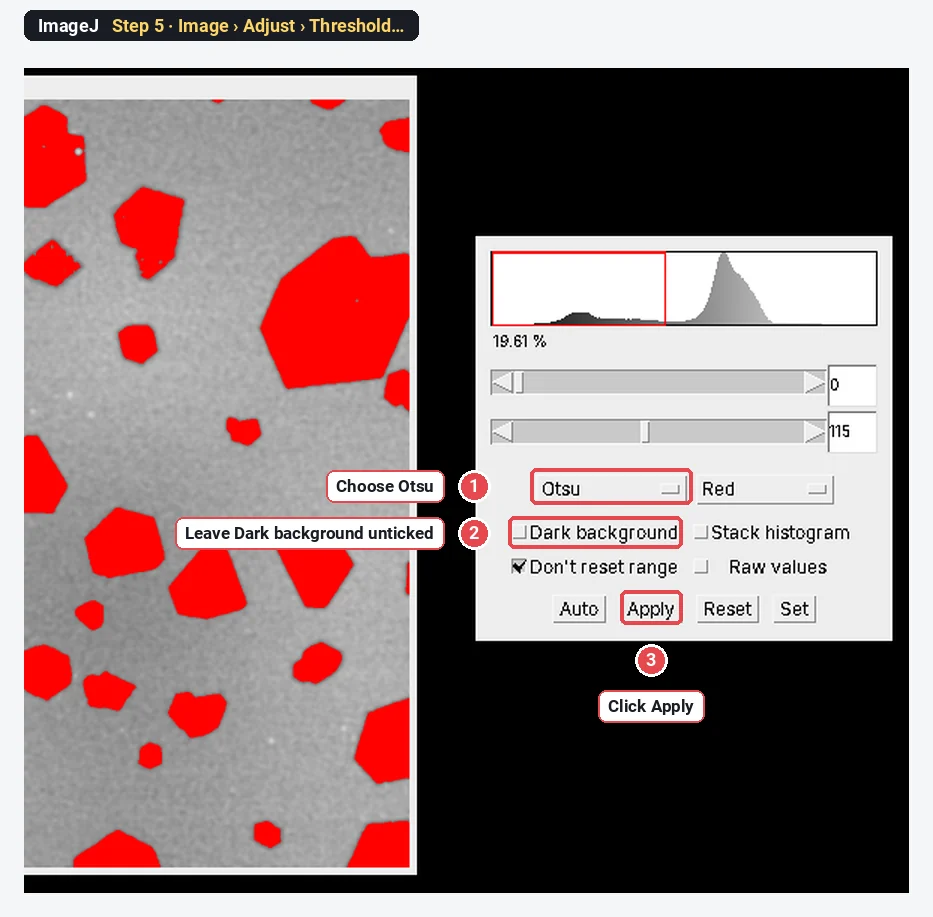
Click Image › Adjust › Threshold…. Choose Otsu in the first list and leave Dark background unticked, because here the flakes are darker than the substrate. The flakes turn red. Check that every flake is red, including the thin light-grey ones, and that the substrate is not. Then click Apply.
ImageJ sets the range to 0–115 here. On a TEM image, where flakes are also dark on a bright background, the same settings work; on a bright-flake image, tick Dark background.
Step 6: Fill the holes
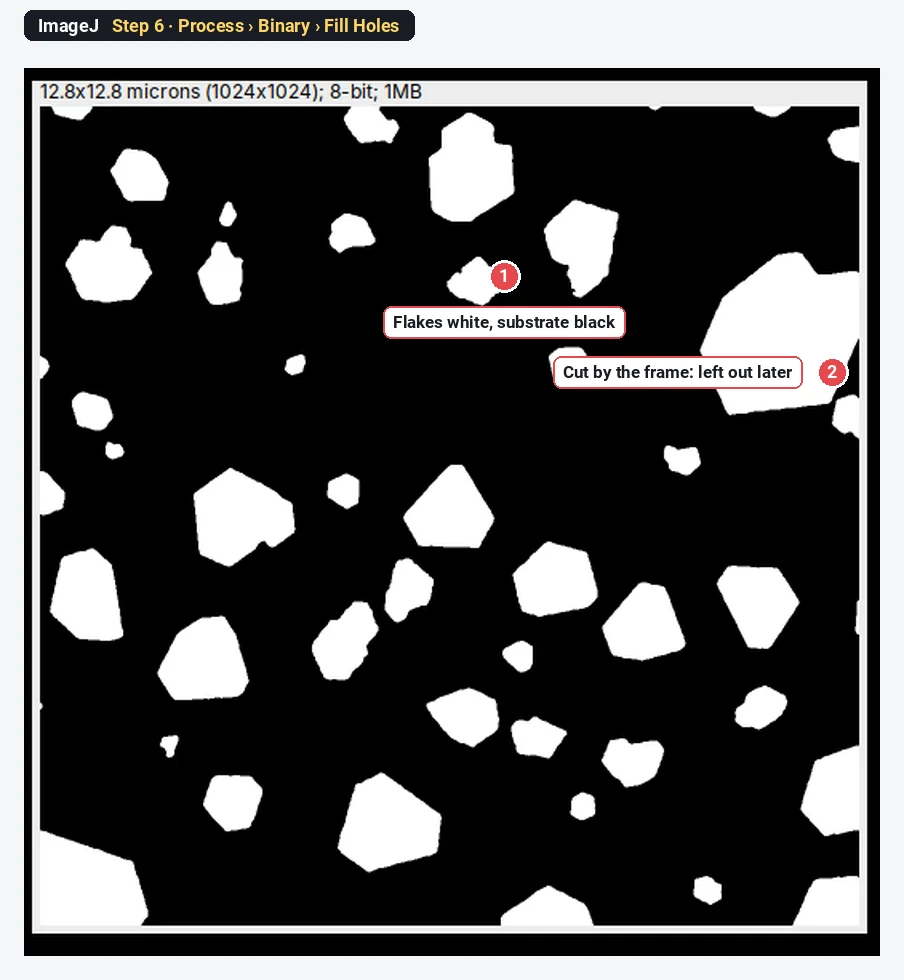
The copy is now a black-and-white mask: flakes white, substrate black. Click Process › Binary › Fill Holes, so that a bright speck or a thin patch inside a flake does not punch a hole in it.
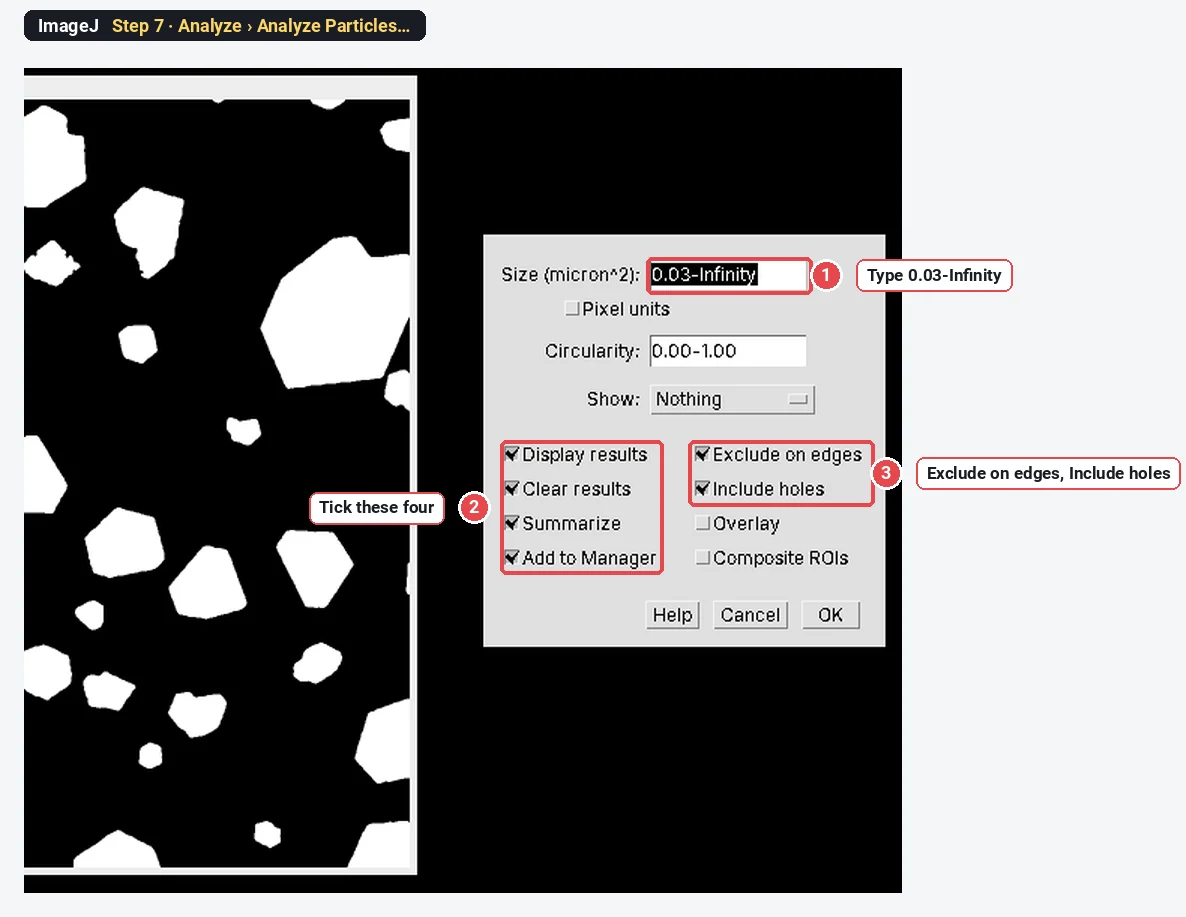
Step 7: Analyze Particles
Click Analyze › Analyze Particles… and set:
| Setting | Value | Why |
|---|---|---|
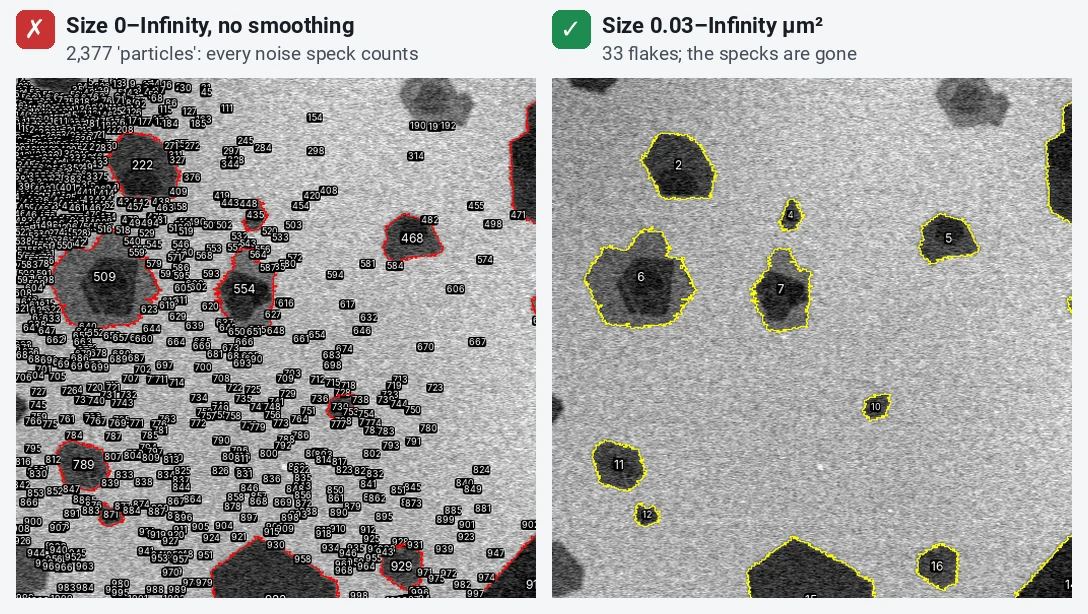
| Size (micron^2) | 0.03-Infinity | Drops noise specks; 0.03 µm² is about 190 pixels here |
| Circularity | 0.00-1.00 | Keeps every shape; flakes are not round |
| Show | Nothing | The outlines go to the ROI Manager instead |
| Display results, Clear results, Summarize | Ticked | One row per flake, and the count |
| Exclude on edges | Ticked | Flakes cut by the frame would be measured too small |
| Include holes | Ticked | Measures each flake whole |
| Add to Manager | Ticked | To see the outlines on the original |
Click OK.
Step 8: Read the numbers and check the outlines
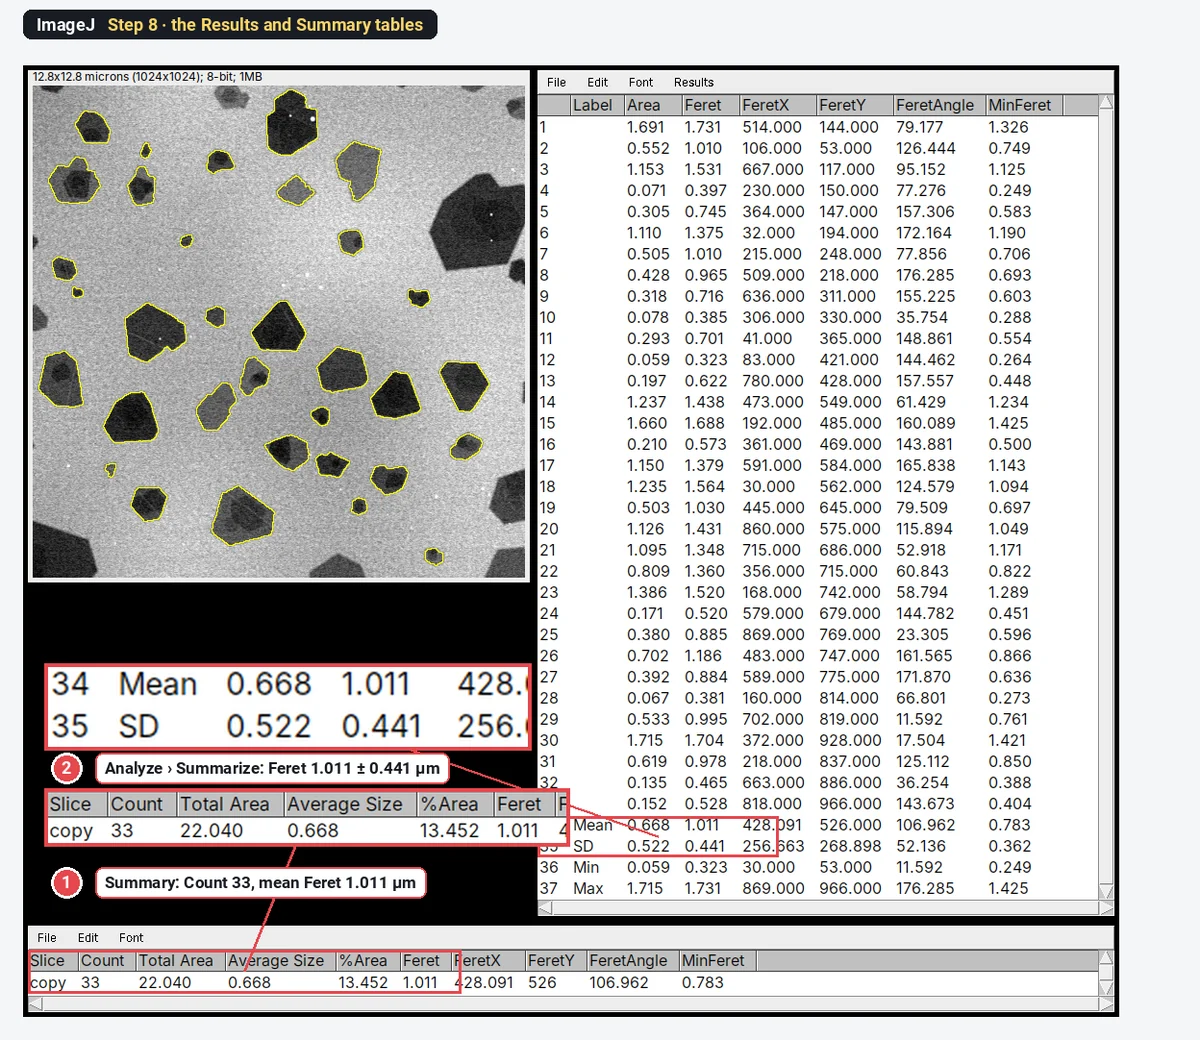
The Summary window gives the count (33) and the mean of each column: Feret 1.011 µm. The Results table has one row per flake. For the standard deviation, click Analyze › Summarize with the Results table in front: it adds Mean, SD, Min and Max rows.
Then click the original image and Show All in the ROI Manager. Every outline should sit on the edge of one flake. This is the check that matters most.
Step 9: Make the size histogram
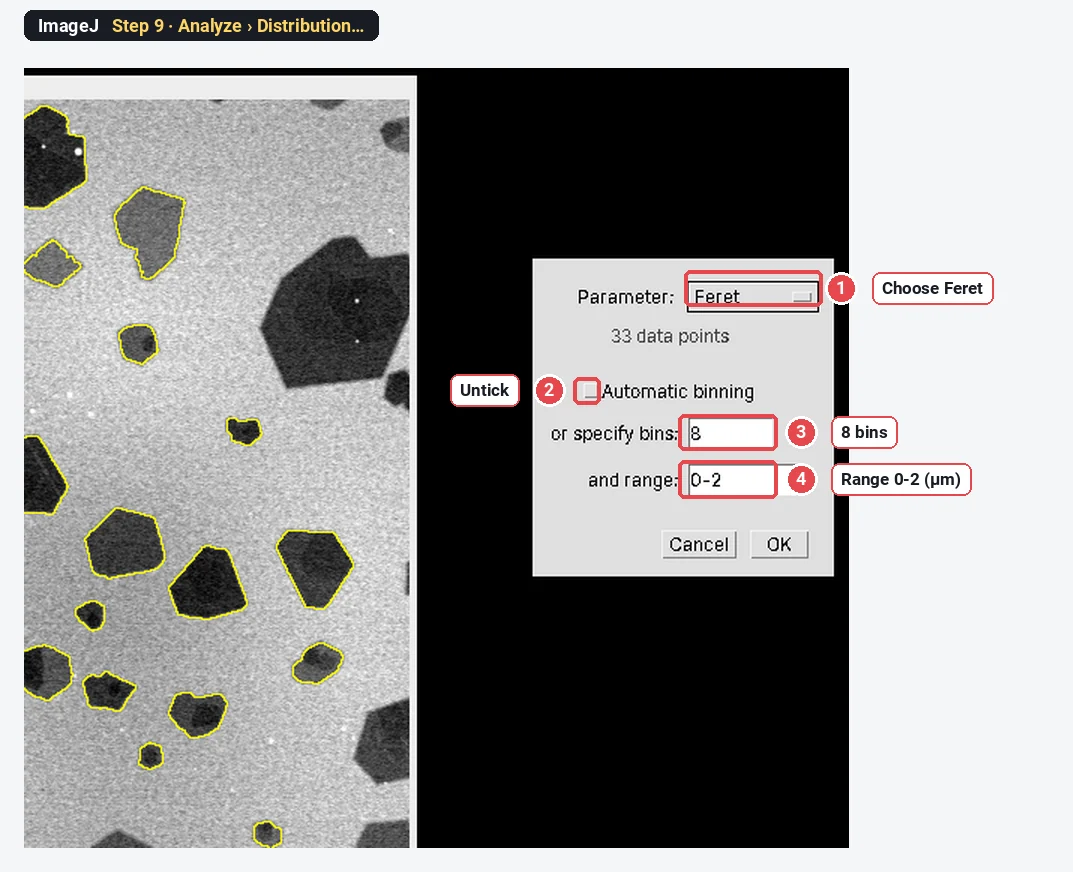
Click Analyze › Distribution… with the Results table open. Choose Feret as the Parameter, untick Automatic binning, type 8 bins and a range of 0-2, and click OK. Each bar is then 0.25 µm wide.
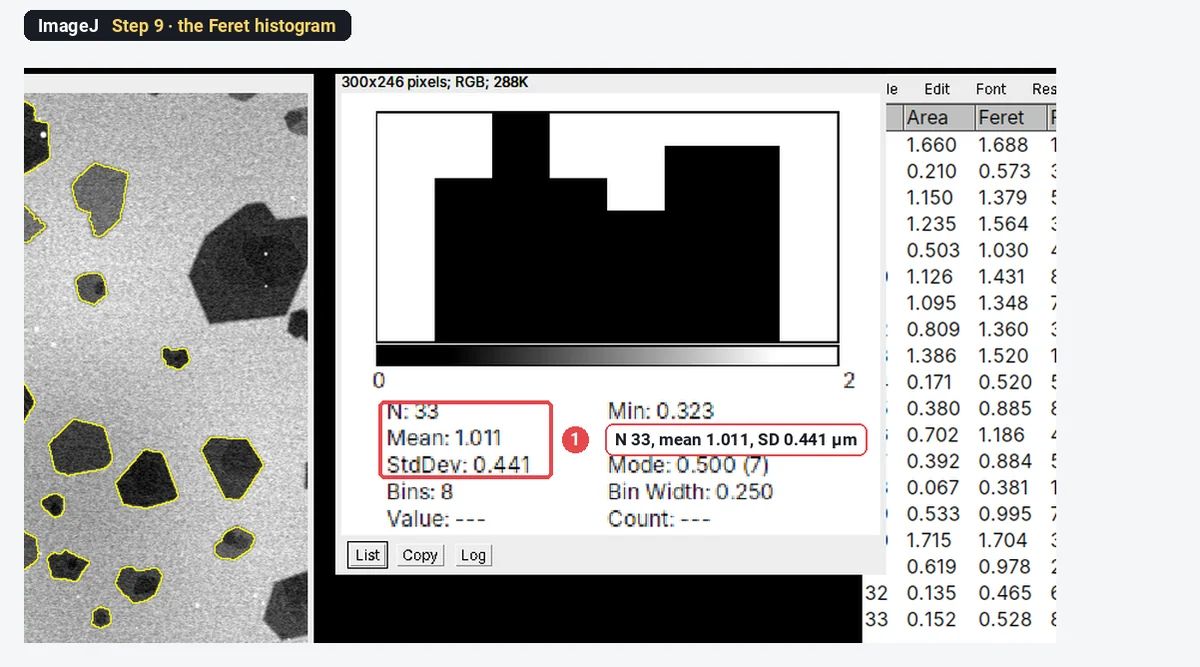
ImageJ's histogram is quick but plain. For a figure, copy the Feret column (Edit › Copy in the Results window, or File › Save As… for a CSV) into your plotting program and draw it with axis labels and the number of flakes.
The result on the sample
| Measure | Mean ± SD (µm) | Range (µm) |
|---|---|---|
| Feret (lateral size) | 1.011 ± 0.441 | 0.323–1.731 |
| MinFeret (width) | 0.783 ± 0.362 | 0.249–1.425 |
| Equivalent circle diameter | 0.845 ± 0.376 | from the areas |
The median Feret is 0.995 µm. 33 flakes is enough to show the method, not enough for a paper: aim for 100 to 300 whole flakes from several fields, taken across the substrate rather than where it looks best.
Why exclude flakes that touch the edge?
A flake cut by the frame is measured smaller than it really is, and the big flakes are the ones most often cut. On the sample, unticking Exclude on edges gives 45 objects instead of 33. Twelve of them are pieces of flakes, and the SD jumps from 0.441 to 0.547 µm.
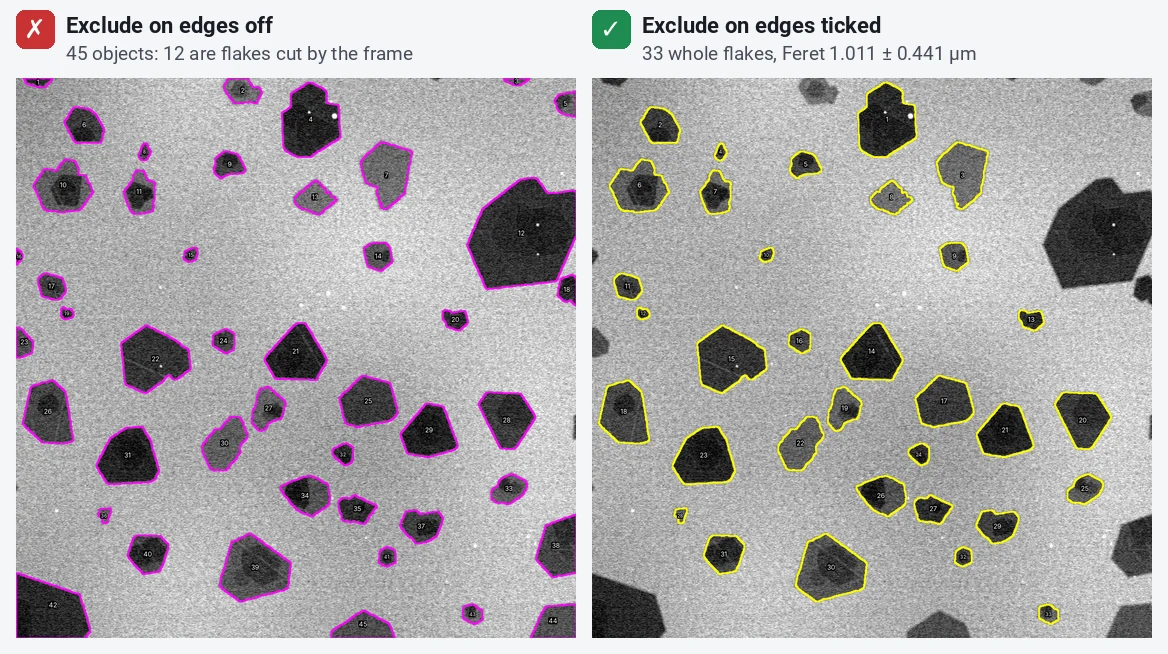
Excluding them biases the result slightly towards small flakes instead, because a big flake is more likely to touch the edge. With flakes much smaller than the field, as here, that bias is small. If your flakes are a large fraction of the field, image at a lower magnification.
Why does Analyze Particles find thousands of flakes?
Because every noise speck that passes the threshold is counted as a particle. On this image, without the blur and with a size of 0–Infinity, ImageJ finds 2,377 "particles"; with a minimum of 0.03 µm² it finds the 33 flakes. Set the minimum size to well below your smallest real flake, and check the outlines.
Does the Gaussian blur change the result?
A little, and for the better. Noise roughens the threshold edge, and a rough edge has spikes that make the longest distance across a flake too long. On this sample the mean Feret is 1.043 µm without the blur and 1.011 µm with it, about 3% less. The equivalent circle diameter does not move (0.845 µm both ways), because area is not sensitive to a ragged edge. A blur of 1–2 pixels is enough; a large blur rounds the corners and shrinks small flakes.
How do I handle overlapping and folded flakes?
Flakes that land on each other merge into one outline, and the Feret of the pair is far longer than either flake. In SEM the overlap shows up as a darker patch (twice the thickness) and the outline has a notch where two sets of straight edges meet. Folded flakes and terraces look similar.
- Look first. With the outlines shown on the original, scan for notched outlines with a darker inner region.
- Solidity helps. Tick Shape descriptors in Set Measurements: solidity is the area divided by the area of the convex hull. Single flakes sit near 0.95 here; a merged pair often scores lower. Sort the Results by Solidity and look at the lowest ones.
- Watershed is not the fix. Process › Binary › Watershed cuts round touching objects well but cuts angular flakes in the wrong place.
- Split or remove. To split a pair on the mask, draw a line between them with the line tool, set the foreground colour to black (Edit › Options › Colors…) and press Ctrl+D (Edit › Draw), then run Analyze Particles again. Or delete the merged outline in the ROI Manager. Either way, report how many you split or removed.
- Prevent it. A more dilute dispersion, or spin-coating instead of drop-casting, gives flakes that land apart.
Pitfalls
- Thin flakes missed. A monolayer may be only slightly darker than the substrate. If thin flakes come out ragged or half missing (as one or two do here), the threshold is cutting through them: try another method, raise the threshold a little, or improve the contrast at the microscope (lower kV in SEM often helps). Never measure only the high-contrast flakes; that biases towards thick ones.
- Uneven background. SEM images often get brighter or darker across the field. If the threshold catches the substrate in one corner, run Process › Subtract Background… (tick Light background for dark flakes) before thresholding.
- A JPEG or a screenshot. Compression adds blocks at the flake edges. Measure the TIFF from the microscope.
- Too few flakes. A size distribution needs hundreds of flakes. Use several fields and pool them; report the number.
- Mean of a skewed distribution. Flake sizes are usually skewed towards small flakes, and often close to log-normal. Give the median alongside the mean, or fit a log-normal and give its median and spread.
- Thickness is not lateral size. SEM contrast hints at thickness (thicker MoS₂ is darker), but it does not give the number of layers. Use AFM for thickness, or Raman: for graphene, the graphene Raman layer checker compares the 2D band width and I(2D)/I(G) with the NPL criteria.
Reporting it
A methods sentence to copy, with the parts in brackets filled in:
Flake lateral size was measured in [ImageJ 1.54f] on [SEM] images ([n] fields, [0.0125] µm per pixel): Gaussian blur (sigma [2] pixels), Otsu threshold, Fill Holes, then Analyze Particles with a minimum area of [0.03 µm²], excluding flakes touching the image border. Lateral size is the Feret diameter (maximum caliper). [Merged or overlapping flakes were removed by inspection ([k] of [N]).] Values are given as mean ± SD and median of [N] flakes.
Show the histogram with the number of flakes in the legend, or a cumulative distribution when comparing exfoliation conditions. Cite ImageJ (Schneider et al. 2012) or Fiji (Schindelin et al. 2012).
Switch to LabCanvas: flake size in a few clicks
The same measurement runs in LabCanvas Image Analysis in the browser, with nothing to install and no macros.
- Click Open an image and choose your SEM or TEM TIFF; the pixel size is read from the file.
- In the Measure tab, open Set measurements and tick Area and Feret's diameter.
- In the Count tab › Count particles: threshold Otsu, dark objects, Fill holes, Exclude particles on the edges, a minimum size, then Count.
- Click Send to Graphs on the Particles table for the histogram and the mean ± SD.
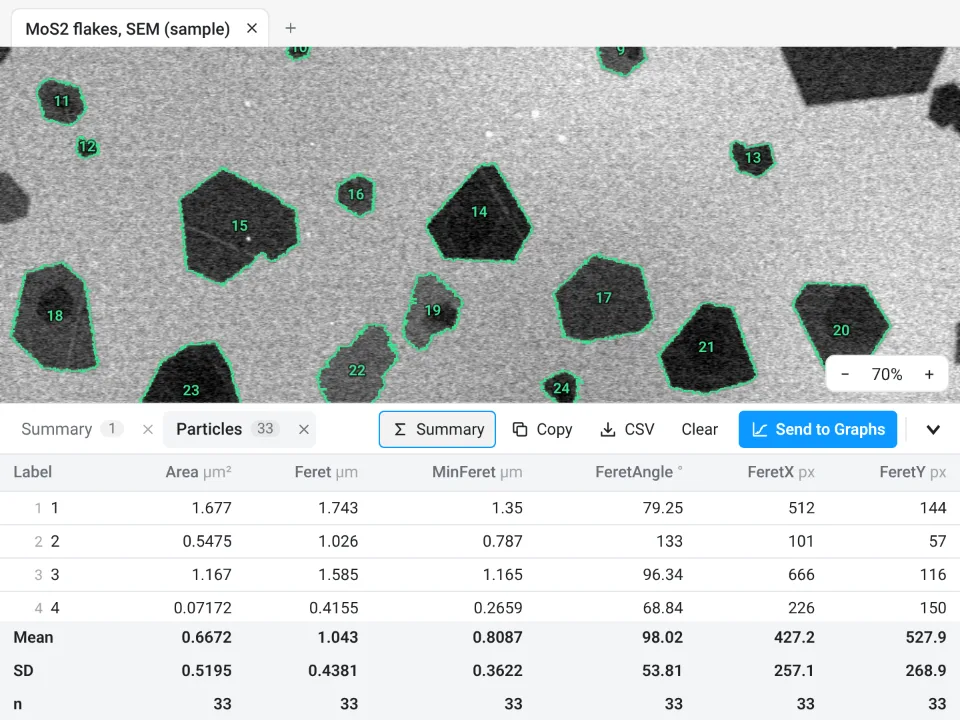
On the same MoS₂ image, LabCanvas counts 33 flakes, Feret 1.043 ± 0.4381 µm (Otsu, no blur, minimum 0.03 µm²). ImageJ with the same settings and no blur gives exactly the same: 33 flakes, 1.0428 ± 0.4381 µm. The 1.011 µm above is ImageJ after the Gaussian blur.
Why switch for flake sizes:
- No install and no plugins: it runs on any computer, so you can measure next to the microscope.
- Results straight to Graphs: the histogram, mean ± SD and a figure with a scale bar, with a methods sentence to copy.
- Validated: every measurement is checked against independent software in more than 4,000 automated tests.
Fiji stays better for very large batches with macros, for 3D, and for files in a maker's own format (.dm3, .emi, .czi), which LabCanvas needs as TIFF first.
Open Image Analysis: free with a LabCanvas account (downloading CSV and image files is part of LabCanvas Pro). ImageJ and Fiji are independent open-source projects; LabCanvas is not affiliated with them.
References
- Backes C, Smith RJ, McEvoy N, Berner NC, McCloskey D, Nerl HC, et al. (2014). Edge and confinement effects allow in situ measurement of size and thickness of liquid-exfoliated nanosheets. Nature Communications 5, 4576. doi:10.1038/ncomms5576
- Schindelin J, Arganda-Carreras I, Frise E, et al. (2012). Fiji: an open-source platform for biological-image analysis. Nature Methods 9, 676–682. doi:10.1038/nmeth.2019
- Schneider CA, Rasband WS, Eliceiri KW (2012). NIH Image to ImageJ: 25 years of image analysis. Nature Methods 9, 671–675. doi:10.1038/nmeth.2089
Frequently asked questions
What is the lateral size of a 2D flake?
The size of the flake in the plane of the substrate, as opposed to its thickness. Most papers report the longest dimension, which ImageJ gives as the Feret diameter (the maximum caliper). Some report the square root of the area or the equivalent circle diameter instead, so always say which one you used.
How do I measure flake size in ImageJ?
Set the scale (Analyze › Set Scale), tick Area and Feret’s diameter in Analyze › Set Measurements, smooth the noise with Process › Filters › Gaussian Blur (sigma 2), threshold the flakes with Image › Adjust › Threshold and click Apply, run Process › Binary › Fill Holes, then Analyze › Analyze Particles with a minimum size, Exclude on edges and Display results ticked. The Feret column is the lateral size of each flake.
Should I use Feret diameter or equivalent circle diameter for flakes?
Feret diameter (the longest distance across) is the usual lateral size for flakes and nanosheets, because flakes are angular and often elongated. The equivalent circle diameter,
Why should flakes touching the edge of the image be excluded?
A flake cut by the frame is measured smaller than it is, and large flakes are more likely to be cut, so including them biases the size distribution. Tick Exclude on edges in Analyze Particles, and image enough fields to have at least a few hundred whole flakes.
How do I handle overlapping flakes in ImageJ?
Overlapping flakes merge into one outline, which inflates the Feret diameter. Watershed rarely cuts angular flakes in the right place. Look at the outlines over the image: split a merged pair by drawing a black line between them on the mask, or delete it from the ROI Manager and say how many you left out. Better, deposit a more dilute dispersion so that flakes land apart.
Can ImageJ measure flake thickness from SEM?
No. SEM contrast changes with thickness, so thicker flakes look darker, but it does not give the number of layers. Use AFM for thickness, or Raman spectroscopy for graphene layer number; for TEM, count the edge fringes of folded flakes.
Try it in LabCanvas
Every app is free to start in your browser. Create an account and begin.
Start Image Analysis free in your browserKeep reading

ImageJ vs LabCanvas Image Analysis: an honest comparison
ImageJ/Fiji or LabCanvas Image Analysis? Six everyday jobs done in both, six newer ones (macros, vendor files, 3D, StarDist, big images) and which to use.

How to use ImageJ: a beginner's tutorial for the 10 everyday jobs (2026)
How to use ImageJ and Fiji: get started, open an image, then 10 everyday jobs (scale, measure, threshold, count, background, blots) with exact menu paths.

How to set the scale and add a scale bar in ImageJ (with a calibration image to practise on)
Set the scale in ImageJ (Analyze › Set Scale) from a micrometer, scale bar or pixel size, add a scale bar, and practise on a free calibration image.