Stitch microscope tiles in Fiji (Grid/Collection stitching, step by step)
Stitch overlapping microscope tiles in Fiji with Grid/Collection stitching: grid type, overlap, file names, fusion, and why an ImageJ montage is wrong.
Contents
To stitch overlapping microscope tiles, use Fiji's Plugins › Stitching › Grid/Collection stitching: choose the Type (for example Grid: row-by-row) and Order (Right & Down), then enter the grid size, the Tile overlap [%], the folder and the file name pattern (such as tile_{ii}.tif), keep Compute overlap ticked and pick Linear Blending. The plugin finds the true shift between neighbours by phase correlation and fuses them into one image called Fused (Preibisch et al. 2009). Plain ImageJ 1.x cannot stitch: its Make Montage only puts tiles side by side.
This guide shows the problem in plain ImageJ with a set of tiles whose positions we know, measures one overlap by hand so you can see what the plugin does, and then gives every step and option of the Fiji plugin.
What you need: Fiji for the stitching itself (the Stitching plugin ships with it). Plain ImageJ 1.x is enough for the checks. A folder of tiles numbered in acquisition order. The example: nine synthetic tiles, 380 × 380 pixels each, cut on a 3 × 3 grid with a nominal 20% overlap from a synthetic SEM image of a perovskite film (8-bit, 2.5 nm per pixel), with a small known stage error added. Time: 15 minutes.
The stitching dialog is Fiji only and is described in text; every picture is ImageJ 1.54f.
Why can't I just put the tiles side by side?
A microscope moves the stage less than one field between tiles, so neighbouring tiles share a strip of the sample: the overlap. Placing whole tiles edge to edge shows that strip twice. The steps below make that montage in plain ImageJ so you can see it.
Step 1: Open the tiles as a stack
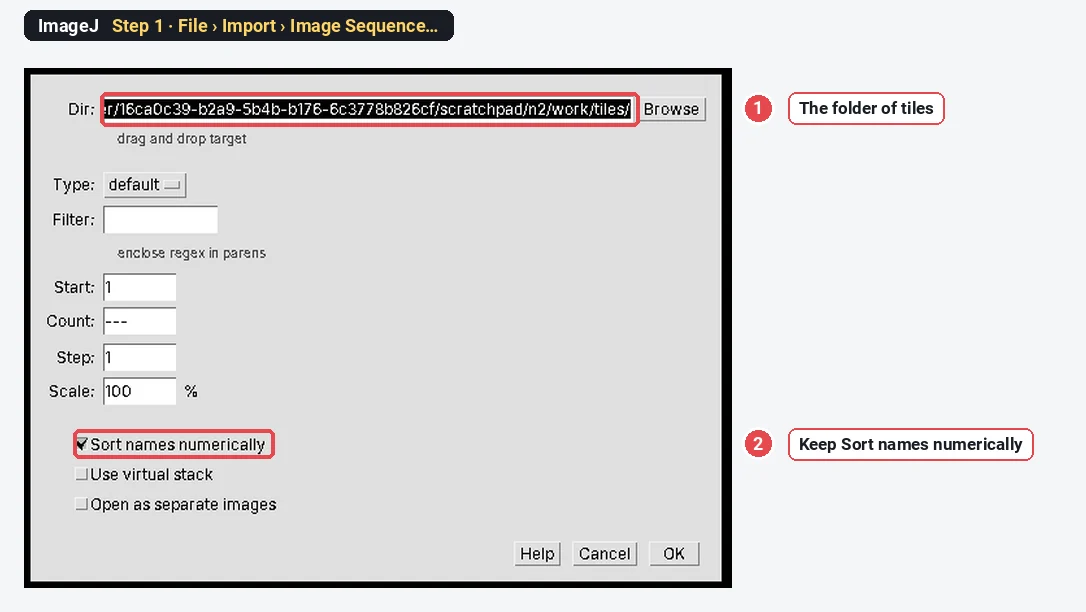
Choose File › Import › Image Sequence…, browse to the folder, keep Sort names numerically ticked and click OK. The nine tiles open as one stack, in file order.
Step 2: Make a montage
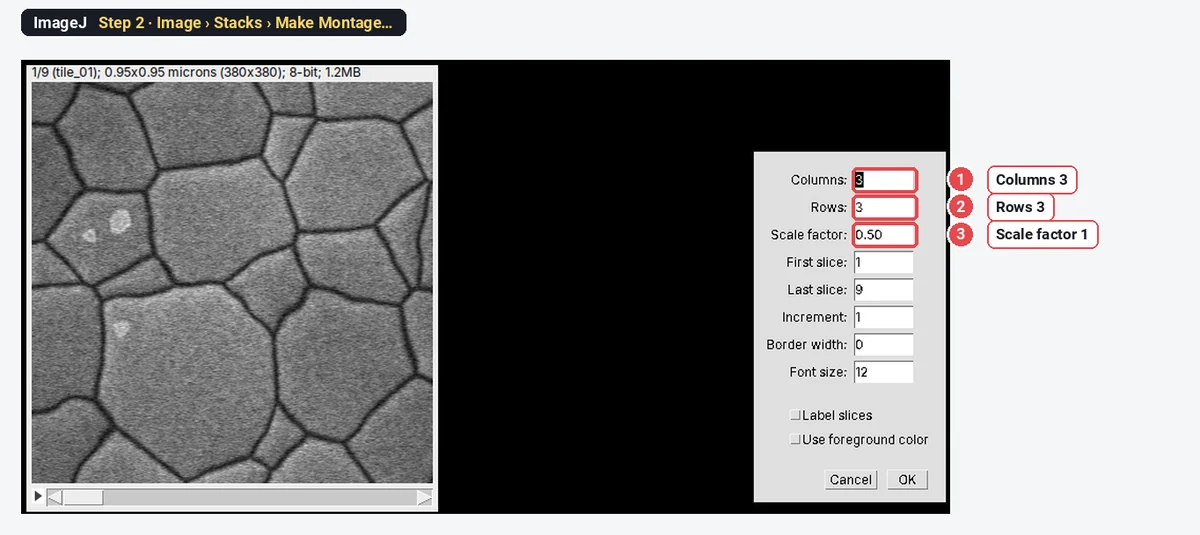
Choose Image › Stacks › Make Montage…. Type 3 columns and 3 rows, a Scale factor of 1, and click OK.
Step 3: Look at the seams
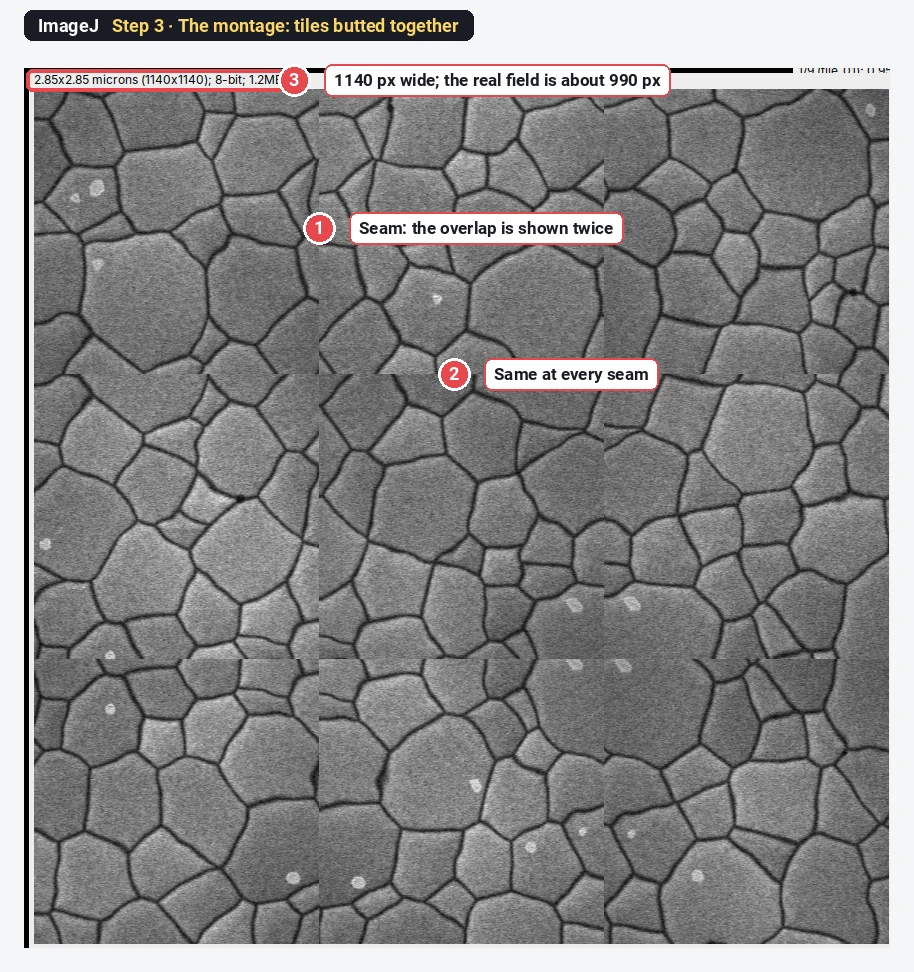
The montage is 1140 × 1140 pixels. The real field is about 990 pixels wide (380 + 302 + 306), so the montage is 15% too large, and at every seam the same grains appear twice. Any length, area or count measured across a seam is wrong.
Step 4: Find the overlap between two tiles
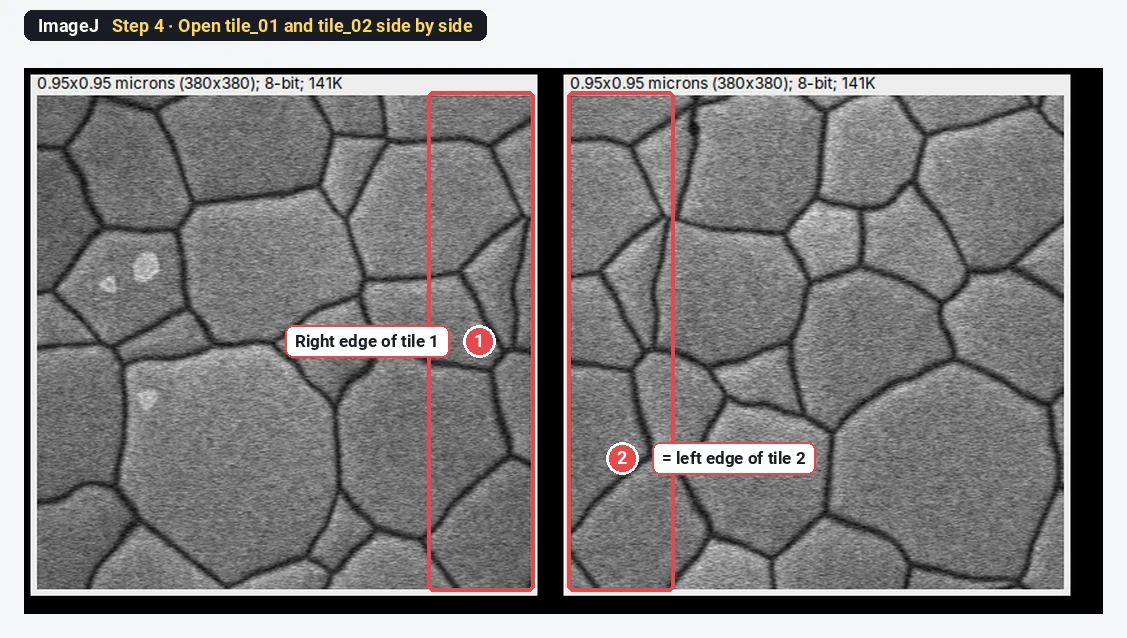
Open tile_01 and tile_02 next to each other. The right edge of tile 1 and the left edge of tile 2 show the same strip: here 78 pixels, about 20% of the tile width.
How does stitching find the overlap? Try it in plain ImageJ
Stitching plugins compare the overlapping strips and look for the shift that lines them up best. The Fiji plugin does this with the Fourier shift theorem (phase correlation) for every pair of neighbours, then finds the arrangement that fits all pairs at once. You can see the core of it with ImageJ's own FD Math, which needs square images of a power-of-2 size.
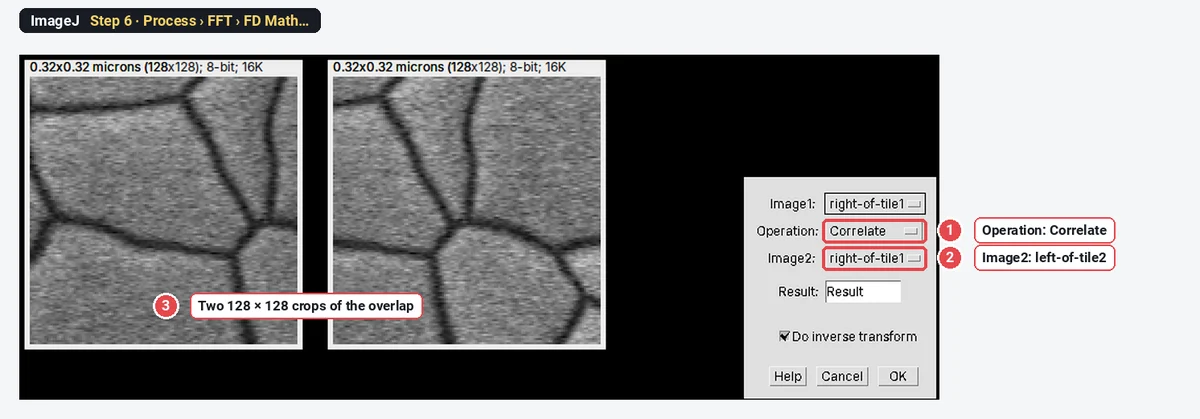
Step 5: Cut two crops from the overlap
On tile_01, choose Edit › Selection › Specify… with width 128, height 128, X 252, Y 126, and Image › Duplicate… it as right-of-tile1. On tile_02, do the same at X 0, Y 126 as left-of-tile2.
Step 6: Correlate them
Choose Process › FFT › FD Math…: Image1 right-of-tile1, Operation: Correlate, Image2 left-of-tile2, Do inverse transform ticked.
Step 7: Read the peak
Run Process › Find Maxima… on the result with a high Prominence and Output type: List. The peak sits at x 114, y 64. The centre of a 128-pixel result is 64, so the shift is 114 − 64 = 50 pixels in x and 0 in y.
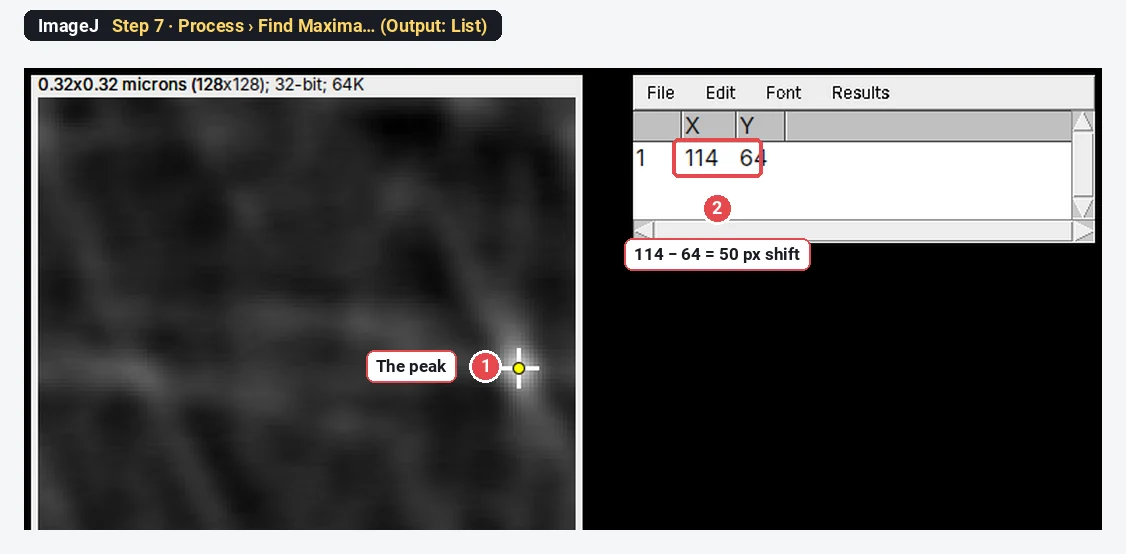
That single number is what the plugin computes for every neighbouring pair, with sub-pixel accuracy if you ask, before it fuses the tiles. Doing it by hand for a whole grid is not practical; the plugin is the tool.
Stitch the tiles in Fiji: Grid/Collection stitching
This part is Fiji only (the Stitching plugin is included in Fiji; plain ImageJ 1.x does not have it).
- Put all tiles in one folder, named with a running number in acquisition order: tile_01.tif, tile_02.tif … tile_09.tif.
- Choose Plugins › Stitching › Grid/Collection stitching.
- In the first dialog, choose Type and Order to match how the stage moved. For tiles that go left to right along each row, then down: Grid: row-by-row and Right & Down. Click OK.
- In the second dialog (titled Grid stitching: Grid: row-by-row, Right & Down), fill in: - Grid size x 3 and Grid size y 3; - Tile overlap [%] 20 (your nominal overlap); - First file index i 1; - Directory: the folder of tiles; - File names for tiles: tile_{ii}.tif. Each i stands for one digit, so {ii} matches 01 to 09 and {i} matches 1 to 9; - Output textfile name: TileConfiguration.txt; - Fusion method: Linear Blending; - leave Regression threshold 0.30, Max/avg displacement threshold 2.50 and Absolute displacement threshold 3.50; - tick Compute overlap (otherwise use approximate grid coordinates); tick Subpixel accuracy if you like; - Image output: Fuse and display.
- Click OK. The Log lists each pair it compared with its correlation, and the stitched image opens as Fused.
- Check the seams at full zoom, then save with File › Save As › Tiff…. The positions it found are saved next to the tiles as TileConfiguration.registered.txt.
| Option | What it does |
|---|---|
| Type: Grid (row-by-row, column-by-column, snake by rows, snake by columns) | Tiles on a regular grid, in that order |
| Type: Filename defined position | Row and column numbers in the file names, such as tile_x{xxx}_y{yyy}.tif |
| Type: Unknown position | No layout known: every tile is compared with every other (slow for many tiles) |
| Type: Positions from file | Positions from a TileConfiguration.txt, or from the stage positions in a multi-series file such as .czi or .lif |
| Tile overlap [%] | Your nominal overlap; the search for the true shift starts here |
| Fusion method | Linear Blending, Average, Median, Max. Intensity, Min. Intensity, Intensity of random input tile, or Do not fuse images (only write TileConfiguration) |
| Regression threshold | Pairs whose correlation is below this (0.30) are left out of the fit |
| Max/avg and Absolute displacement threshold | After the global fit, if the largest error is over 2.5 × the average error, or the average is over 3.5 pixels, the worst match is dropped and the fit is repeated |
| Compute overlap | On: find the shifts. Off: trust the grid coordinates |
| Subpixel accuracy | Shifts to a fraction of a pixel |
| Image output | Fuse and display, or Write to disk (for mosaics too large for memory) |
Order matters. If the microscope moved in a snake (left to right on row 1, right to left on row 2), choose Grid: snake by rows; a wrong order scrambles the mosaic even though each pair looks fine.
For very large or 3D tile scans, use BigStitcher (its own update site in Fiji), which works on data that do not fit in memory.
Pitfalls
- Wrong grid order. Row-by-row versus snake, Right & Down versus Left & Down: check how your microscope numbers tiles before you start.
- Blank overlaps. Correlation needs structure. Tiles that overlap on empty background drift; untick Compute overlap there, or use positions from the microscope.
- Uneven illumination. Vignetting makes a visible grid. Correct each tile with a flat-field image before stitching, or the seams and intensity steps end up in your measurements.
- Too little overlap. Below about 10% the correlation has little to work with; 15 to 20% is safer.
- Scale lost on saving. Save the fused image as TIFF and check Image › Properties…: the pixel size should be the same as in the tiles.
- Measuring across seams of a montage. Never measure a Make Montage result as if it were a mosaic: overlaps are counted twice.
Reporting it
Tiles ([3 × 3], [20]% nominal overlap) were stitched in Fiji with the Grid/Collection stitching plugin (Preibisch et al. 2009; grid row-by-row, overlap computed by phase correlation, regression threshold 0.30, linear blending). Measurements were made on the fused image.
Cite Fiji (Schindelin et al. 2012) as well.
Switch to LabCanvas: measure the stitched TIFF
LabCanvas Image Analysis has no stitching. Stitch in Fiji, save the Fused image as a TIFF, and measure it in the browser with nothing to install.
- Click Open an image and choose the stitched TIFF (BigTIFF files open too); the pixel size comes from the file.
- Look at the Image check: it flags uneven illumination across the field (above 1.3×), which is how a vignetted mosaic shows up.
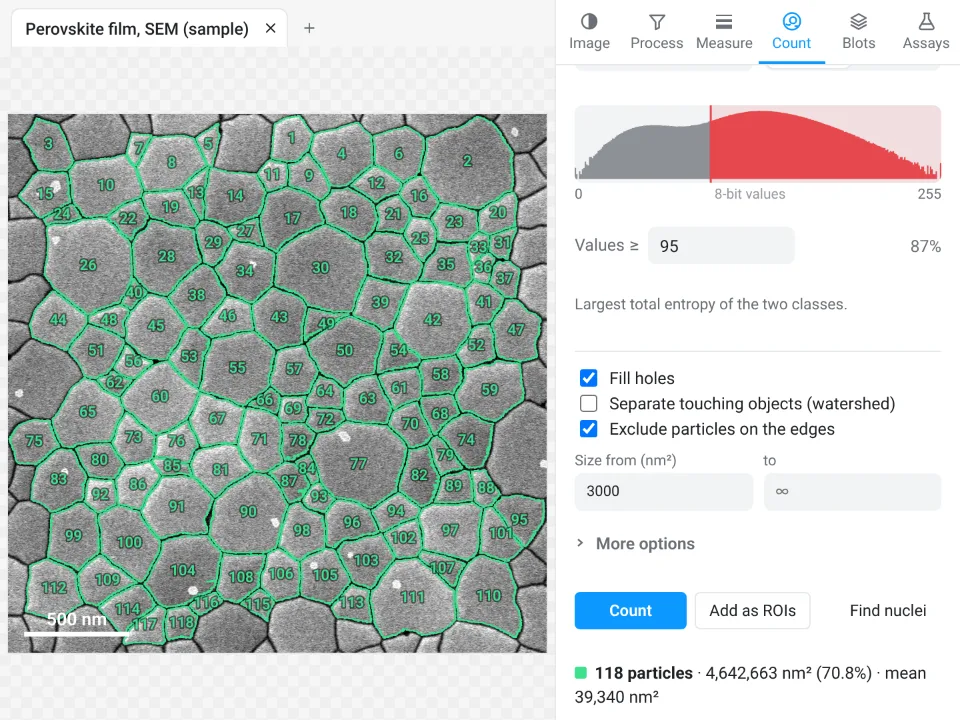
- In Count › Count particles, threshold the grains or cells, set the size range and Exclude particles on the edges, then Count.
- Send to Graphs for the size histogram and mean ± SD.
Why switch for the measuring:
- No install: the measuring runs in the browser on any computer, with ImageJ's names (Count particles is Analyze Particles).
- An image check first, so a mosaic with uneven light or clipped pixels is flagged before you count.
- Results straight to Graphs and a figure with a scale bar, with a methods sentence to copy.
Fiji stays the tool for the stitching itself.
Open Image Analysis: free with a LabCanvas account (downloading files is part of LabCanvas Pro). ImageJ and Fiji are independent open-source projects; LabCanvas is not affiliated with them.
References
- Preibisch S, Saalfeld S, Tomancak P (2009). Globally optimal stitching of tiled 3D microscopic image acquisitions. Bioinformatics 25, 1463–1465. doi:10.1093/bioinformatics/btp184
- Schindelin J, Arganda-Carreras I, Frise E, et al. (2012). Fiji: an open-source platform for biological-image analysis. Nature Methods 9, 676–682. doi:10.1038/nmeth.2019
Frequently asked questions
How do I stitch images in ImageJ?
Use Fiji: Plugins › Stitching › Grid/Collection stitching. Choose the grid type (for example Grid: row-by-row, Right & Down), then enter the grid size, the tile overlap in %, the folder and the file name pattern such as tile_{ii}.tif, keep Compute overlap ticked and choose Linear Blending. Plain ImageJ 1.x has no stitching command; its Make Montage only butts tiles together.
What overlap should tiles have for stitching?
Acquire with 10 to 20% overlap and enter that nominal value. The plugin then searches the overlap for the true shift with phase correlation, so the stage does not need to be exact, but the overlap must contain structure: blank background gives no correlation peak.
Why is my stitched image misaligned or doubled?
Usually the order or the overlap is wrong: check the grid type and order (row-by-row versus snake, Right & Down versus Left & Down), the tile overlap, and that the file numbering matches the pattern. If only some tiles jump, the overlap has too little detail; raise the regression threshold or untick Compute overlap to use the grid coordinates.
Can Make Montage stitch tiles?
No. Image › Stacks › Make Montage places whole tiles edge to edge, so every overlap is shown twice and the mosaic comes out too large: nine 380-pixel tiles with 20% overlap give a 1140-pixel montage for a field that is about 990 pixels wide.
What does Linear Blending do?
In the overlap, Linear Blending mixes the two tiles with weights that fade from one to the other, which hides small brightness differences such as vignetting. Average, Median, Max. Intensity and Min. Intensity are the other choices; for measuring intensities, check that the blend does not create a step.
How do I stitch a tile scan from a .czi or .lif file?
In Grid/Collection stitching choose the type Positions from file and the order Defined by image metadata; the plugin reads the stage positions from the multi-series file. For very large or 3D data sets, BigStitcher (its own update site) is the tool to use.
Try it in LabCanvas
Every app is free to start in your browser. Create an account and begin.
Start Image Analysis free in your browserKeep reading

ImageJ vs LabCanvas Image Analysis: an honest comparison
ImageJ/Fiji or LabCanvas Image Analysis? Six everyday jobs done in both, six newer ones (macros, vendor files, 3D, StarDist, big images) and which to use.

How to use ImageJ: a beginner's tutorial for the 10 everyday jobs (2026)
How to use ImageJ and Fiji: get started, open an image, then 10 everyday jobs (scale, measure, threshold, count, background, blots) with exact menu paths.

How to set the scale and add a scale bar in ImageJ (with a calibration image to practise on)
Set the scale in ImageJ (Analyze › Set Scale) from a micrometer, scale bar or pixel size, add a scale bar, and practise on a free calibration image.