Crop, rotate, resize and convert images in ImageJ (without changing your data by accident)
How to crop, rotate, resize, zoom and convert to 8-bit or grayscale in ImageJ, and what each command does to pixel values and the scale, measured.
Contents
To crop in ImageJ, drag a rectangle and choose Image › Crop; to rotate, use Image › Transform › Rotate 90 Degrees Right (lossless) or Rotate… for any angle; to resize, use Image › Adjust › Size… or Image › Scale…; to convert to grayscale, Image › Type › 8-bit; to zoom, press + and −. Crop, quarter-turn rotations and zoom keep every pixel value; free rotation, resizing and 8-bit conversion change them, and resizing also changes the pixel size.
This page does each command once on the same image and measures before and after (Analyze › Measure), so you can see exactly what changes. The numbers are from ImageJ 1.54f.
What you need: ImageJ 1.x or Fiji (the same menus in both). Any image with a known pixel size; we use our synthetic nuclei sample (a generated fluorescence image, 512 × 512 pixels, 16-bit, 0.325 µm per pixel). About 10 minutes.
Before you start: keep the original
Each of these commands changes the image in its window. Two habits keep your data safe:
- Duplicate first. Image › Duplicate… (Ctrl Shift D) makes a copy to edit; the original stays untouched in its own window.
- Never save over the raw file. Use File › Save As › Tiff… with a new name. File › Revert (Ctrl Shift R) goes back to the saved file if you have not saved yet.
Edit an image, step by step
Step 1: Measure the image as it is
Choose Analyze › Set Measurements… and tick Area, Mean gray value and Min & max gray value. Then choose Analyze › Measure (Ctrl M) with nothing selected. ImageJ measures the whole image and writes one row in the Results table: this is your baseline.
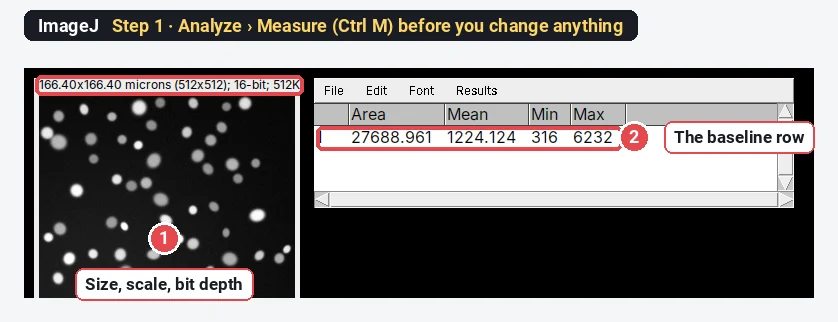
The area is 166.4 × 166.4 µm, because 512 pixels × 0.325 µm = 166.4 µm. If your image shows "pixels" instead of µm, set the scale first (see how to set the scale in ImageJ).
Step 2: Draw the crop box
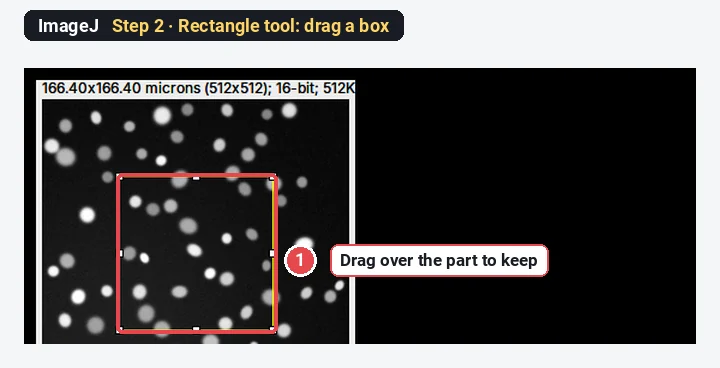
Click the Rectangle tool, the first icon in the toolbar. Drag a box over the part you want to keep. Drag the small handles to adjust it; hold Shift for a square. To type exact numbers, use Edit › Selection › Specify….
Step 3: Image › Crop
Choose Image › Crop (Ctrl Shift X). Everything outside the box is removed. Measure again.
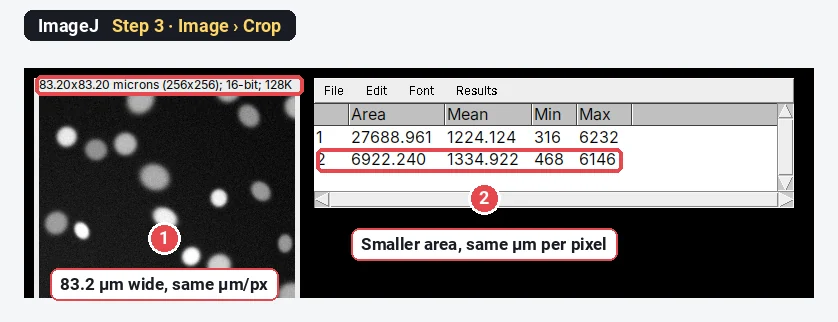
Crop is safe for measurements: the pixels you keep are the original ones, with the original scale.
Step 4: Image › Transform › Rotate…
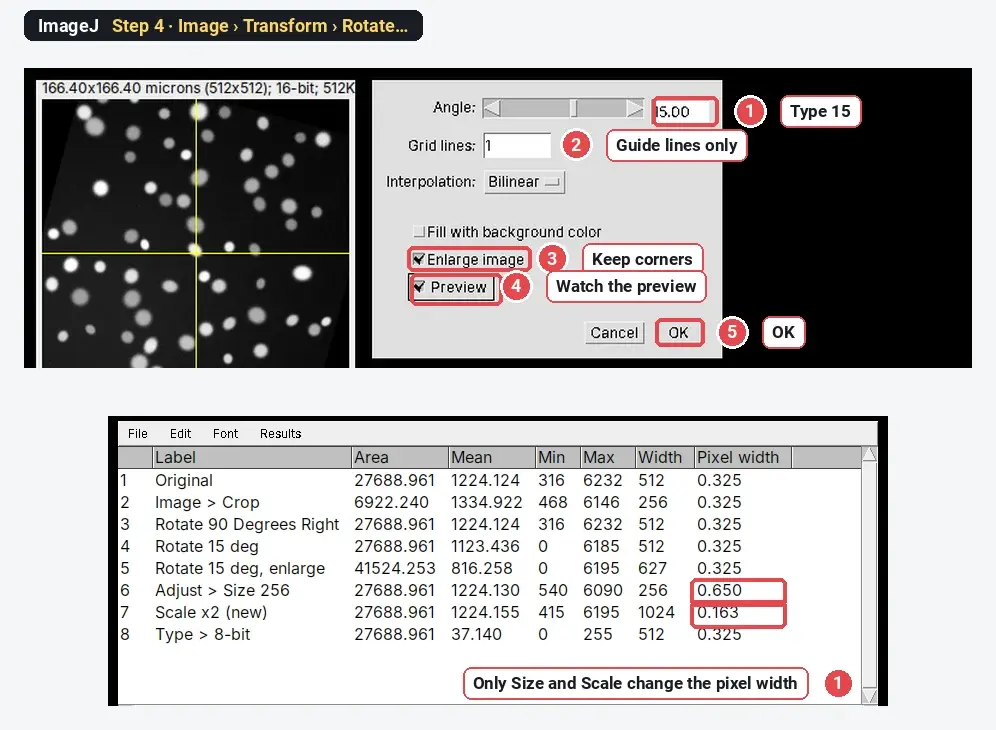
For a quarter turn, choose Image › Transform › Rotate 90 Degrees Right (or Left). For any other angle, choose Image › Transform › Rotate…, type the Angle (15 here), pick Interpolation (Bilinear is a good default), tick Enlarge image so the corners are not cut off, and tick Preview to see it before you click OK. Grid lines draws a guide to help you straighten the image; the lines are not added to it.
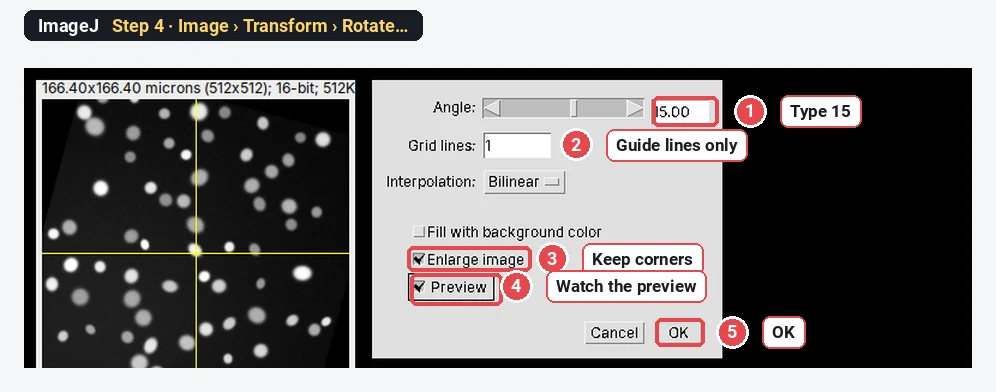
What it does to the numbers:
| Command | Size (px) | Mean | Max | What changed |
|---|---|---|---|---|
| Original | 512 × 512 | 1224.124 | 6232 | |
| Rotate 90 Degrees Right | 512 × 512 | 1224.124 | 6232 | Nothing: pixels are only moved |
| Rotate… 15°, no Enlarge | 512 × 512 | 1123.436 | 6185 | Corners cut off and filled with 0; peaks smoothed |
| Rotate… 15°, Enlarge | 627 × 627 | 816.258 | 6195 | Bigger canvas filled with 0; peaks smoothed |
A free rotation computes every new pixel from its neighbours (interpolation), so the brightest values drop (6232 to 6185 or 6195) and the new corners are filled with 0, which pulls the mean down. Rotate to make a figure look straight; measure intensities on the original.
Step 5: Image › Adjust › Size…
To change the number of pixels, choose Image › Adjust › Size…. Type the new Width (pixels) (256 here, half the original), keep Constrain aspect ratio and Average when downsizing ticked, and click OK.
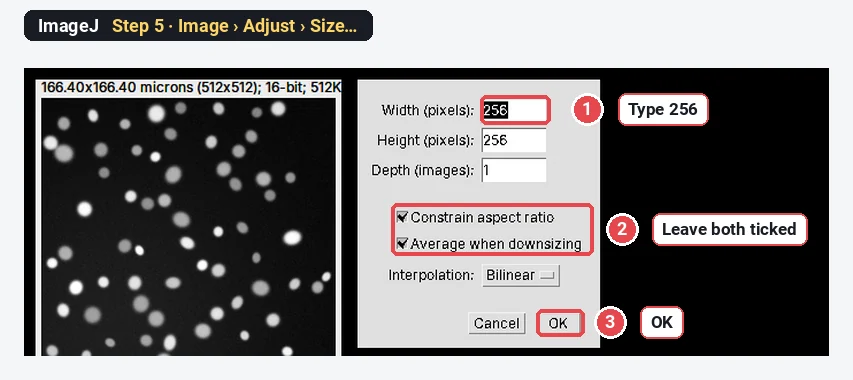
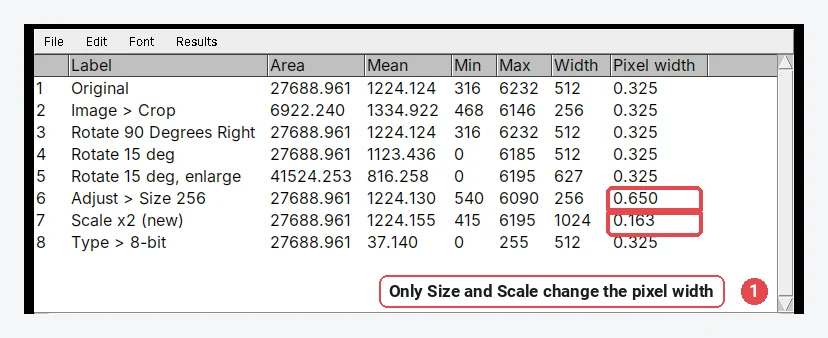
The image is now 256 × 256 pixels, and ImageJ changed the pixel width from 0.325 to 0.650 µm, so it still covers 166.4 µm and the area is still 27,688.961 µm². The mean barely moves (1224.130) but the extremes do (min 540, max 6090), because each new pixel is the average of four old ones.
Size vs Scale. Image › Scale… (Ctrl E) does the same resampling with a scale factor (0.5, or 2) and can put the result in a new window (Create new window), so the original is kept. We scaled by 2: 1024 × 1024 pixels at 0.1625 µm, area again 27,688.961 µm². Both commands adjust the calibration; what they cannot do is add detail. Upscaling makes more pixels, not more resolution.
Canvas Size is different. Image › Adjust › Canvas Size… adds or removes a border without resampling: the pixels and the pixel size stay as they were.
Step 6: Image › Type › 8-bit
Choose Image › Type › 8-bit. The image becomes 8-bit, with values from 0 to 255. Measure again.
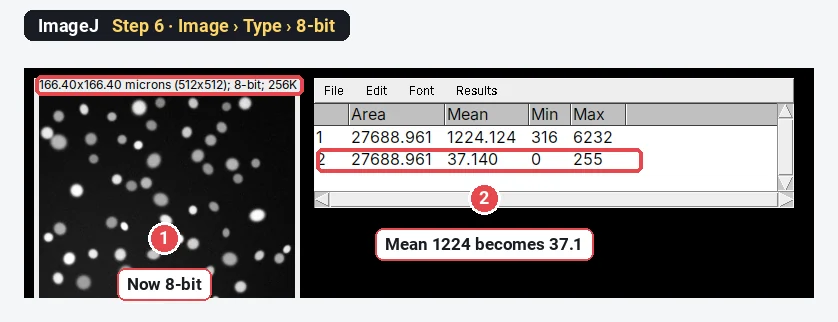
For a 16-bit image, ImageJ maps the current display range (what Brightness/Contrast shows, here 458 to 5736) onto 0–255. Everything below 458 becomes 0 and everything above 5736 becomes 255. So the result depends on how the image was displayed, and bright pixels can be clipped. Measure intensities on the original 16-bit image, and convert copies for display only. Edit › Options › Conversions › Scale when converting controls this; leave it ticked unless you know your values already fit 0–255.
Colour photos to grayscale. On an RGB image, Image › Type › 8-bit makes one grey channel. By default each grey value is (R + G + B) / 3. With Edit › Options › Conversions › Weighted RGB conversions ticked, ImageJ uses 0.299 R + 0.587 G + 0.114 B, closer to how bright the colours look. On our synthetic leaf photo the mean is 194.36 unweighted and 198.79 weighted, so say which you used. To keep the colours apart instead, use Image › Color › Split Channels.
Step 7: Zoom in and out
Press + to zoom in and − to zoom out, or use Image › Zoom › In and Out. The magnifying-glass tool zooms where you click (right-click or Alt-click zooms out). Image › Zoom › View 100% (Ctrl 5) shows one screen pixel per image pixel. The window title shows the zoom, for example "nuclei.tif (300%)".
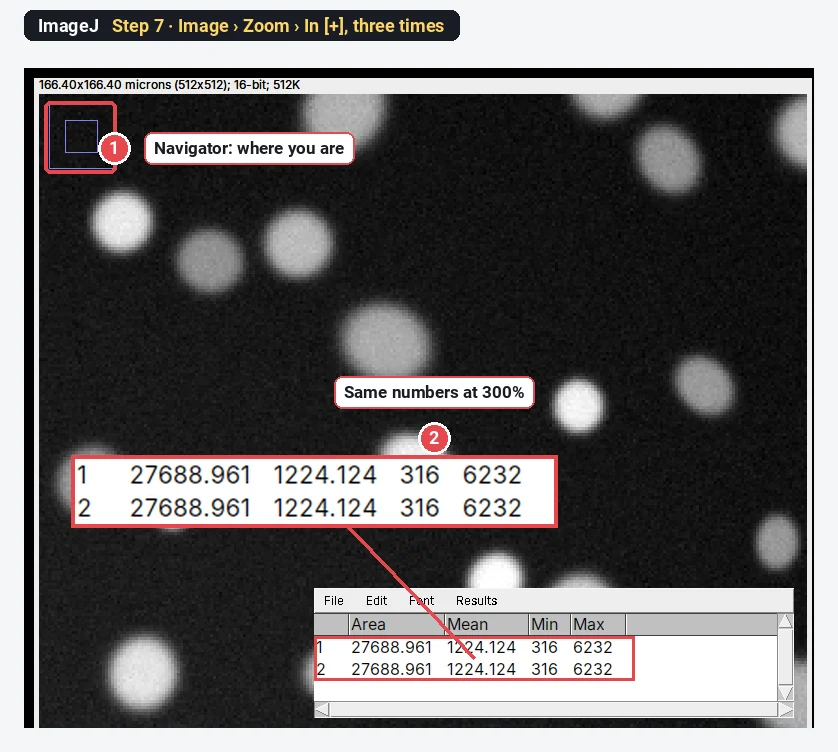
Zoom never touches the data. When you click points or draw lines at high zoom, you place them more precisely, which is the only way zoom affects a measurement.
All the commands, measured
Here is the same table from ImageJ, one row per command, with the image width and the pixel width added:
| Command | Pixel values | Pixel size (scale) | Safe before measuring? |
|---|---|---|---|
| Image › Crop | Kept | Kept | Yes |
| Rotate 90 Degrees Right / Left | Kept (moved) | Kept | Yes |
| Rotate… (any angle) | Interpolated, corners 0 | Kept | Not for intensities |
| Adjust › Size… / Scale… | Resampled | Changed to match | Not for intensities or small objects |
| Adjust › Canvas Size… | Kept, border added | Kept | Yes (border is 0 or background) |
| Type › 8-bit | Rescaled from the display range | Kept | No: may clip |
| Zoom | Kept | Kept | Yes |
How do I merge images in ImageJ?
"Merge" means two different things:
- Channels into one colour image (for example nuclei in blue and a protein in green): Image › Color › Merge Channels…, choose an image for each colour, tick Create composite. The values of each channel are kept. Step by step in merge channels in ImageJ.
- Images side by side: Image › Stacks › Tools › Combine… puts two images (or stacks) next to each other or one above the other. Image › Stacks › Images to Stack turns open images of the same size into one stack.
Pitfalls
- Converting before measuring. 8-bit conversion and free rotation change intensities. Measure the original, then make display copies.
- Resizing to "fit the figure". Resample only the copy for the figure, and resize in the figure software if you can.
- Losing the scale. Copying an image through the clipboard, or saving as JPEG or PNG from another program, can drop the pixel size. Check Image › Properties… (Ctrl Shift P) after any edit.
- Rotating a stack slice by slice. Rotate… asks whether to process the whole stack; say yes, or the slices will no longer line up.
- Saving as JPEG. JPEG compression changes pixel values. Save edited images as TIFF.
Reporting it
Images were cropped to the region of interest in ImageJ 1.54f (Image › Crop) without resampling; all measurements were made on the original 16-bit data. Images in Figure 2 were rotated by 15° (bilinear interpolation) and converted to 8-bit for display only.
Switch to LabCanvas: the same edits, with the raw data protected
In LabCanvas Image Analysis, in the browser, display changes never touch the measured values, and the commands that do change pixels are clearly separate.
- Crop: draw a rectangle, then Image › Stack and image › Crop to rectangle. The pixel size is kept.
- Bit depth: Process › Background and filters › Bit depth converts to 8-, 16- or 32-bit, scaled to the display range or not, and every Process step can go to a new image.
- Zoom: +, −, 0 (fit to window) and 1 (100%).
- Measure in the Measure tab; the methods sentence under the table states the pixel size used.
Why switch for this job:
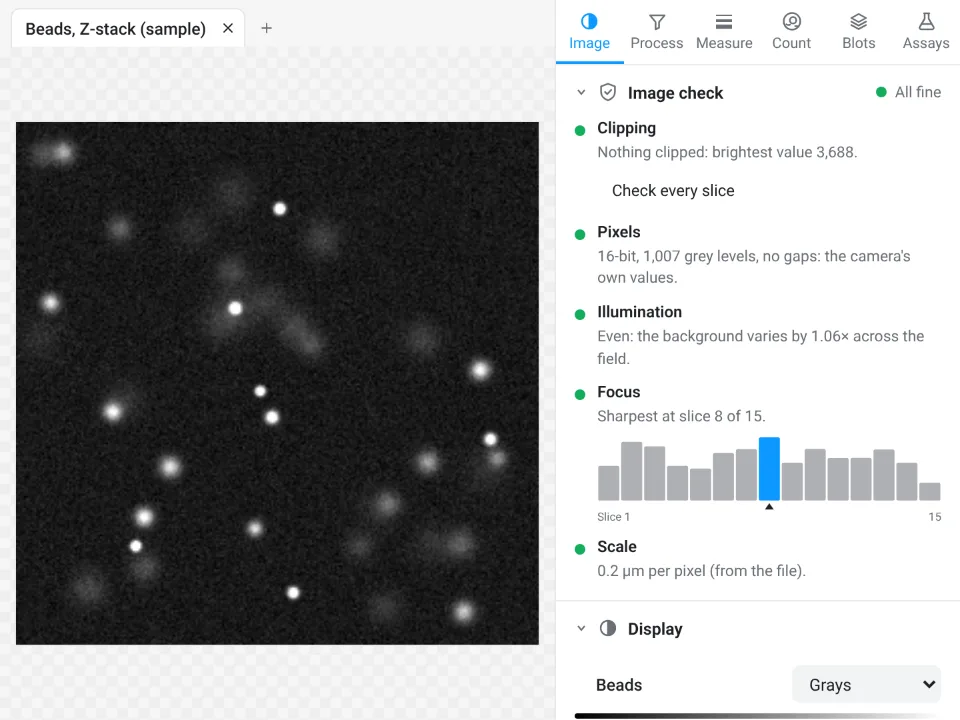
- An image check on every image warns when a file is a JPEG, a picture taken from a figure, or has clipped pixels, which are the usual signs that someone already edited it.
- Brightness and contrast never change the data: measurements read the raw 8-, 16- or 32-bit values.
- Figures with the scale bar: Add to a figure places the image as shown, scale bar included.
Free rotation and resizing are not in Image Analysis; for a figure, the Pixel editor crops and rotates images inside the figure itself. ImageJ remains the tool for resampling data and for batch conversions.
Open Image Analysis, free with a LabCanvas account (downloading files is part of Pro).
ImageJ and Fiji are independent open-source projects; LabCanvas is not affiliated with them.
References
- Schneider CA, Rasband WS, Eliceiri KW (2012). NIH Image to ImageJ: 25 years of image analysis. Nature Methods 9(7), 671–675. doi:10.1038/nmeth.2089
Frequently asked questions
How do I crop an image in ImageJ?
Pick the Rectangle tool (the first icon in the toolbar), drag a box over the part you want to keep, then choose Image › Crop (Ctrl Shift X). The pixel values and the pixel size stay the same; only the field of view gets smaller. Duplicate the image first (Image › Duplicate) if you still need the full frame.
How do I rotate an image in ImageJ?
For quarter turns, use Image › Transform › Rotate 90 Degrees Right or Left: nothing is resampled, so every pixel value is kept. For any other angle, use Image › Transform › Rotate…, type the angle, choose the interpolation and tick Enlarge image to keep the corners. That rotation interpolates new pixel values, so measure intensities on the unrotated image.
How do I resize an image in ImageJ without losing the scale?
Image › Adjust › Size… changes the image in place and Image › Scale… (Ctrl E) makes a resized copy; both adjust the pixel size so that distances and areas in µm stay correct. In our test, halving the nuclei image to 256 × 256 changed the pixel width from 0.325 to 0.65 µm and left the total area at 27,688.961 µm².
How do I convert an image to grayscale in ImageJ?
Choose Image › Type › 8-bit. For an RGB photo, ImageJ averages R, G and B ((R+G+B)/3) unless Edit › Options › Conversions › Weighted RGB conversions is ticked, which uses 0.299R + 0.587G + 0.114B. For a 16-bit image, 8-bit conversion maps the current display range to 0–255, so values outside it are clipped; measure intensities before converting.
How do I zoom in ImageJ?
Press + to zoom in and − to zoom out (Image › Zoom › In and Out), or click with the magnifying-glass tool. Image › Zoom › View 100% (Ctrl 5) shows one screen pixel per image pixel. Zooming only changes the view: measurements are identical at any zoom.
How do I merge two images in ImageJ?
To overlay channels in colour, use Image › Color › Merge Channels… and pick an image for each colour. To put images side by side, use Image › Stacks › Tools › Combine…; to make a stack from open images of the same size, Image › Stacks › Images to Stack.
Try it in LabCanvas
Every app is free to start in your browser. Create an account and begin.
Start Image Analysis free in your browserKeep reading

ImageJ vs LabCanvas Image Analysis: an honest comparison
ImageJ/Fiji or LabCanvas Image Analysis? Six everyday jobs done in both, six newer ones (macros, vendor files, 3D, StarDist, big images) and which to use.

How to use ImageJ: a beginner's tutorial for the 10 everyday jobs (2026)
How to use ImageJ and Fiji: get started, open an image, then 10 everyday jobs (scale, measure, threshold, count, background, blots) with exact menu paths.

How to set the scale and add a scale bar in ImageJ (with a calibration image to practise on)
Set the scale in ImageJ (Analyze › Set Scale) from a micrometer, scale bar or pixel size, add a scale bar, and practise on a free calibration image.