CellProfiler vs QuPath vs ImageJ: which image analysis software should you use?
CellProfiler, QuPath or ImageJ/Fiji? A fair comparison by job (batch cell measurements, whole slides, general analysis), with a nuclei count step by step.
Contents
Use CellProfiler when you need the same per-cell measurements from hundreds or thousands of images (screens, plates, time courses) without clicking through each one. Use QuPath for whole slide images and tissue sections: it opens huge slides, detects and classifies cells across them, and keeps everything in a project. Use ImageJ or Fiji for everything else: single images and stacks, trying things out, measurements of any kind, materials science, and the widest range of plugins.
All three are free and open source, and they are not rivals so much as tools for different jobs. Many labs use two of them.
What you need to follow the example: ImageJ 1.x or Fiji, and an image of stained nuclei. The example is a synthetic nuclei image (512 × 512 pixels, 0.325 µm per pixel, 16-bit) with 70 nuclei by design, made for practice. Time: 5 minutes in ImageJ.
The decision table
| ImageJ / Fiji | CellProfiler | QuPath | |
|---|---|---|---|
| Built for | General scientific image analysis | Measuring many images with one pipeline | Whole slide images and tissue (digital pathology) |
| Typical user | Anyone with an image to measure | Cell biologists, screening facilities | Pathologists, tissue biologists |
| Way of working | Menus on one image at a time; macros and scripts to repeat | A pipeline of modules, tested on one image, then run on all | A project of slides; detect, classify, measure, script in Groovy |
| Batch processing | With a macro or script | Built in: its main purpose | Built in: run a script on every image in the project |
| Whole slide images | Possible with plugins, not its strength | Not its focus | Its core: pyramidal slides open and pan smoothly |
| Cell detection | Threshold, watershed, Analyze Particles; StarDist, Cellpose and others as plugins | IdentifyPrimaryObjects (nuclei) and IdentifySecondaryObjects (cells); Cellpose as a plugin | Built-in nucleus detection with cell expansion; StarDist as an extension |
| Machine learning | Trainable Weka Segmentation, Labkit (Fiji) | CellProfiler Analyst for classifying cells | Interactive pixel and object classifiers |
| Beyond cells | Everything: materials, gels, particles, 3D, tracking | Mostly cells and cell-based assays | Mostly tissue |
| Written in | Java | Python | Java |
| Price | Free (ImageJ public domain; Fiji open source) | Free, open source | Free, open source (GPLv3) |
| Paper to cite | Schneider et al. 2012 (ImageJ), Schindelin et al. 2012 (Fiji) | Stirling et al. 2021 (CellProfiler 4) | Bankhead et al. 2017 |
Pick this if…
- You have one to a few dozen images, or you are still working out how to analyse them: ImageJ or Fiji. Every step is visible and reversible, and the menus cover almost any measurement.
- You have a plate, a screen, or the same assay every week: CellProfiler. Building the pipeline takes an afternoon; after that, a thousand images cost no more effort than ten, and the pipeline file is your method.
- You have whole slide scans (.svs, .ndpi, .mrxs and others) or tissue microarrays: QuPath. It is built for slides that are too large to open in ImageJ as one image.
- Your cells are crowded, irregular or unstained: whichever you pick, add a deep-learning segmenter (StarDist or Cellpose). All three can use them, through plugins or extensions.
- You work on materials, particles, gels or anything that is not a cell: ImageJ or Fiji. CellProfiler and QuPath are built around cells and tissue.
The same job in ImageJ: count the nuclei, step by step
Here is the job all three can do, counting nuclei, done in ImageJ with a picture for every step. The commands are the same in plain ImageJ and in Fiji.
Step 1: Open the image
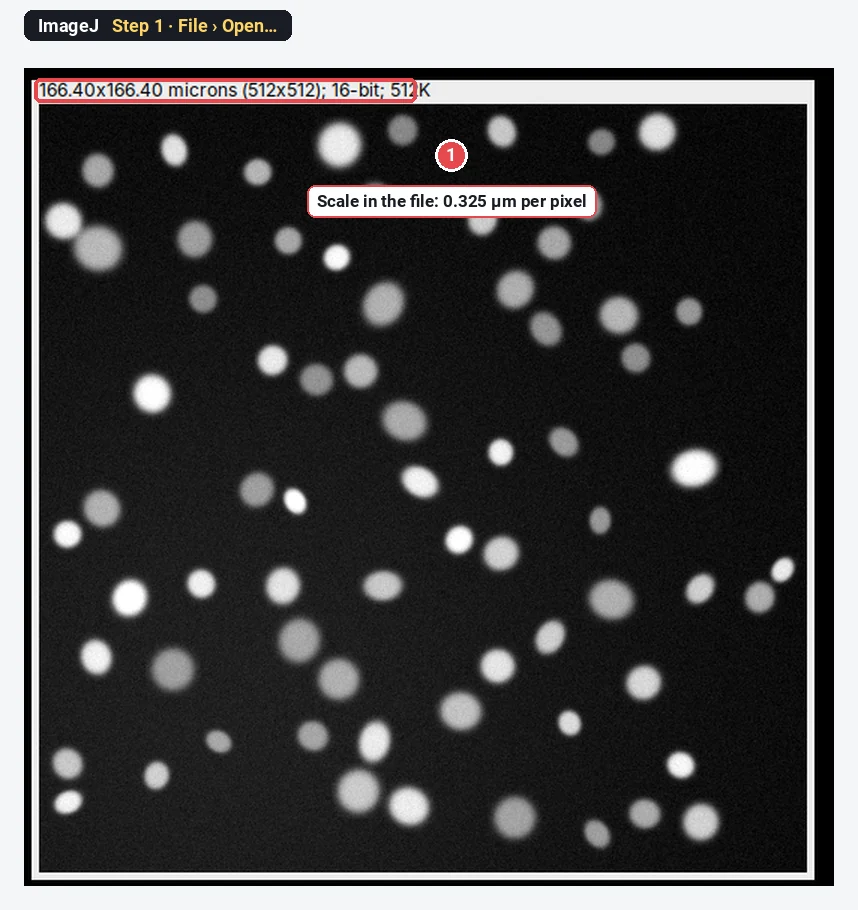
Click File › Open… and choose the TIFF. The line above the image shows 166.40x166.40 microns (512x512); 16-bit: the scale (0.325 µm per pixel) came with the file, so areas will be in µm².
Step 2: Convert to 8-bit
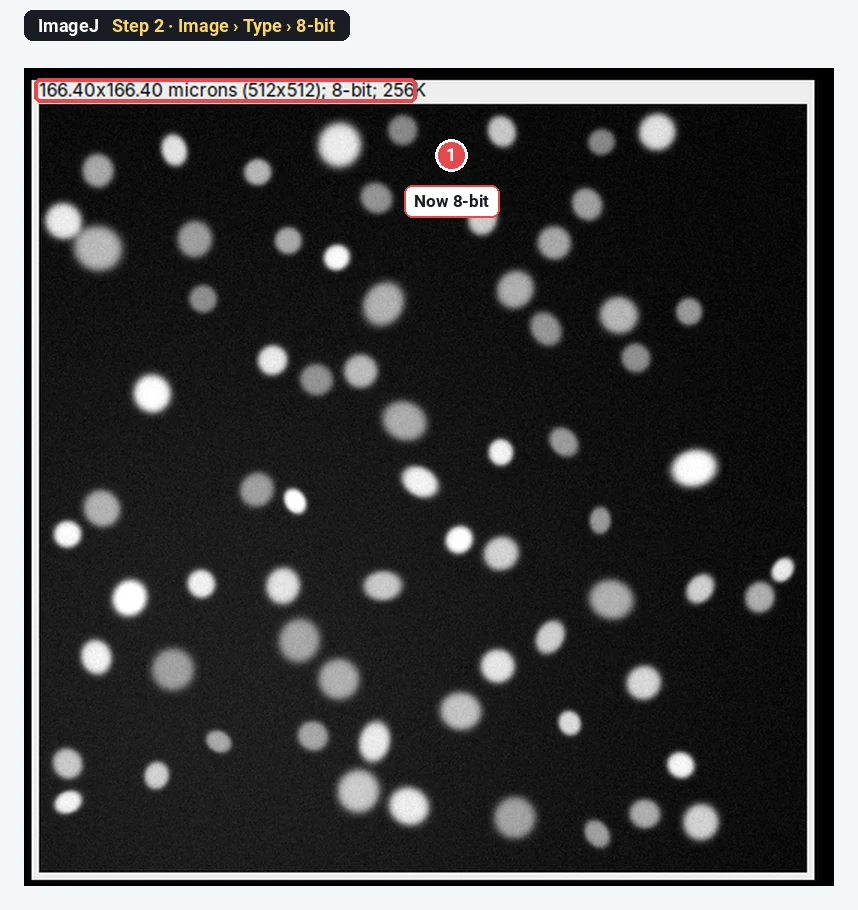
Click Image › Type › 8-bit. For counting, 8-bit is enough and keeps the threshold simple. Measure intensities on the original 16-bit file, not on this copy.
Step 3: Threshold the nuclei
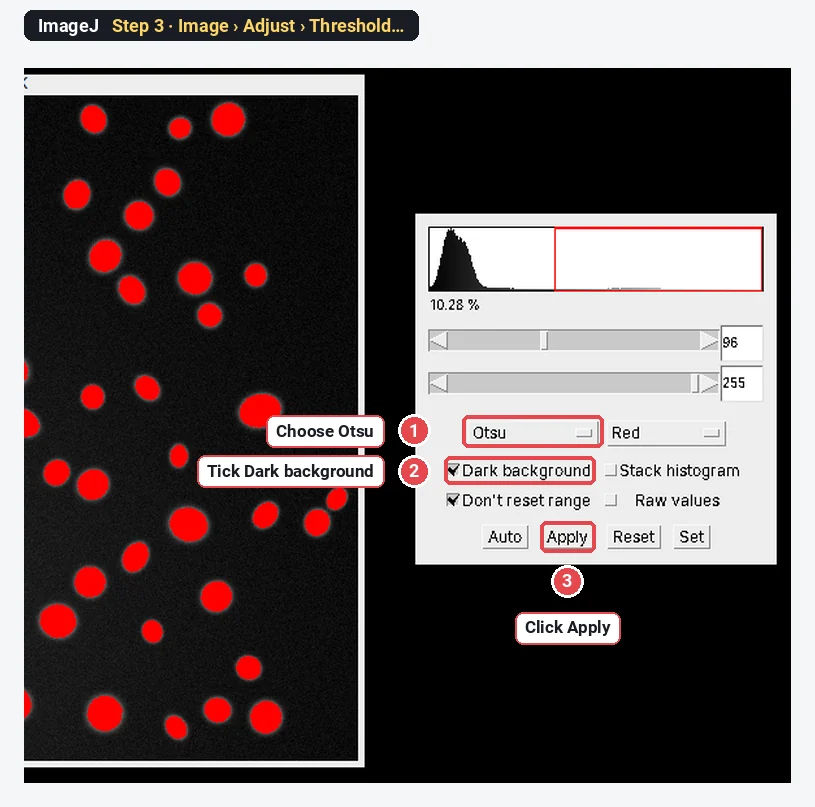
Click Image › Adjust › Threshold…. Choose Otsu, tick Dark background (bright nuclei on a dark background), and check that every nucleus is red. ImageJ sets 96–255 here. Click Apply: the image becomes a black-and-white mask.
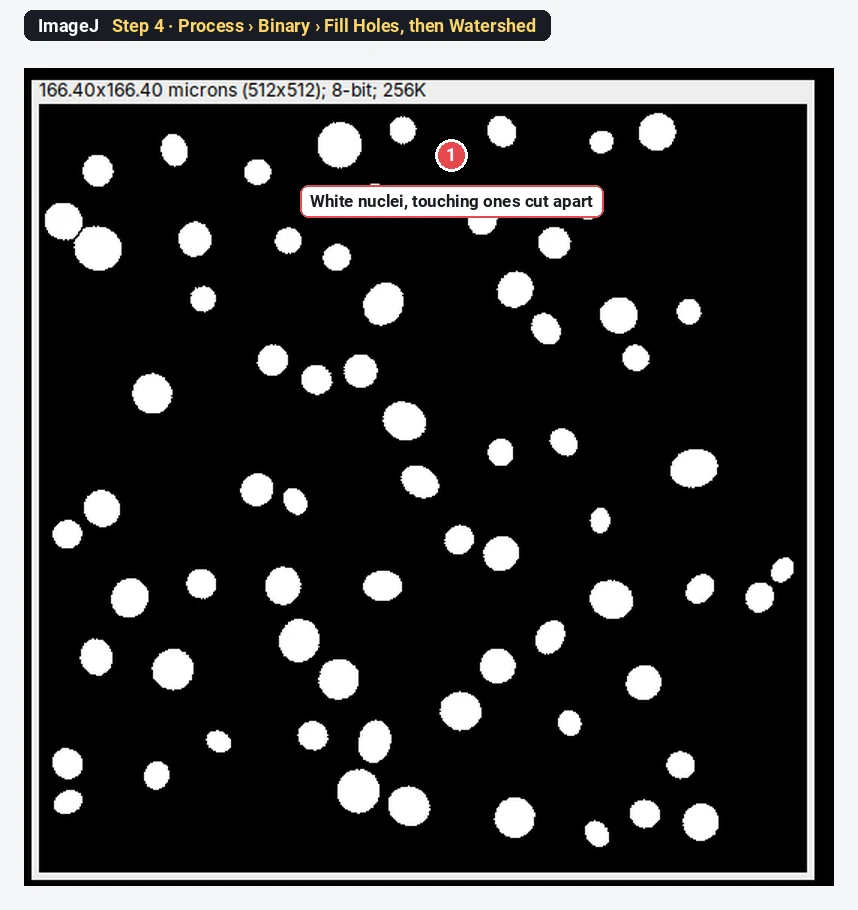
Step 4: Fill holes and split touching nuclei
Click Process › Binary › Fill Holes, then Process › Binary › Watershed. Watershed cuts touching round objects apart with a one-pixel line, so a pair of touching nuclei counts as two.
Step 5: Analyze Particles
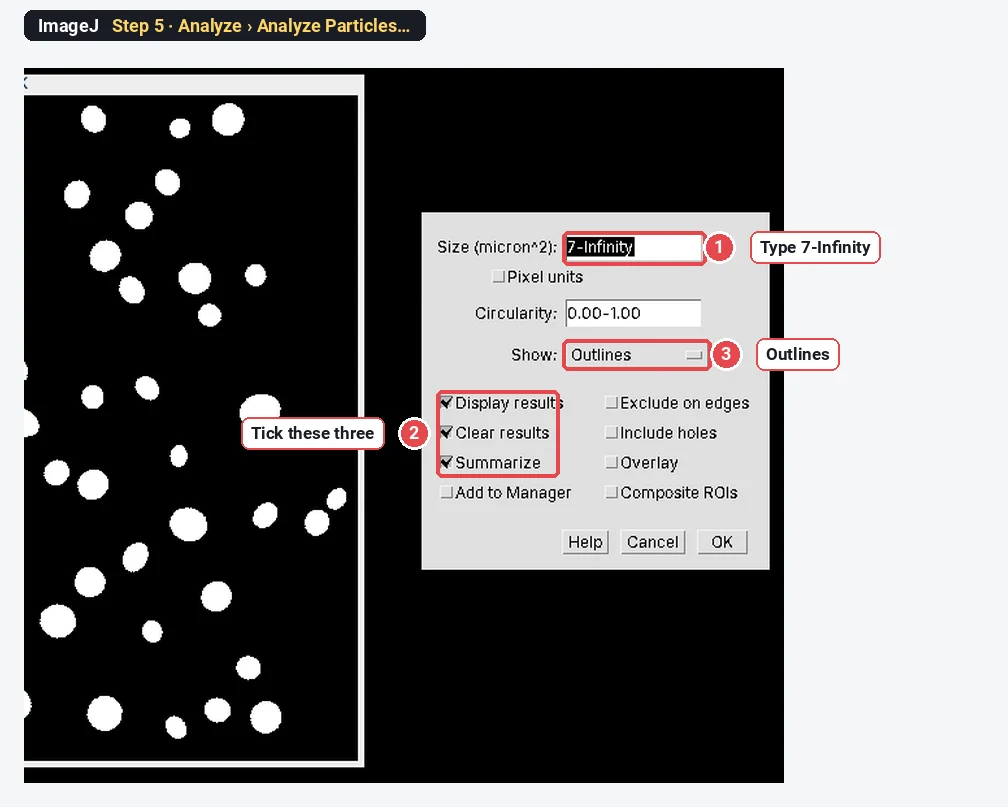
Click Analyze › Analyze Particles…. Type 7-Infinity in Size (micron^2) to drop specks smaller than a fifth of a typical nucleus, choose Show: Outlines, tick Display results, Clear results and Summarize, and click OK.
Step 6: Read the count
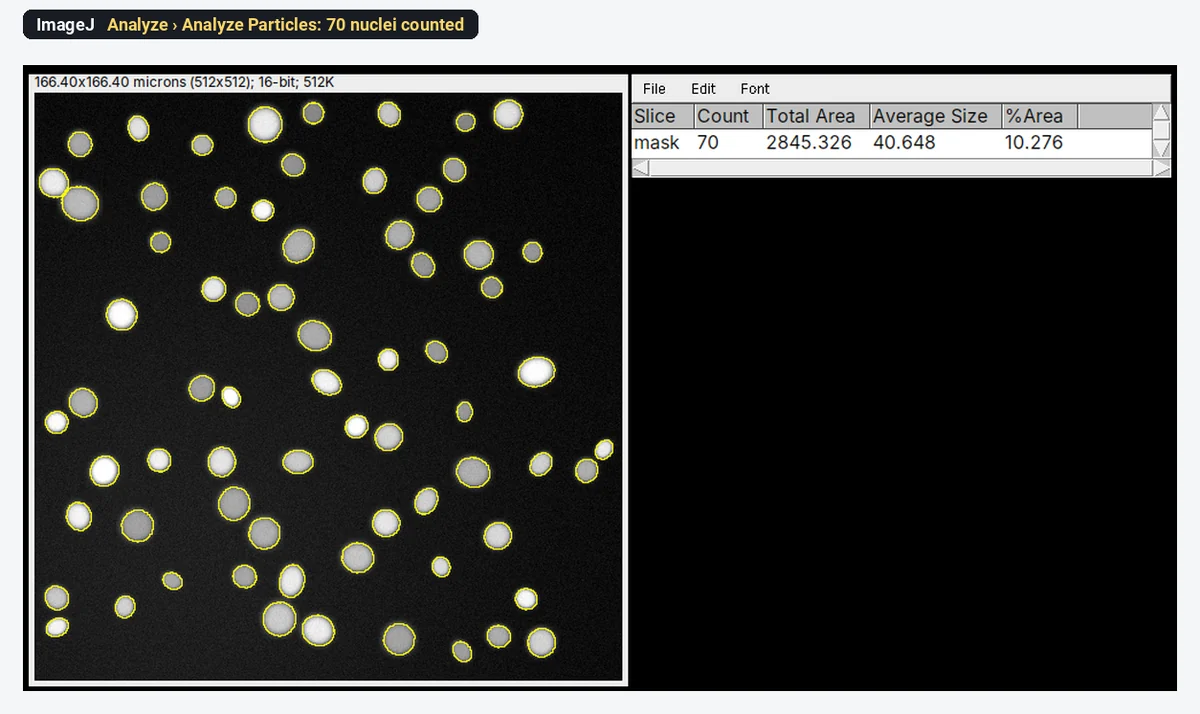
The Summary window gives the answer: Count 70, Total Area 2845.326 µm², Average Size 40.648 µm², %Area 10.276. The sample has 70 nuclei by design, so the count is right. Lay the outlines over the image to check that no pair was merged and no nucleus split.
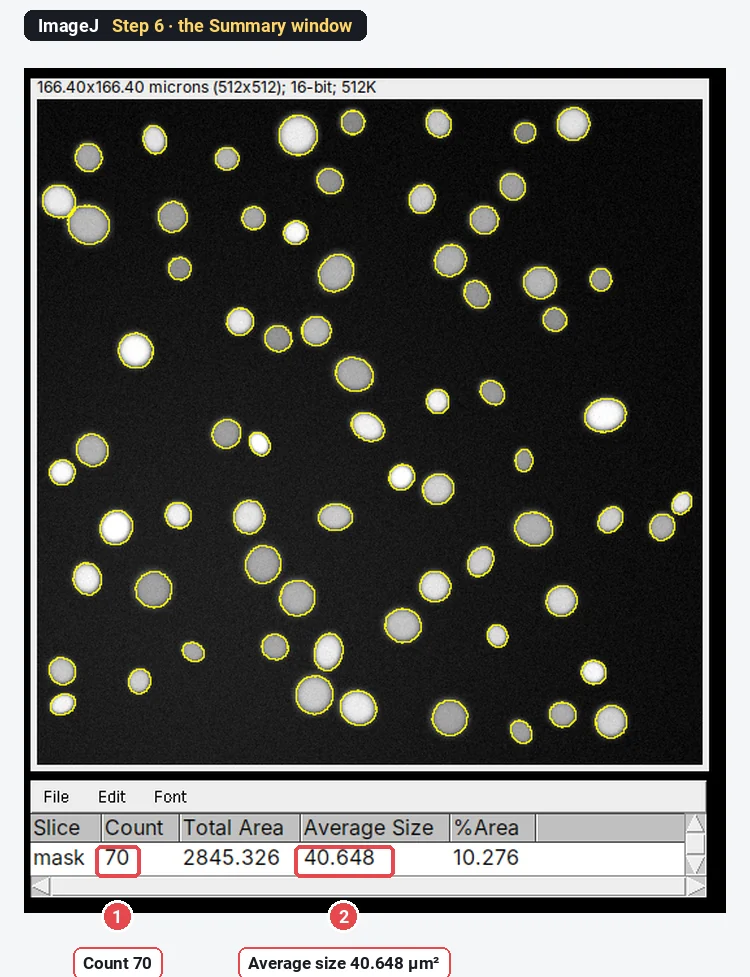
That is the whole job in ImageJ: six steps, about five minutes the first time. For one image, nothing is faster. For 500 images you would record these steps as a macro (Plugins › Macros › Record…) and run it in Process › Batch › Macro…, which is where CellProfiler starts to make more sense.
The same job in CellProfiler
We could not run CellProfiler for this guide, so here are the steps in text, from the CellProfiler module documentation and example pipelines. CellProfiler works on a pipeline: a list of modules that every image goes through.
- Load the images. Drag the image files (or a whole folder) onto the Images module. The input modules (Images, Metadata, NamesAndTypes, Groups) are always at the top of the pipeline.
- Name the channel. In NamesAndTypes, give the nuclear channel a name, for example DNA.
- Find the nuclei. Add IdentifyPrimaryObjects: input image DNA, output objects Nuclei. Set Typical diameter of objects, in pixel units (Min,Max) (about 10 to 40 pixels for this sample, whose nuclei are around 22 pixels across), whether to discard objects outside that range and objects touching the border, the threshold (strategy Global, method Otsu or Minimum Cross-Entropy), and how to split clumped objects (by shape or by intensity).
- Measure and export. Add MeasureObjectSizeShape for the nuclei and ExportToSpreadsheet for the tables.
- Test, then run. Start Test Mode runs the pipeline on one image and shows the outlines at each step, so you can tune the diameter and threshold. Then Analyze Images runs it on every image; the count is a column in the per-image table.
CellProfiler takes longer than ImageJ for one image and much less time for a thousand. The pipeline file (.cppipe) records every setting, which is a good methods record in itself.
The same job in QuPath
QuPath was not run here either; these are the steps from its documentation and workshop material. QuPath works in projects of images.
- Create a project (Create project and choose an empty folder), then Add images. When asked, set the image type to Fluorescence.
- Choose the region. Draw an annotation around the area to analyse, or create an annotation covering the whole image.
- Detect the nuclei. Analyze › Cell detection › Cell detection…: choose the nuclear Detection channel, set the Requested pixel size, Background radius, Sigma, Minimum area and Maximum area, the intensity Threshold (raise it if objects appear in the background), keep Split by shape ticked to separate touching nuclei, and set Cell expansion (0 if you want nuclei only; by default QuPath grows a cell boundary a few µm around each nucleus). Click Run.
- Read the count. The number of detections appears in the annotation's measurements; Measure › Show detection measurements lists every nucleus with its area and intensities.
For a slide with a million cells, QuPath does this across the whole section; it then lets you train a classifier for positive and negative cells, which is where it shines.
What each one is not good at
Fair comparisons name the weak points too.
- ImageJ/Fiji: repeating an analysis on many images needs a macro; whole slide images are awkward; the menus do not record what you did unless you turn on the recorder; results from one image at a time.
- CellProfiler: slower to get going on one image; less suited to exploring or measuring unusual things (a gel, a grain boundary, a line profile); whole slide images are not its focus.
- QuPath: built around tissue and slides; for a plate of cultured cells or a materials image, CellProfiler or ImageJ is the more natural fit.
Pitfalls whichever you choose
- Different software, different numbers. Thresholds, filters and splitting differ, so the same image gives slightly different counts and areas. Pick one tool per study and report its settings.
- Check against your eyes. Count three to five fields by hand and compare before you trust any automatic count.
- Tune on representative images. A pipeline tuned on your best image fails on your worst one. Tune on a few from each condition.
- Measure intensities on raw data. In any of the three, measure the original 16-bit image, not an 8-bit or adjusted copy.
- Cite the right paper and the version. Each project asks you to cite its paper (see the references).
Reporting it
Nuclei were counted in [ImageJ 1.54f / Fiji] ([Otsu] threshold, Fill Holes, Watershed, Analyze Particles with a minimum area of [7 µm²]) on [n] fields per condition at [0.325] µm per pixel.
Or, for the others: "…using a CellProfiler [version] pipeline (IdentifyPrimaryObjects, typical diameter [10–40] pixels, [Otsu] global threshold, declumping by shape); the pipeline file is provided as Supplementary File [1]" or "…using QuPath [version] cell detection on the DAPI channel (threshold [x], cell expansion [0] µm)". Cite Schneider et al. 2012 or Schindelin et al. 2012, Stirling et al. 2021, or Bankhead et al. 2017 accordingly.
Switch to LabCanvas: when you want the count without installing anything
LabCanvas Image Analysis sits beside these three: it runs in the browser, uses ImageJ's names, and gives the count in one click.
- Click Open an image and choose your TIFF (or click the nuclei sample on the start screen).
- Go to the Count tab.
- Click Find nuclei (Otsu, fill holes, watershed and a minimum size in one click), or set them yourself in Count particles and click Count.
- Read the Summary row and click Send to Graphs to compare conditions.
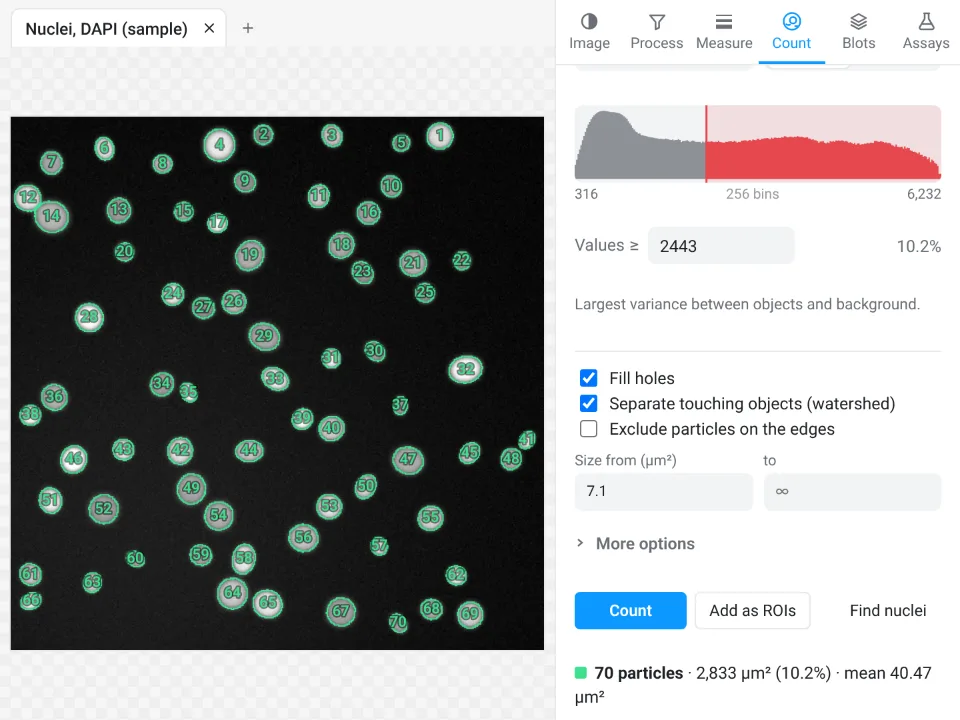
On the same synthetic image, Find nuclei counts 70 nuclei (mean area 40.47 µm², 10.2% of the field); ImageJ above counts 70 with an average of 40.648 µm². The areas differ slightly because the outlines are traced with slightly different settings.
Why switch for a quick count:
- No install, no plugins: it runs on any computer or tablet, including ones where you cannot install software.
- Guided instead of a pipeline or macro: the count, the outlines and the Summary in one panel, with Batch for a folder of images.
- Straight to Graphs with a methods sentence, and every measurement validated in more than 4,000 automated tests.
For whole slide images, use QuPath; for screens of thousands of images and deep-learning segmentation, CellProfiler or Fiji; for maker formats such as .czi or .nd2, Fiji (LabCanvas needs them as TIFF first).
Open Image Analysis: free with a LabCanvas account (downloading files is part of LabCanvas Pro). ImageJ and Fiji are independent open-source projects; LabCanvas is not affiliated with them, nor with CellProfiler or QuPath.
References
- Bankhead P, Loughrey MB, Fernández JA, Dombrowski Y, McArt DG, Dunne PD, et al. (2017). QuPath: open source software for digital pathology image analysis. Scientific Reports 7, 16878. doi:10.1038/s41598-017-17204-5
- Schindelin J, Arganda-Carreras I, Frise E, et al. (2012). Fiji: an open-source platform for biological-image analysis. Nature Methods 9, 676–682. doi:10.1038/nmeth.2019
- Schneider CA, Rasband WS, Eliceiri KW (2012). NIH Image to ImageJ: 25 years of image analysis. Nature Methods 9, 671–675. doi:10.1038/nmeth.2089
- Stirling DR, Swain-Bowden MJ, Lucas AM, Carpenter AE, Cimini BA, Goodman A (2021). CellProfiler 4: improvements in speed, utility and usability. BMC Bioinformatics 22, 433. doi:10.1186/s12859-021-04344-9
Frequently asked questions
Is CellProfiler better than ImageJ?
For measuring thousands of images the same way, usually yes: CellProfiler is built around pipelines of modules that run unattended on whole plates and give per-cell measurements. For exploring a few images, trying different approaches, or work outside cell biology, ImageJ or Fiji is more flexible. Many labs use both.
What is the difference between QuPath and ImageJ?
QuPath is built for whole slide images and tissue: it opens multi-gigapixel slides, organises them in projects, and detects and classifies cells across a whole section. ImageJ is a general-purpose image analysis program for single images and stacks. For histology slides, QuPath is usually the better start; for everything else, ImageJ or Fiji.
What is the best software for cell image analysis?
It depends on the job. For high-throughput per-cell measurements, CellProfiler; for whole slide images and tissue sections, QuPath; for general analysis, single images, stacks and anything unusual, Fiji. For crowded or irregular cells, add a deep-learning segmenter such as StarDist or Cellpose, which plug into all three.
Are CellProfiler, QuPath and ImageJ free?
Yes. All three are free and open source. ImageJ 1.x is public domain; Fiji bundles it with plugins; QuPath is released under the GPLv3; CellProfiler is open source from the Broad Institute.
Do I need to know programming to use them?
No for the basics. CellProfiler pipelines are built from modules with a point-and-click interface, QuPath has menus and dialogs for cell detection and classification, and ImageJ has menus for everything shown in this guide. Scripting (ImageJ macros, Groovy in QuPath, Python with CellProfiler) helps for automation.
Is there a simpler option that runs in the browser?
Yes: LabCanvas Image Analysis runs in the browser with ImageJ-style tools and guided assays; see the last section of this guide.
Try it in LabCanvas
Every app is free to start in your browser. Create an account and begin.
Start Image Analysis free in your browserKeep reading

ImageJ vs LabCanvas Image Analysis: an honest comparison
ImageJ/Fiji or LabCanvas Image Analysis? Six everyday jobs done in both, six newer ones (macros, vendor files, 3D, StarDist, big images) and which to use.

How to use ImageJ: a beginner's tutorial for the 10 everyday jobs (2026)
How to use ImageJ and Fiji: get started, open an image, then 10 everyday jobs (scale, measure, threshold, count, background, blots) with exact menu paths.

How to set the scale and add a scale bar in ImageJ (with a calibration image to practise on)
Set the scale in ImageJ (Analyze › Set Scale) from a micrometer, scale bar or pixel size, add a scale bar, and practise on a free calibration image.