Deep-learning cell segmentation in Fiji: StarDist, Cellpose and Weka (step by step)
When a threshold fails, segment cells in Fiji with StarDist, Cellpose or Trainable Weka: install, settings, then label image to ROIs and measurements.
Contents
When a threshold cannot separate your cells, segment them in Fiji with a trained tool: StarDist (Plugins › StarDist › StarDist 2D, from the CSBDeep and StarDist update sites) for round nuclei, Cellpose (through deepImageJ or the BIOP wrapper) for irregular whole cells, or Trainable Weka Segmentation (Plugins › Segmentation, already in Fiji) when you want to teach it by painting. StarDist and Cellpose give a label image, one number per cell; turn the labels into ROIs, then measure them with Analyze › Set Measurements and Measure in the ROI Manager.
This guide first shows, in plain ImageJ, why a threshold fails on a crowded image, then installs and runs each tool step by step, and ends with the label image measured cell by cell.
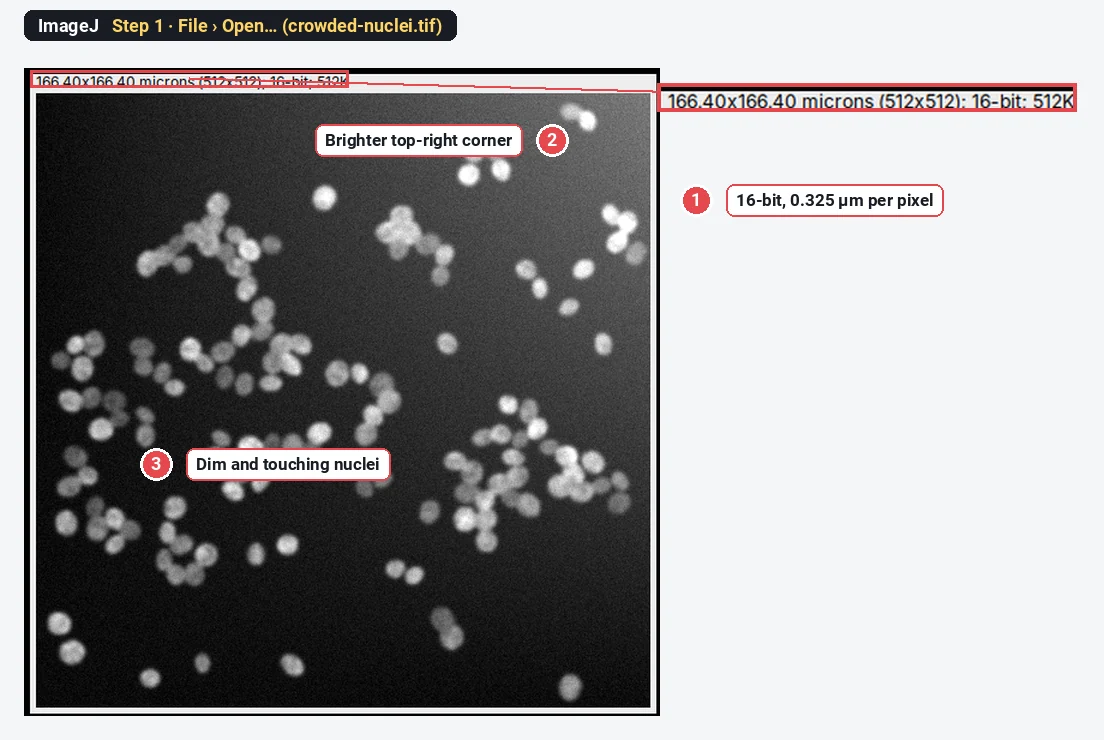
What you need: Fiji (StarDist, Cellpose and Weka are Fiji plugins; plain ImageJ 1.x cannot run them). For the checks and the measuring steps, plain ImageJ 1.x is enough. A 2D image of nuclei or cells, one channel. The example is a synthetic image made for this guide: 140 nuclei, many touching, some dim, on a background that is brighter at the top right (512 × 512 pixels, 16-bit, 0.325 µm per pixel). Time: 10 minutes to see the threshold fail, 20 to 30 minutes for the first run of a plugin, including the install.
Every picture below is ImageJ 1.54f. We could not run Fiji plugins where these screenshots were made, so the StarDist, Cellpose and Weka steps are given in text, with their exact menu paths and field names; nothing here is a mock-up of Fiji.
Does a threshold work on my image? Check it in four steps
Try the simple route first: if a threshold counts your cells correctly, you do not need a plugin. These steps are the same in ImageJ 1.x and Fiji.
Step 1: Open the image
Use File › Open… and pick your TIFF. Look at it before you do anything: here the top-right corner is brighter, some nuclei are dim, and many touch their neighbours.
Step 2: Set a threshold
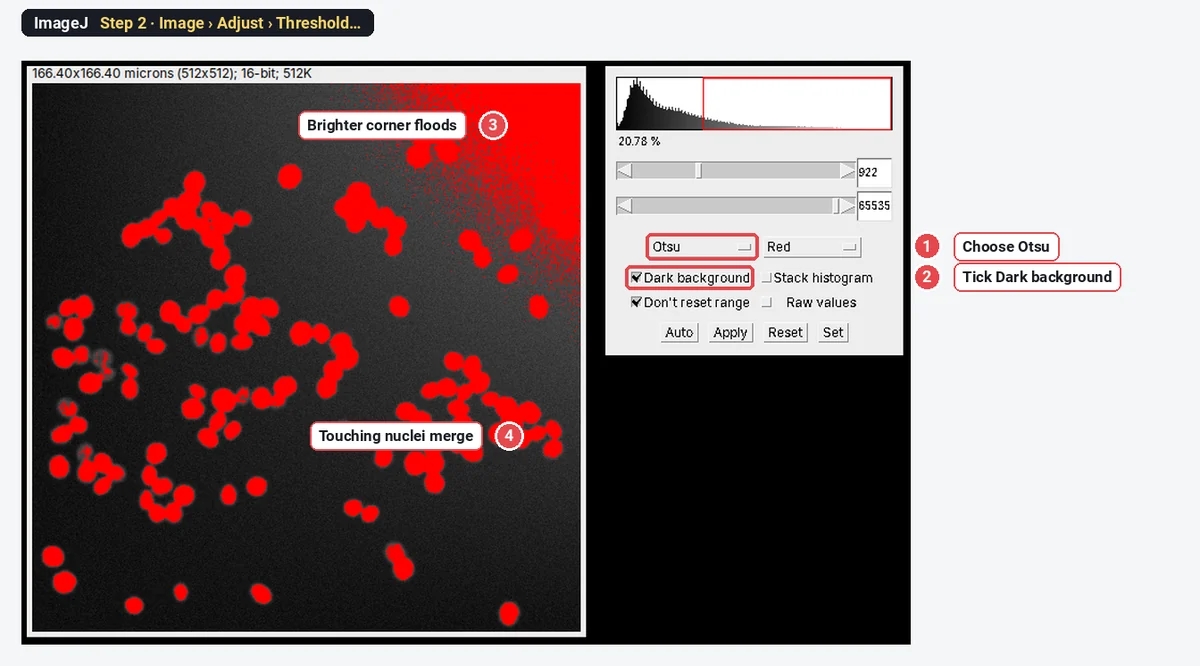
Open Image › Adjust › Threshold…. Choose Otsu in the left list and tick Dark background, because the nuclei are bright on a dark field. Red shows what will count as nucleus.
Step 3: Make the mask and split clumps
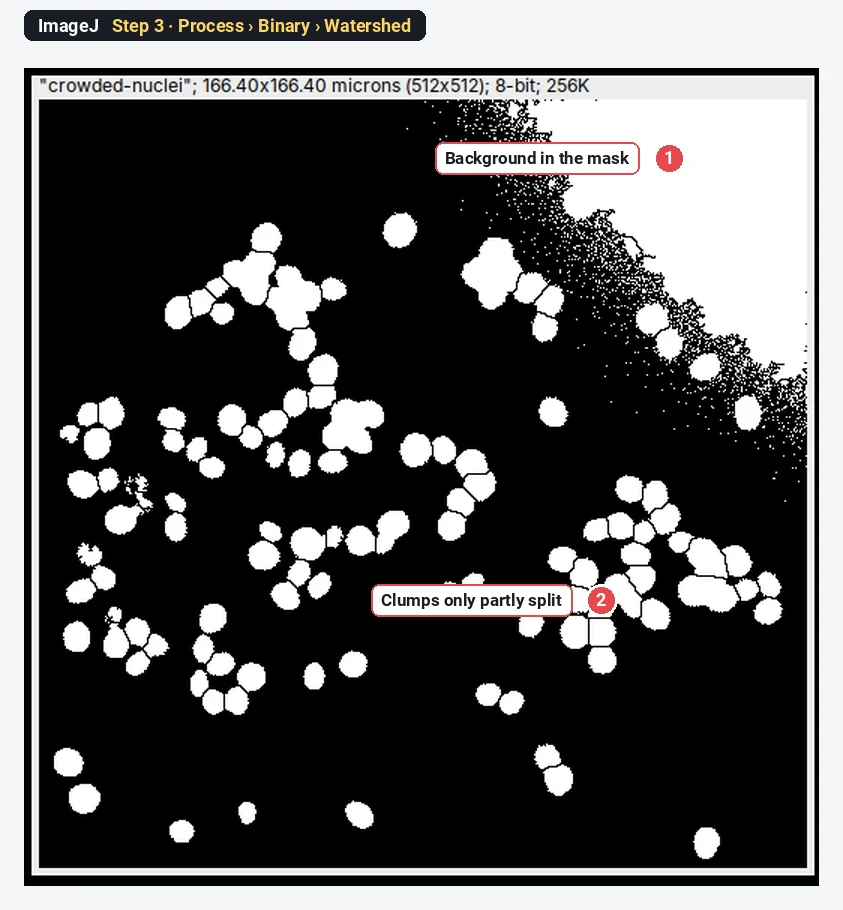
Click Apply. Then run Process › Binary › Fill Holes and Process › Binary › Watershed, which cuts round clumps apart along their narrow necks.
Step 4: Count with Analyze Particles
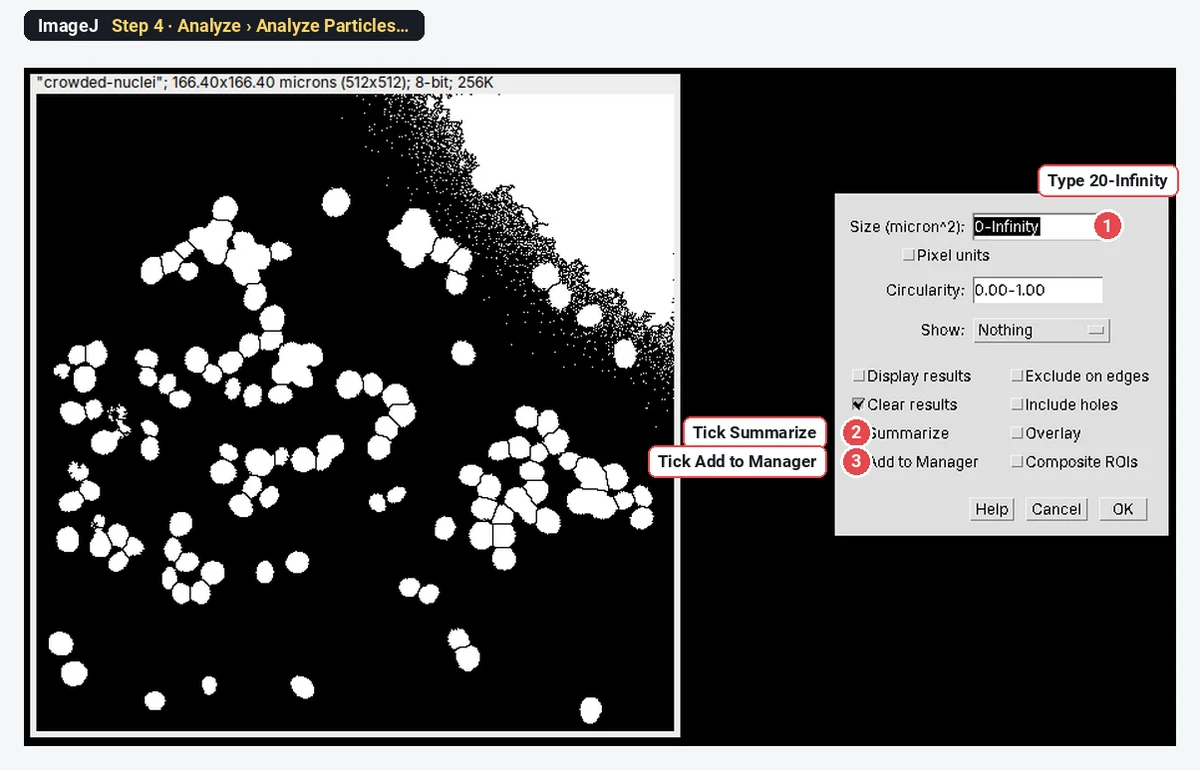
Run Analyze › Analyze Particles…. Type 20-Infinity in Size to skip specks, tick Summarize and Add to Manager, and click OK.
The result: 90 objects for 140 nuclei
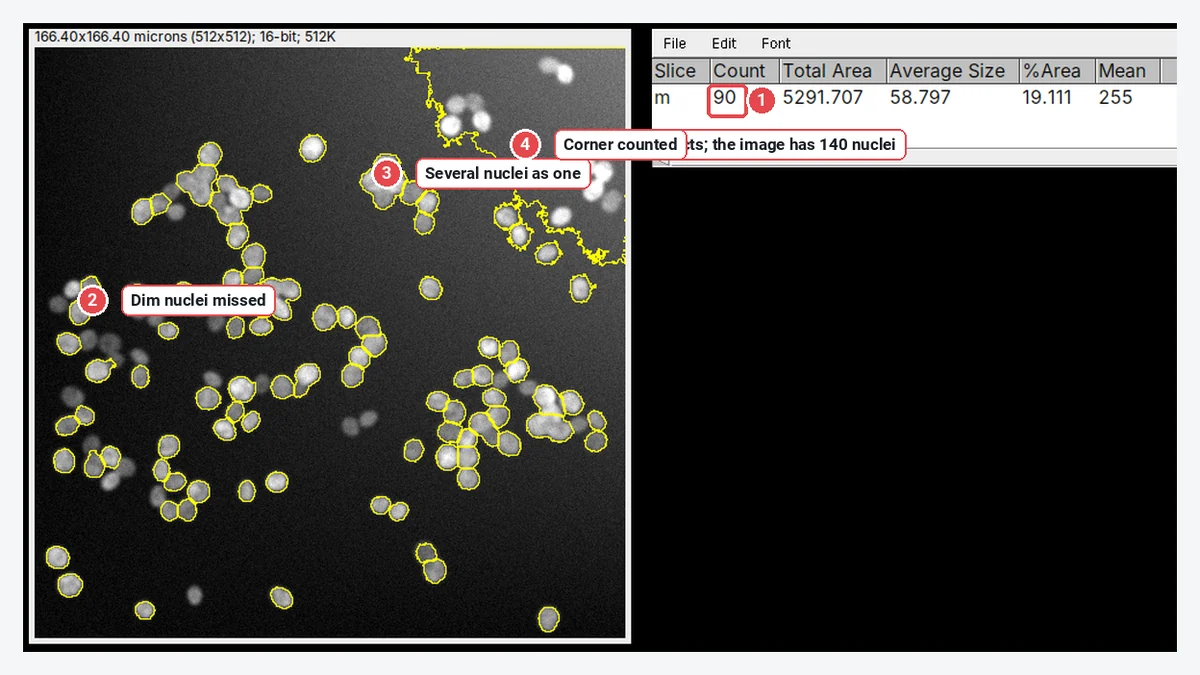
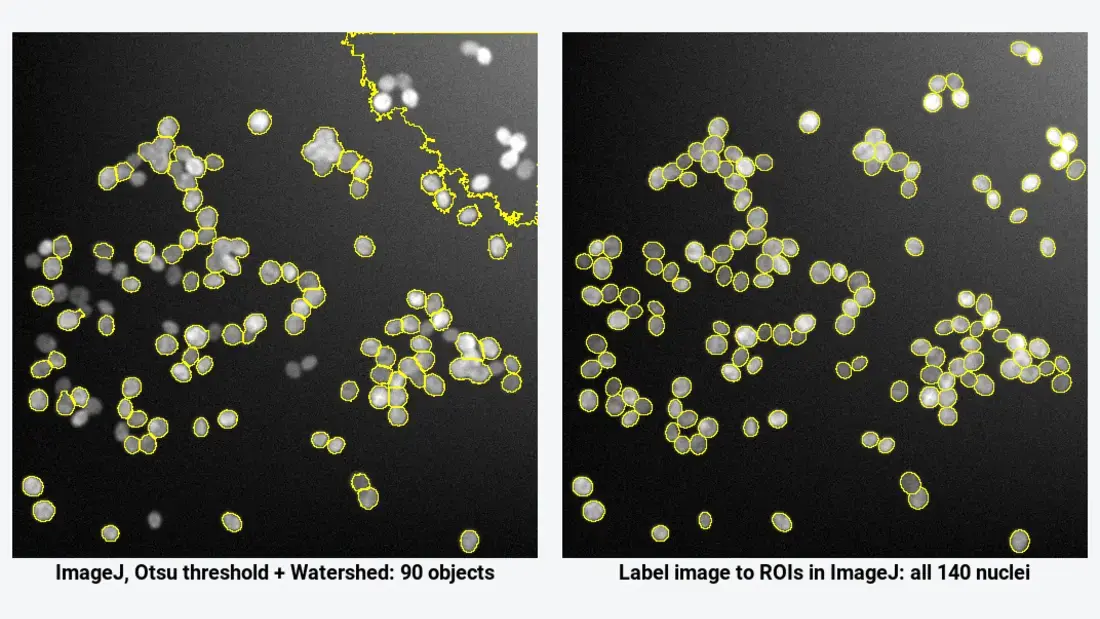
The image holds 140 nuclei; the threshold route finds 90 objects, and their average size, 58.8 µm², is more than twice the real 24.6 µm². Subtracting the background first (Process › Subtract Background…, rolling ball 30 pixels) removes the flooded corner but still gives only 92 objects, because the clusters stay merged. When you see this, the threshold is the wrong tool, and a segmentation plugin is the fix.
Which tool: StarDist, Cellpose or Weka?
All three run in Fiji. They answer different questions.
| StarDist | Cellpose | Trainable Weka Segmentation | |
|---|---|---|---|
| What it is | Deep learning: predicts a star-shaped polygon for each object (Schmidt et al. 2018) | Deep learning: predicts flows that lead each pixel to its cell's centre (Stringer et al. 2021) | Machine learning: a random forest on filter features (Arganda-Carreras et al. 2017) |
| Best for | Round or oval nuclei, fluorescence or H&E | Whole cells of any shape, cytoplasm plus nuclei, phase contrast | Regions that differ in texture or colour, when you can paint examples |
| Output | ROIs in the ROI Manager and a label image | A label image | A class image or probability maps |
| Separates touching objects | Yes | Yes | No: same-class pixels merge |
| Training needed | No for the built-in models | No for the built-in models | Yes: you paint strokes on every image type |
| In Fiji via | StarDist and CSBDeep update sites | deepImageJ, or the BIOP wrapper plus Python | Already installed |
| GPU | Optional | Optional (much faster with one) | Not used |
A label image (sometimes called a count mask) has the value 0 in the background and a different whole number in each object: every pixel of cell 1 is 1, of cell 2 is 2, and so on. That is how StarDist and Cellpose keep touching cells apart, and it is why you must convert it to ROIs rather than threshold it.
How do I install StarDist and Cellpose in Fiji?
Fiji gets plugins from update sites, lists of plugins you switch on in the updater. This part is Fiji only.
- Start Fiji and choose Help › Update…. Let it finish checking.
- Click Manage update sites.
- Tick the sites you need: - CSBDeep and StarDist for StarDist; - DeepImageJ for deepImageJ, which also runs Cellpose and StarDist models; - PTBIOP for the BIOP Cellpose wrapper and for Label image to ROIs.
- Close the list, click Apply changes, and restart Fiji.
Trainable Weka Segmentation needs no update site: it is part of Fiji. The BIOP Cellpose wrapper also needs a working Cellpose installation in Python (a conda or venv environment where python -m cellpose --help runs without an error); deepImageJ's Cellpose command installs its own dependencies on the first run, which needs an internet connection.
Prepare the image in ImageJ
These two steps work in plain ImageJ or Fiji, and they save most first-run failures.
Step 1: Check that it is one 2D channel
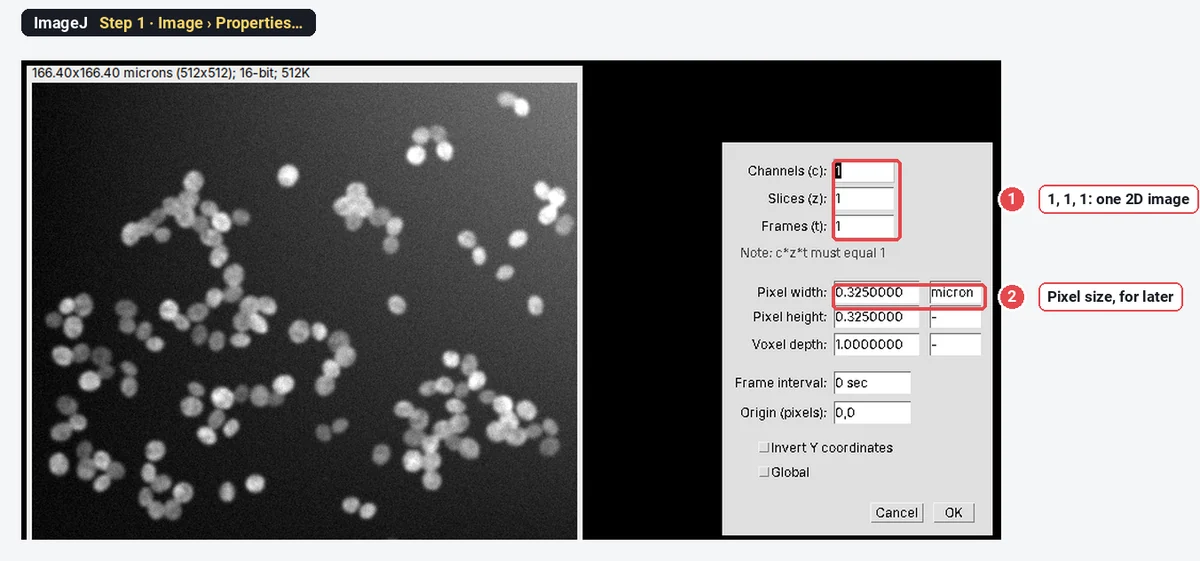
Open Image › Properties…. Channels, Slices and Frames should read 1, 1 and 1. For a multi-channel file, keep the nuclear channel with Image › Color › Split Channels (or Image › Duplicate… with one channel). The StarDist Fiji plugin takes 2D images and 2D time-lapses, not Z-stacks.
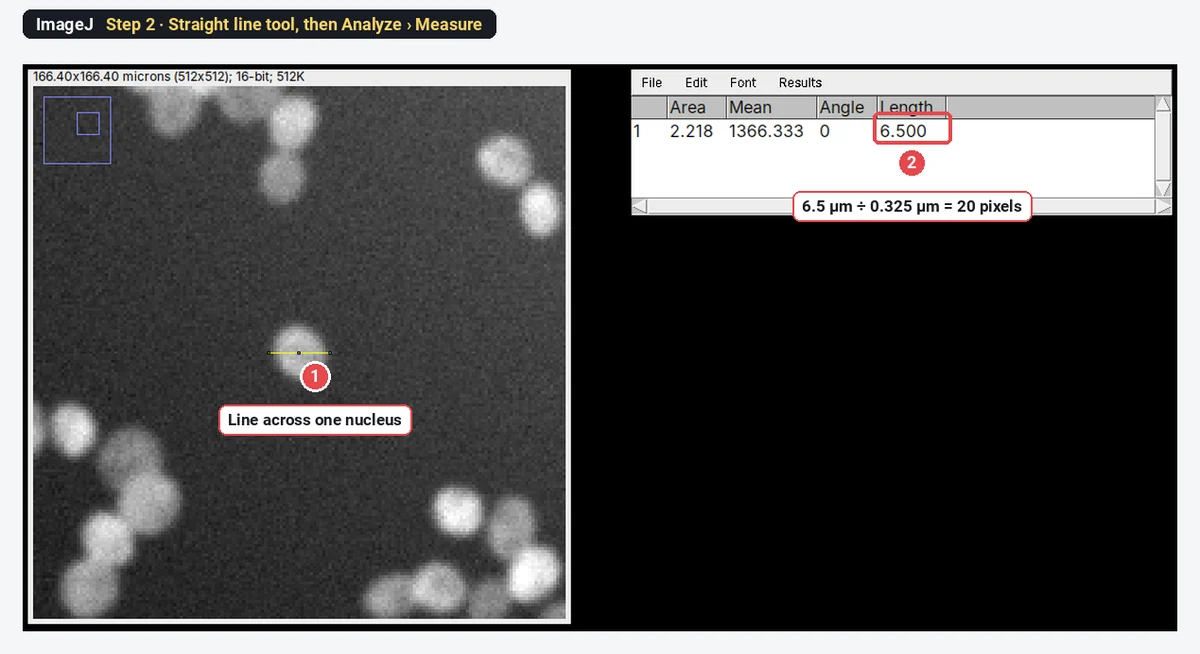
Step 2: Measure the cell diameter in pixels
Cellpose asks for the typical diameter in pixels. Pick the Straight line tool, draw across a typical nucleus, and press M (Analyze › Measure). Divide the Length by the pixel size.
StarDist in Fiji, step by step
This section is Fiji only: StarDist does not run in plain ImageJ 1.x.
- Open your 2D image and click on it so that it is the active window.
- Choose Plugins › StarDist › StarDist 2D.
- Under Neural Network Prediction, set Input Image to your image and Model to Versatile (fluorescent nuclei) for fluorescence, or Versatile (H&E nuclei) for brightfield H&E (an RGB image).
- Leave Normalize Image ticked, with Percentile low 1.0 and Percentile high 99.8.
- Under NMS Postprocessing, click Set optimized postprocessing thresholds (for selected model): for Versatile (fluorescent nuclei) this sets Probability/Score Threshold to 0.479071 and Overlap Threshold to 0.3.
- Set Output Type to Both (ROI Manager and Label Image) and click OK.
- Check the outlines over the image. Too many false objects: raise the Probability/Score Threshold. Missed dim nuclei: lower it.
| StarDist 2D field | Default | What it does |
|---|---|---|
| Model | Versatile (fluorescent nuclei) | The trained network; also Versatile (H&E nuclei), DSB 2018 (from StarDist 2D paper), or your own model as a .zip from a file or URL |
| Normalize Image, Percentile low / high | On, 1.0 / 99.8 | Stretches the image so that these percentiles become 0 and 1 before prediction |
| Probability/Score Threshold | 0.5 (0.479071 optimised for the fluorescence model) | Higher: fewer objects, fewer false ones |
| Overlap Threshold | 0.4 (0.3 optimised) | How much two candidate objects may overlap before one is dropped |
| Output Type | Both | ROI Manager, Label Image or Both |
| Number of Tiles | 1 | Raise it for large images or when the graphics card runs out of memory |
| Boundary Exclusion | 2 | Drops objects within this many pixels of the edge |
| ROI Position | Automatic | How ROIs are tied to slices in a stack or hyperstack |
Cellpose in Fiji, step by step
Cellpose itself is Python; Fiji calls it. Pick one of two routes. Both are Fiji only.
With deepImageJ (no Python to set up yourself):
- Open the image and choose Plugins › DeepImageJ › DeepImageJ Cellpose.
- Choose the model: cyto3 for whole cells (also cyto, cyto2, or nuclei for nuclei), or a file with your own weights.
- Set Cytoplasm channel (for a one-channel image, Gray) and, for two-channel images, the Nuclei channel (or None).
- Type the diameter in pixels, here 20, and run. The first run downloads what Cellpose needs, so it takes a while.
- The result is a label image named yourimage\_labels.tif: 0 is background and each cell has its own number.
In a macro the same call reads run("DeepImageJ Cellpose", "model=cyto3 cyto_channel=1 nuclei_channel=none diameter=30 display_all=false");, with your own diameter in place of 30.
With the BIOP wrapper (uses a Cellpose environment you installed):
- Choose Plugins › BIOP › Cellpose/Omnipose › Cellpose … (for Cellpose 3.1 and earlier) or Cellpose SAM... (for Cellpose 4).
- Point conda environment path to the environment folder and choose virtual environment type (conda or venv).
- Type the model in --pretrained_model (cyto3 by default), or leave it empty and give your own model_path.
- Type the --diameter in pixels and the channels in --chan and --chan2 (Cellpose's own numbering: 0 for a grey image).
- Check the extra-flags field: it holds Cellpose command-line flags such as
--use_gpu; remove--do_3Dfor a 2D image. - Run. The label image opens as yourimage-cellpose.
Trainable Weka Segmentation, step by step
This is the tool to try when the problem is texture or colour, not touching objects. It is in every Fiji, but not in plain ImageJ 1.x.
- Open the image and choose Plugins › Segmentation › Trainable Weka Segmentation. The image opens in the Weka window with two classes, class 1 and class 2.
- With the freehand line or freehand selection tool, draw over a few nuclei and click Add to class 1; draw over background and click Add to class 2. Rename classes by clicking their names; Create new class adds a third.
- Click Train classifier. A random forest of 200 trees learns from your strokes, using Gaussian blur, Sobel, Hessian, difference-of-Gaussians and membrane-projection features unless you change them in Settings.
- Look at the coloured overlay (Toggle overlay), add strokes where it is wrong, and train again.
- Click Create result for a class image, or Get probability for one probability map per class. Threshold the nucleus class, run Watershed, then Analyze Particles as in Step 4 above.
- Save classifier keeps it; Apply classifier runs it on other images.
Weka classifies pixels, so it fixes uneven background and texture, but two touching nuclei of the same class still come out as one object. For crowded nuclei, StarDist or Cellpose is the stronger choice.
From a label image to measurements in ImageJ
StarDist with Output Type Both fills the ROI Manager for you; skip to Step 3. A Cellpose label image needs turning into ROIs first. The steps below work in plain ImageJ 1.x. The label image used here is the sample's own true label image, the same kind of image StarDist and Cellpose produce.
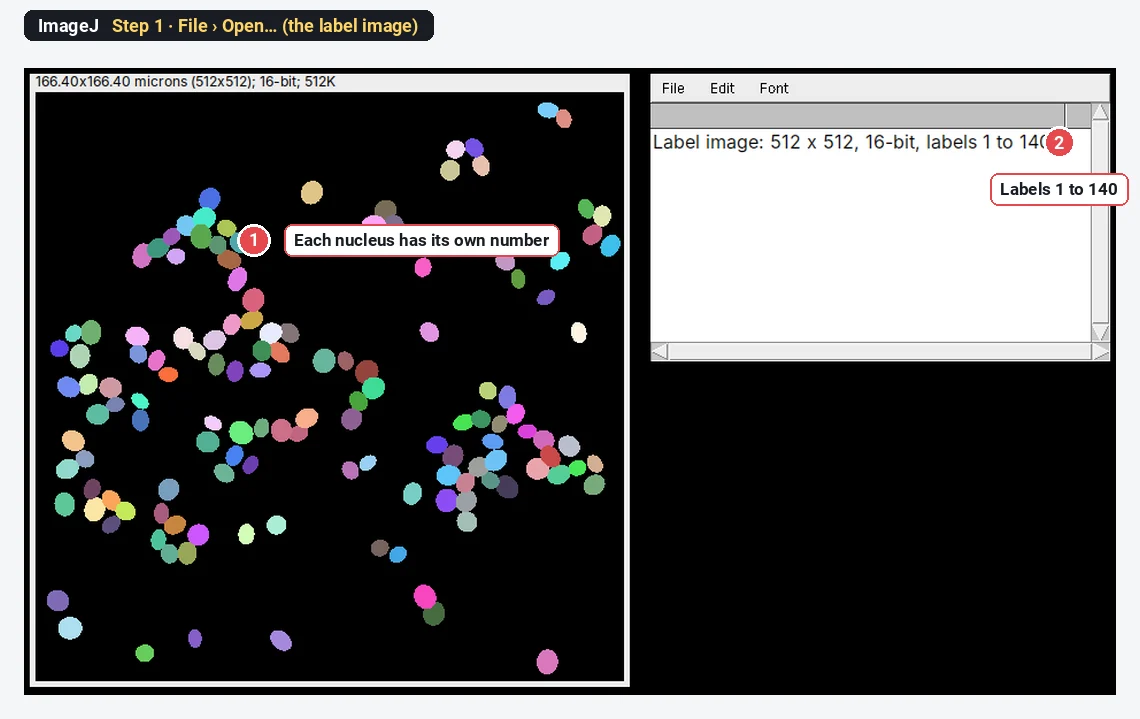
Step 1: Open the label image
Open it with File › Open…. In grey it looks almost black, because the labels are small numbers; a random colour table (or Image › Lookup Tables › 3-3-2 RGB) shows each object.
Step 2: Turn every label into an ROI
In Fiji with the PTBIOP update site, run Plugins › BIOP › Image Analysis › ROIs › Label image to ROIs. In plain ImageJ, open Plugins › New › Macro, paste this, and click Run with the label image active:
// One ROI per label value
getStatistics(area, mean, min, max);
roiManager("reset");
for (i = 1; i <= max; i++) {
  setThreshold(i, i);
  run("Create Selection");
  if (selectionType() != -1) roiManager("add");
  run("Select None");
}
resetThreshold();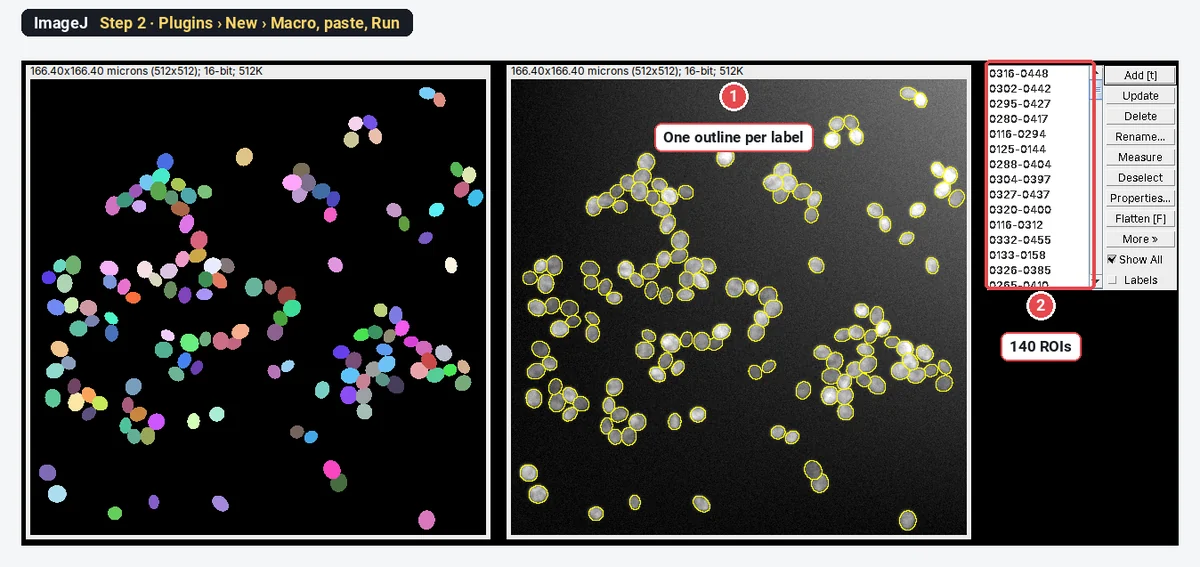
Step 3: Measure every cell
Select the original image (not the label image), choose what to measure in Analyze › Set Measurements… (here Area, Mean gray value, Shape descriptors), then click Measure in the ROI Manager. With no ROI selected, it measures all of them.
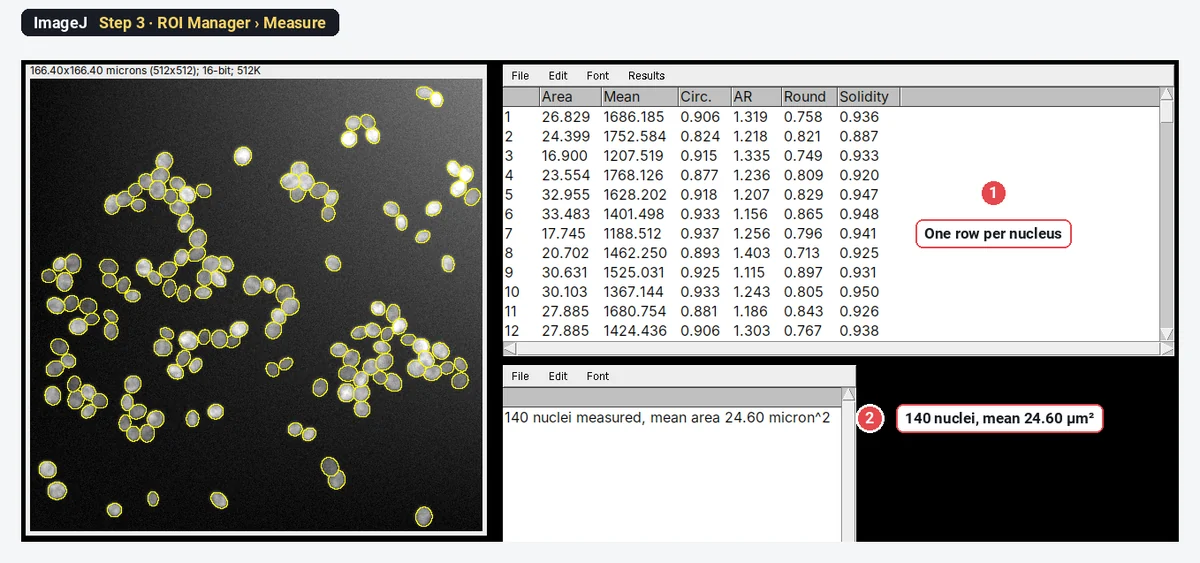
Do not threshold the label image as one mask (label above 0) and run Analyze Particles on it: touching labels join again. On this sample that gives 68 objects instead of 140.
How do I know the segmentation is right?
Look first: lay the outlines over the original and zoom into the densest area and the dimmest cells. Then count three to five fields by hand (Multi-point tool in ImageJ 1.x, Cell Counter in Fiji) and compare with the plugin's count. A built-in model trained on other images can fail on yours without any error message: it will happily draw outlines around debris or split one odd-shaped cell in two. If the differences are larger than you can accept, adjust the probability threshold or diameter, or retrain the model on your own annotated images (StarDist and Cellpose 2.0 both support this, in Python).
Pitfalls
- Wrong diameter in Cellpose. A diameter half the true size splits cells; double the size merges them. Measure it (Step 2 above) and enter pixels, not µm.
- The wrong channel. StarDist's fluorescence model expects one channel; the H&E model expects an RGB image. A merged colour image gives poor results.
- A Z-stack sent to StarDist. The Fiji plugin supports only 2D images and 2D time-lapses. For 3D nuclei, use StarDist in Python.
- Measuring the label image. Its "intensities" are label numbers. Always measure the original image with the ROIs.
- Edge objects. StarDist drops objects within Boundary Exclusion pixels of the edge (2 by default); for densities, decide how you treat cut cells and say so.
- Different settings per image. Fix the model, thresholds and diameter for the whole experiment.
- Too much trust. Deep learning outputs look clean even when they are wrong. Check against counts by hand on every new kind of image.
Reporting it
Nuclei were segmented in Fiji (ImageJ [1.54]) with StarDist 2D (Schmidt et al. 2018; model Versatile (fluorescent nuclei), percentiles [1–99.8], probability threshold [0.48], overlap threshold [0.3]). Each object was measured on the original image with the ROI Manager (area, mean intensity). The automatic counts were checked against manual counts on [5] fields per condition ([agreement]).
For Cellpose give the version, model (for example cyto3), diameter in pixels and channels, and cite Stringer et al. (2021); for Weka give the classes, features and number of training strokes and cite Arganda-Carreras et al. (2017); for deepImageJ cite Gómez-de-Mariscal et al. (2021). Cite Fiji (Schindelin et al. 2012).
Switch to LabCanvas: a pixel classifier in the browser
If what you need is Weka-style "paint a few strokes, let it classify the rest", LabCanvas Image Analysis has that in the browser, with nothing to install and no plugins.
- Click Open an image and choose your TIFF (or the nuclei sample on the start screen).
- Go to the Count tab › Pixel classifier.
- Paint a few strokes on Object and on Background; the result updates live. Paint more where it is wrong.
- Click Count objects (it uses the Count particles settings, including Separate touching objects (watershed)), or Make ROIs, Probability image or Areas.
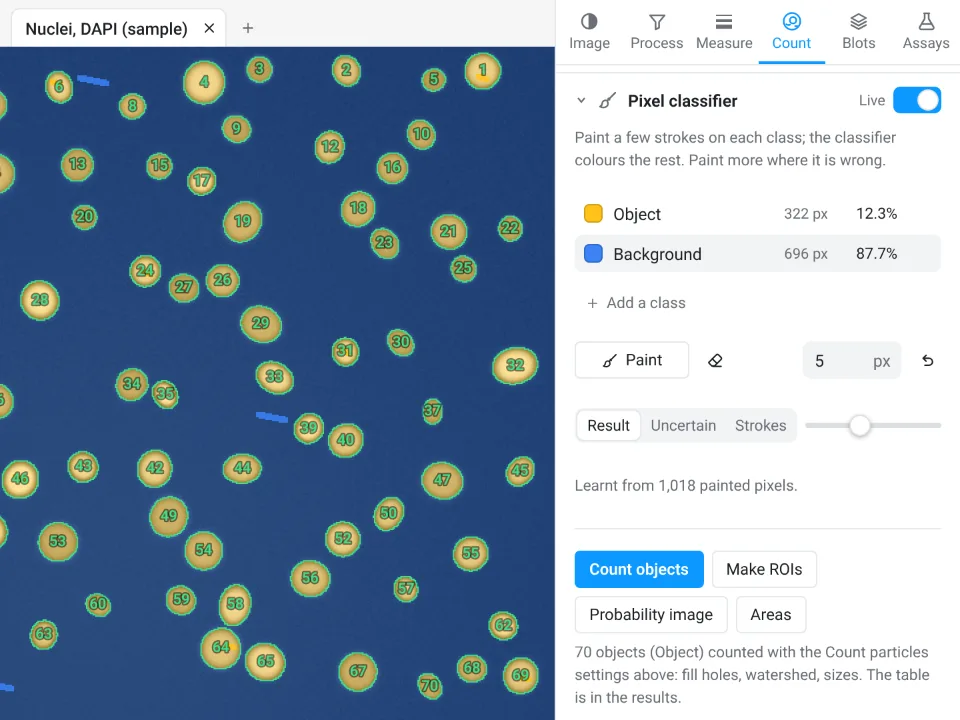
That example is the app's own nuclei sample, not the crowded image above.
Why switch for this job:
- No install and no update sites: it runs in the browser on any computer.
- A pixel classifier built in: the same idea as Trainable Weka Segmentation, a random forest of 100 trees on your strokes, with fine, medium or coarse detail.
- Results straight to Graphs with a methods sentence to copy, and an image check that flags clipping and uneven light first.
Be clear about the limit: the LabCanvas classifier is a random forest, not deep learning. It has no StarDist or Cellpose, so for crowded, touching nuclei like the sample above, Fiji with StarDist or Cellpose stays the better tool.
Open Image Analysis: free with a LabCanvas account (downloading files is part of LabCanvas Pro). ImageJ and Fiji are independent open-source projects; LabCanvas is not affiliated with them.
References
- Arganda-Carreras I, Kaynig V, Rueden C, Eliceiri KW, Schindelin J, Cardona A, Seung HS (2017). Trainable Weka Segmentation: a machine learning tool for microscopy pixel classification. Bioinformatics 33, 2424–2426. doi:10.1093/bioinformatics/btx180
- Gómez-de-Mariscal E, García-López-de-Haro C, Ouyang W, Donati L, Lundberg E, Unser M, Muñoz-Barrutia A, Sage D (2021). DeepImageJ: a user-friendly environment to run deep learning models in ImageJ. Nature Methods 18, 1192–1195. doi:10.1038/s41592-021-01262-9
- Pachitariu M, Stringer C (2022). Cellpose 2.0: how to train your own model. Nature Methods 19, 1634–1641. doi:10.1038/s41592-022-01663-4
- Schindelin J, Arganda-Carreras I, Frise E, et al. (2012). Fiji: an open-source platform for biological-image analysis. Nature Methods 9, 676–682. doi:10.1038/nmeth.2019
- Schmidt U, Weigert M, Broaddus C, Myers G (2018). Cell detection with star-convex polygons. In Medical Image Computing and Computer Assisted Intervention – MICCAI 2018, Lecture Notes in Computer Science 11071, 265–273. doi:10.1007/978-3-030-00934-2_30
- Stringer C, Wang T, Michaelos M, Pachitariu M (2021). Cellpose: a generalist algorithm for cellular segmentation. Nature Methods 18, 100–106. doi:10.1038/s41592-020-01018-x
Frequently asked questions
How do I install StarDist in Fiji?
Open Help › Update…, click Manage update sites, tick CSBDeep and StarDist, close the list, click Apply changes and restart Fiji. The command is then Plugins › StarDist › StarDist 2D. The Fiji plugin works on 2D images and 2D time-lapses; for 3D use the StarDist Python package.
Can I run Cellpose inside Fiji?
Yes, in two ways. deepImageJ (update site DeepImageJ) has Plugins › DeepImageJ › DeepImageJ Cellpose, which installs what it needs on the first run and returns a label image. The BIOP wrapper (update site PTBIOP) adds Plugins › BIOP › Cellpose/Omnipose › Cellpose …, which calls a Cellpose Python environment you installed yourself.
Is Trainable Weka Segmentation deep learning?
No. Trainable Weka Segmentation is classical machine learning: it computes filter features (Gaussian blur, Sobel, Hessian, difference of Gaussians, membrane projections by default) and trains a random forest of 200 trees on the pixels you paint. It ships with Fiji, needs no GPU and learns from a few strokes, but it classifies pixels, so touching cells of the same class still merge.
StarDist or Cellpose: which should I use?
StarDist is the natural first try for round or oval nuclei in fluorescence or H&E images: it is fast and runs inside Fiji with no Python. Cellpose handles irregular whole cells, cytoplasm with a nuclear channel and phase contrast better, and it needs the object diameter in pixels. On a new kind of image, try both on a few fields and compare with a count by hand.
How do I measure a label image from StarDist or Cellpose in ImageJ?
Turn each label into an ROI and measure the ROIs: StarDist can send its ROIs straight to the ROI Manager; for a Cellpose label image, use Label image to ROIs (PTBIOP update site) or a short ImageJ macro that thresholds each label value and adds it to the ROI Manager. Then Analyze › Set Measurements and Measure in the ROI Manager, on the original image. Do not threshold the label image as a whole: touching cells merge again.
Why does my threshold merge touching nuclei?
A threshold only separates bright from dark, so two nuclei that touch become one object, and Watershed splits only clumps with a clear neck. Uneven background makes it worse. On the crowded sample here, Otsu with Fill Holes and Watershed finds 90 objects where there are 140 nuclei; an instance segmentation tool such as StarDist or Cellpose is the fix.
Is there an easier way without installing Fiji plugins?
For images a threshold cannot handle, LabCanvas Image Analysis has a pixel classifier in the browser: paint a few strokes, a random forest colours the rest, then count. It is not deep learning, so for crowded nuclei StarDist or Cellpose in Fiji remain the stronger tools.
Try it in LabCanvas
Every app is free to start in your browser. Create an account and begin.
Start Image Analysis free in your browserKeep reading

ImageJ vs LabCanvas Image Analysis: an honest comparison
ImageJ/Fiji or LabCanvas Image Analysis? Six everyday jobs done in both, six newer ones (macros, vendor files, 3D, StarDist, big images) and which to use.

How to use ImageJ: a beginner's tutorial for the 10 everyday jobs (2026)
How to use ImageJ and Fiji: get started, open an image, then 10 everyday jobs (scale, measure, threshold, count, background, blots) with exact menu paths.

How to set the scale and add a scale bar in ImageJ (with a calibration image to practise on)
Set the scale in ImageJ (Analyze › Set Scale) from a micrometer, scale bar or pixel size, add a scale bar, and practise on a free calibration image.