FFT bandpass filter and edge detection in ImageJ (with before/after examples)
FFT in ImageJ step by step: Process › FFT, Bandpass Filter settings, stripe removal and Find Edges, with before/after pictures and when filtering is safe.
Contents
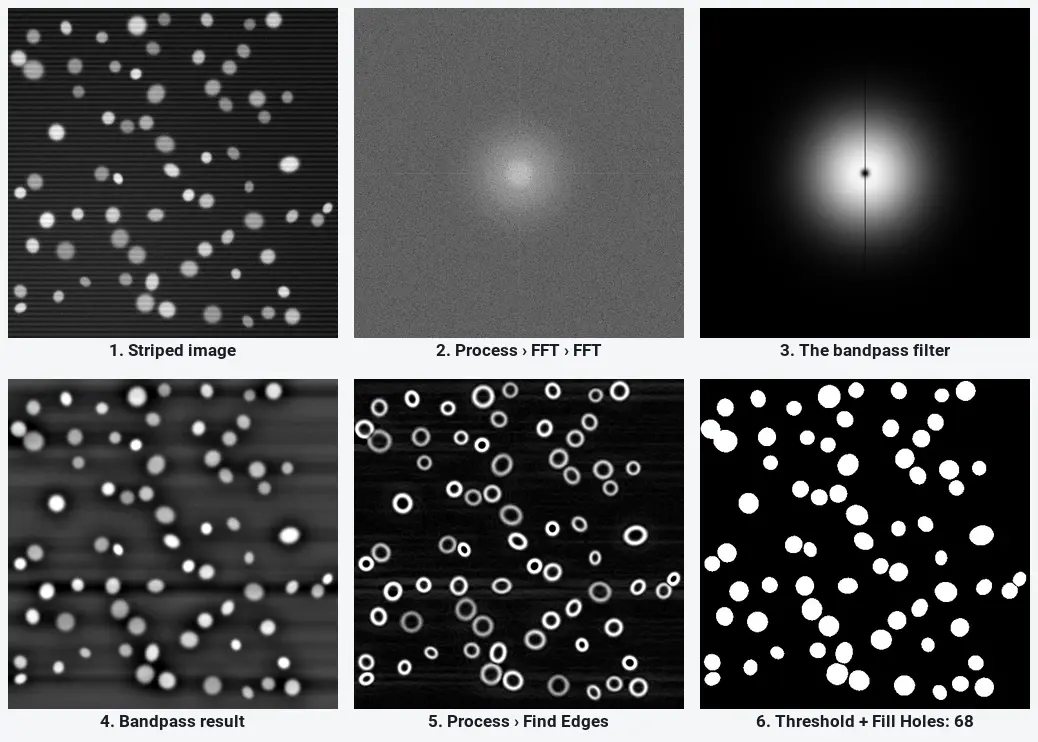
To filter an image by frequency in ImageJ, open it and run Process › FFT › Bandpass Filter…: type the size above which structures count as background (Filter large structures down to, 40 pixels by default) and the size below which they count as noise (Filter small structures up to, 3 pixels), choose Suppress stripes if the image has horizontal or vertical stripes, and click OK. To see the frequencies first, use Process › FFT › FFT. For edge detection, run Process › Find Edges (a Sobel filter), ideally on the bandpassed image.
Filtering is fine for finding objects (thresholding, counting, outlining). It is never fine for measuring intensity: on the sample below the bandpass filter lowered one nucleus by 17.8% and another by 0.7%.
What you need: ImageJ 1.x or Fiji (every command here is in both). Any grey image; the example is the synthetic nuclei sample (16-bit, 512 × 512 pixels, 0.325 µm per pixel, 70 nuclei, a background brighter at the lower left), plus a copy with horizontal stripes added, made for practice. Time: about 10 minutes.
What the FFT shows
The Fourier transform rewrites an image as a sum of waves. Each point of the power spectrum is one wave: its distance from the centre is how fine it is (centre = large, slow changes such as the background; edge = fine detail and pixel noise), and its direction is the direction of the wave. A filter in frequency space keeps some of those waves and throws the rest away, then turns the result back into an image.
That is why the bandpass filter is described in sizes. "Filter large structures down to 40 pixels" removes every wave longer than about 40 pixels; "Filter small structures up to 3 pixels" removes every wave shorter than about 3 pixels. What is left is the band in between, where nuclei, cells and particles live.
How do I use the FFT bandpass filter in ImageJ? Step by step
Step 1: Open the image
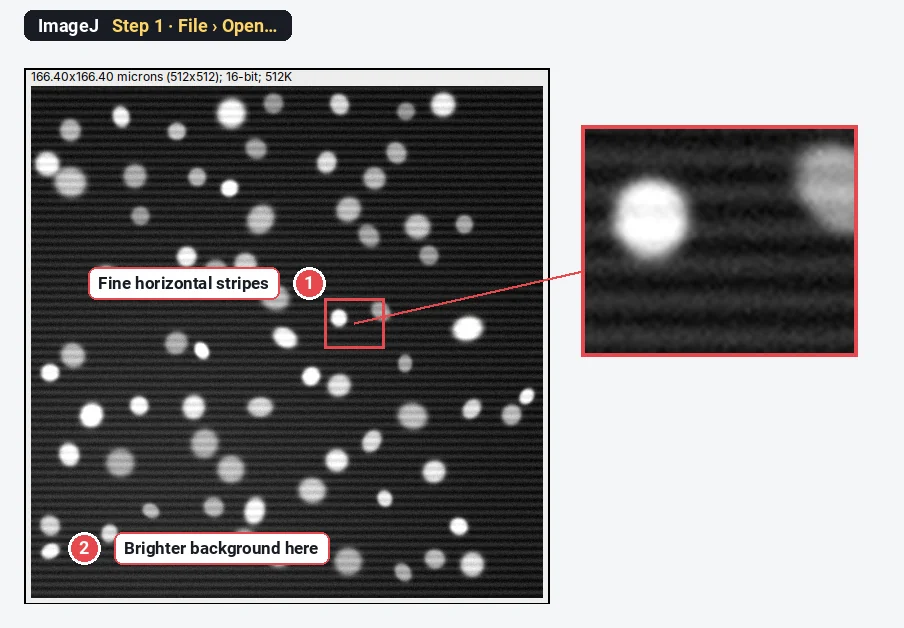
Click File › Open… and choose the image. Look at it before you filter: here there are fine horizontal stripes (one every 8 pixels) and the background is more than twice as bright at the lower left (1446 against 639 grey values in the opposite corner).
Step 2: Look at the power spectrum
Choose Process › FFT › FFT. A new window opens with the power spectrum. The bright blob in the centre is the large, slow changes; the grainy edge is noise. The stripes are two small bright dots above and below the centre, on the vertical axis: a pattern that repeats from top to bottom shows up on that axis.
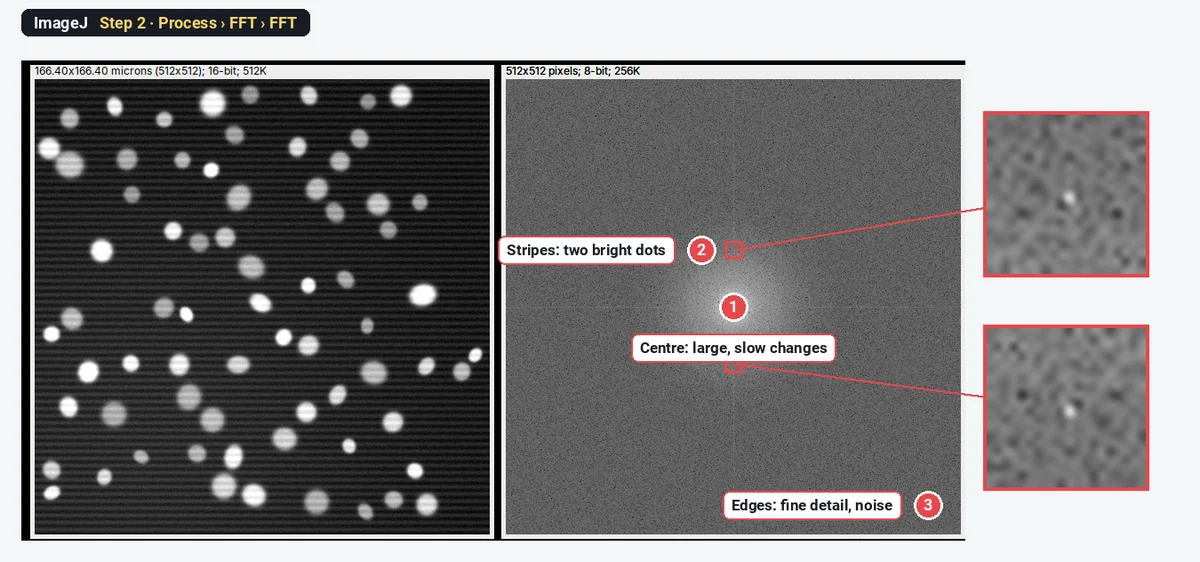
You do not have to use this window to filter. It tells you what is in the image: a dot or a line away from the centre is a regular pattern (stripes, a grid, mains hum on a camera), and you can then decide how to remove it.
Step 3: Open the Bandpass Filter and type the two sizes
Select the image window again and choose Process › FFT › Bandpass Filter….
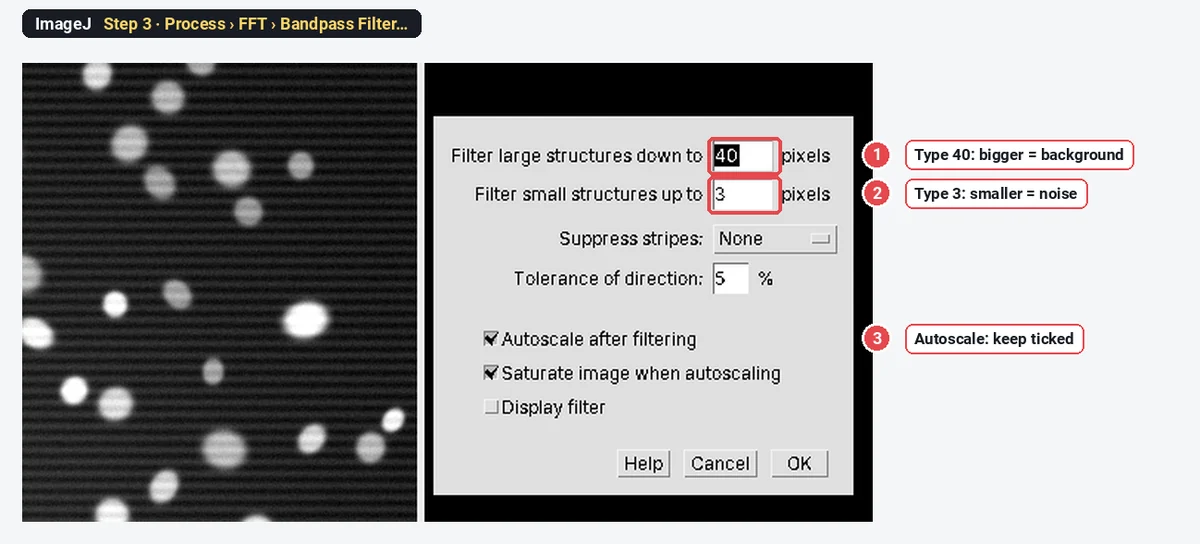
- Filter large structures down to: a little more than your largest object. Nuclei here are about 20 to 30 pixels across, so the default 40 keeps them and removes the slow background.
- Filter small structures up to: a little less than the finest detail you want to keep. The default 3 removes pixel noise but keeps the nucleus edges.
- Keep Autoscale after filtering and Saturate image when autoscaling ticked to see the result well (they change the values; see below).
Step 4: Choose the stripe direction
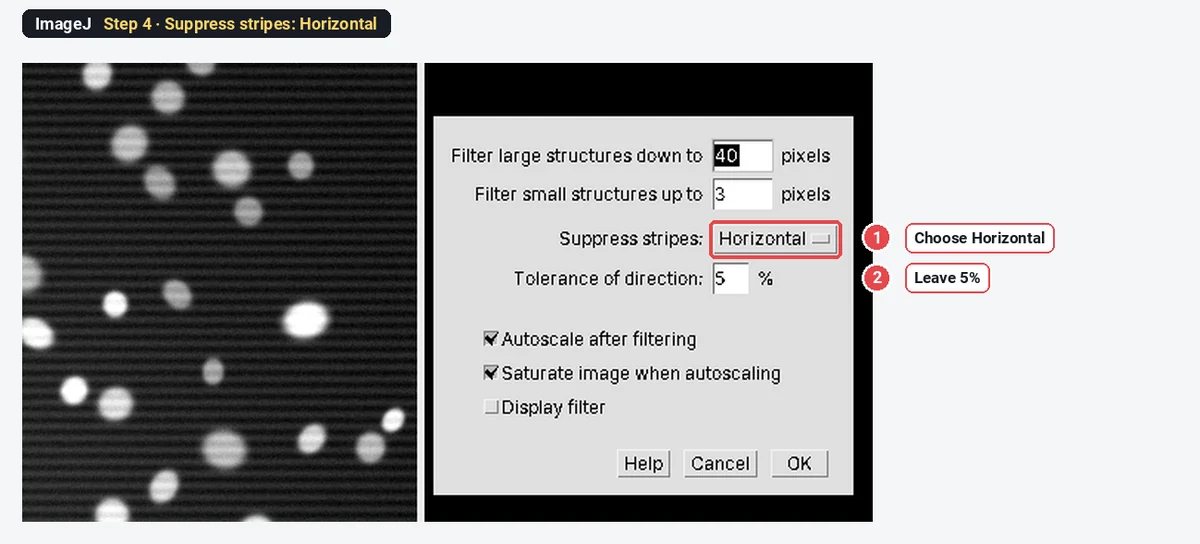
If the image has stripes, set Suppress stripes to their direction: Horizontal for stripes that run left to right, as here. Leave Tolerance of direction at 5%. Tick Display filter if you want to see what is removed. Click OK.
Step 5: Check the result
The filtered image replaces the original (use Edit › Undo or Image › Duplicate… first if you want both). With Display filter ticked, ImageJ also shows the filter: white is kept, black is removed. The black centre is the background you asked to remove, the dark rim is the noise, and the thin vertical line is the stripe cut.
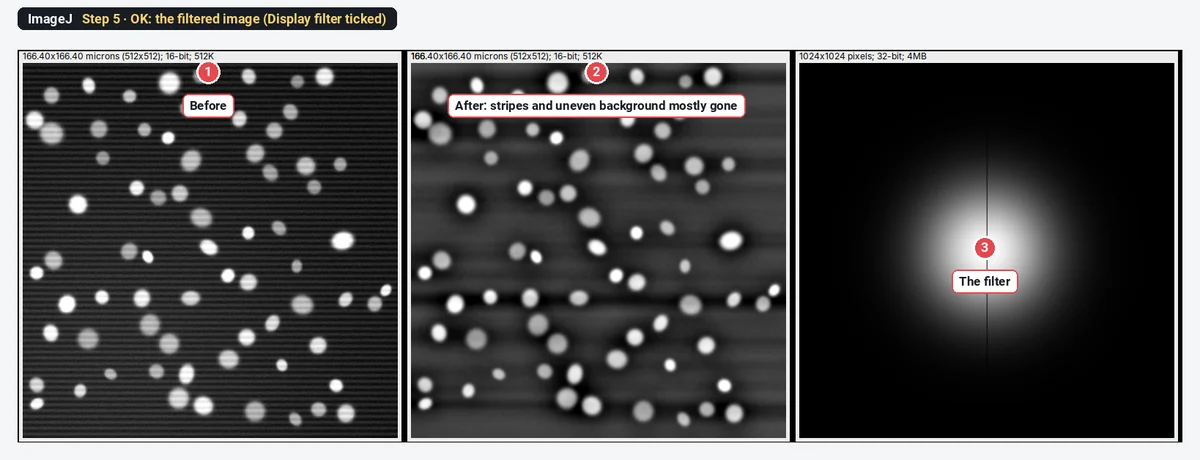
Measured on the unscaled result, the background corners went from 1446 and 639 grey values (2.3 times apart) to 1292 and 1193 (1.08 times apart).
Which sizes should I use? Before and after
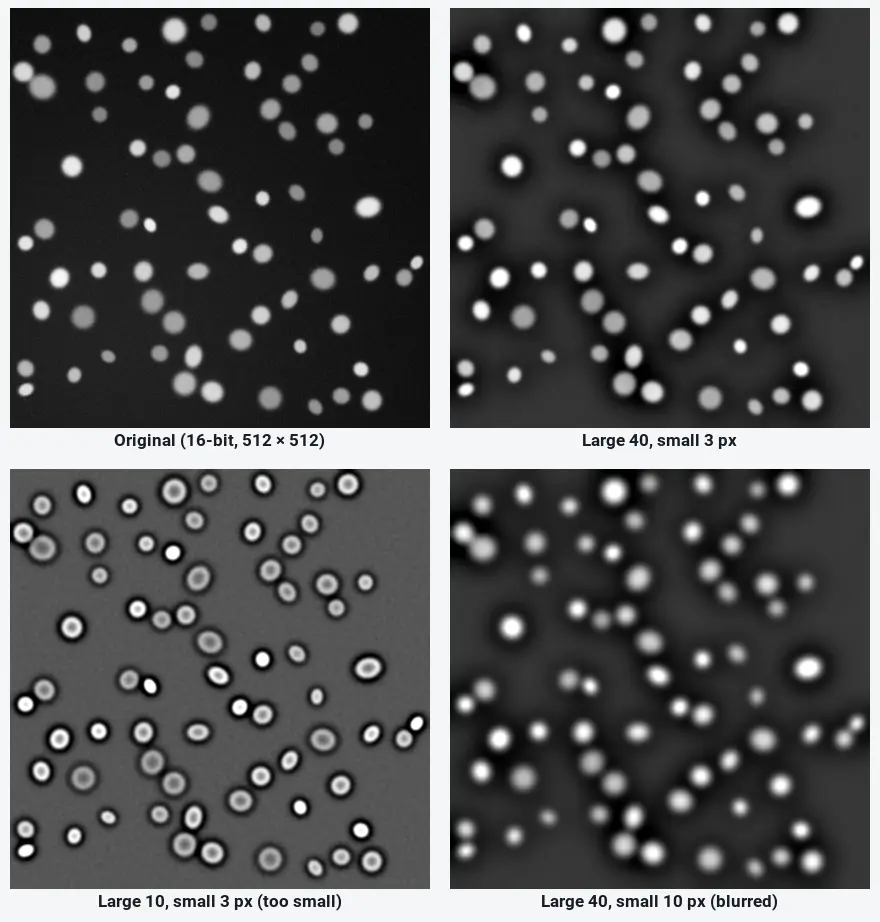
The two sizes are the only settings that matter. The grid shows them on the nuclei sample without stripes:
| Large / small (pixels) | What happens | Otsu count | % area |
|---|---|---|---|
| Original | Uneven background | 70 | 10.21 |
| 40 / 3 (default) | Background flattened, nuclei unchanged | 70 | 9.70 |
| 10 / 3 | Large below the nucleus size: centres hollowed out, dark halos | 70 | 9.15 |
| 40 / 10 | Small too large: nuclei soften and spread | 70 | 10.76 |
The count stays at 70 because these nuclei are bright and well apart; the % area shows the shapes changing. On a crowded or dim image, the wrong sizes merge or lose objects. The rule: large above your biggest object, small below your finest detail.
Horizontal or vertical stripes: which one?
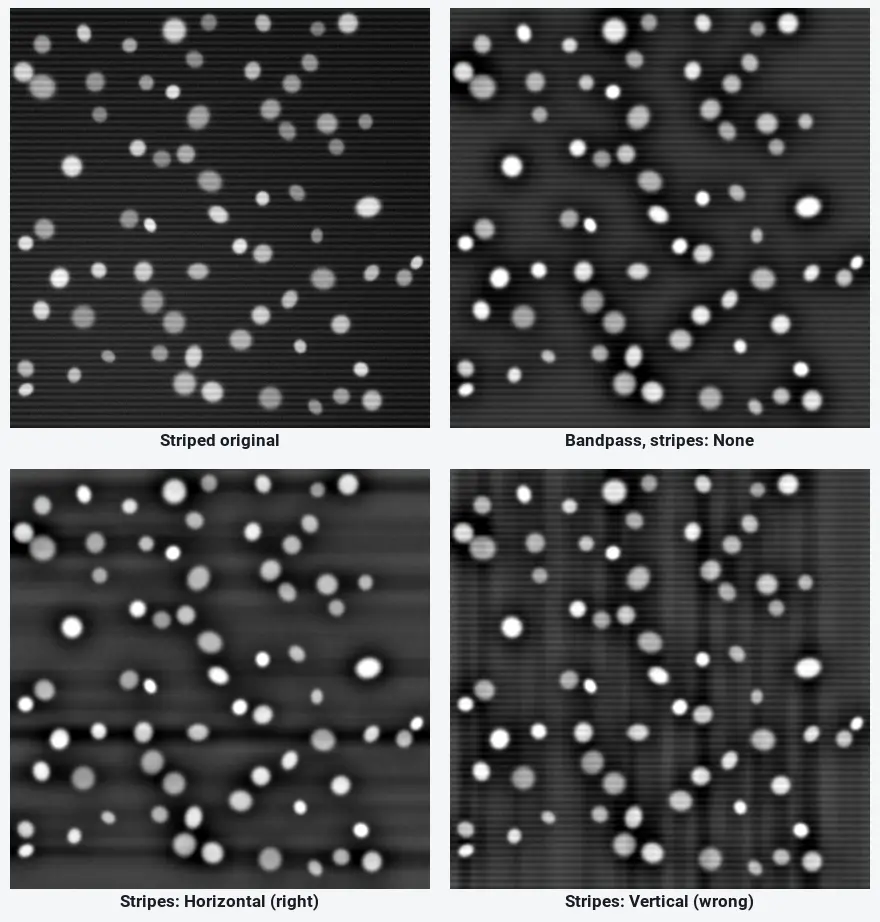
ImageJ names the stripes, not the line in the spectrum. Horizontal stripes (rows of light and dark) need Horizontal:
How do I detect edges in ImageJ?
Process › Find Edges is ImageJ's edge detector. It uses the Sobel operator: two 3 × 3 kernels measure the change in grey value across and down the image, and each pixel becomes the square root of the sum of the two squared. A sharp boundary becomes a bright line; a flat area becomes dark. It has no settings.
Step 1: Find Edges on the original
Open the image and choose Process › Find Edges (make a copy first with Image › Duplicate…; it replaces the image). Every nucleus becomes a ring; bright nuclei give bright rings, dim nuclei faint ones.
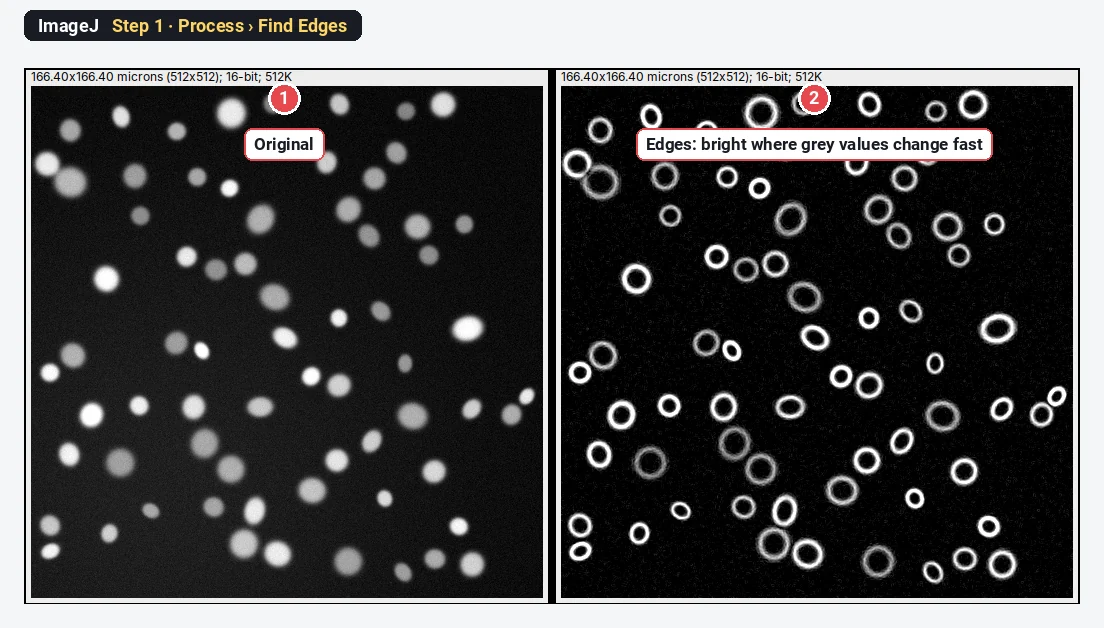
Step 2: Bandpass first, then Find Edges
Sobel works on 3 × 3 pixels, so noise and stripes become edges too. Run the bandpass filter from the first part (40/3) and then Process › Find Edges. The rings are now even and clean, dim nuclei included, because the bandpass evened out the background and the autoscale spread the values.
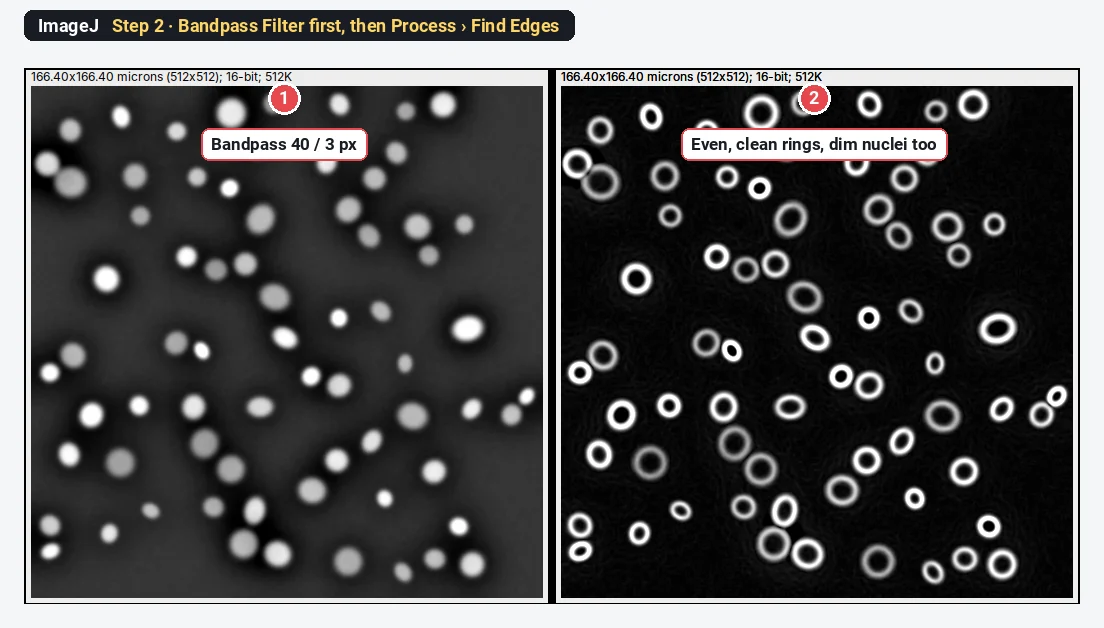
Step 3: Threshold the edges
Choose Image › Adjust › Threshold…, pick Otsu, tick Dark background, and check that every ring is red. On this image Otsu sets the threshold at 25186 (11.3% of the pixels). Click Apply (or Process › Binary › Convert to Mask).
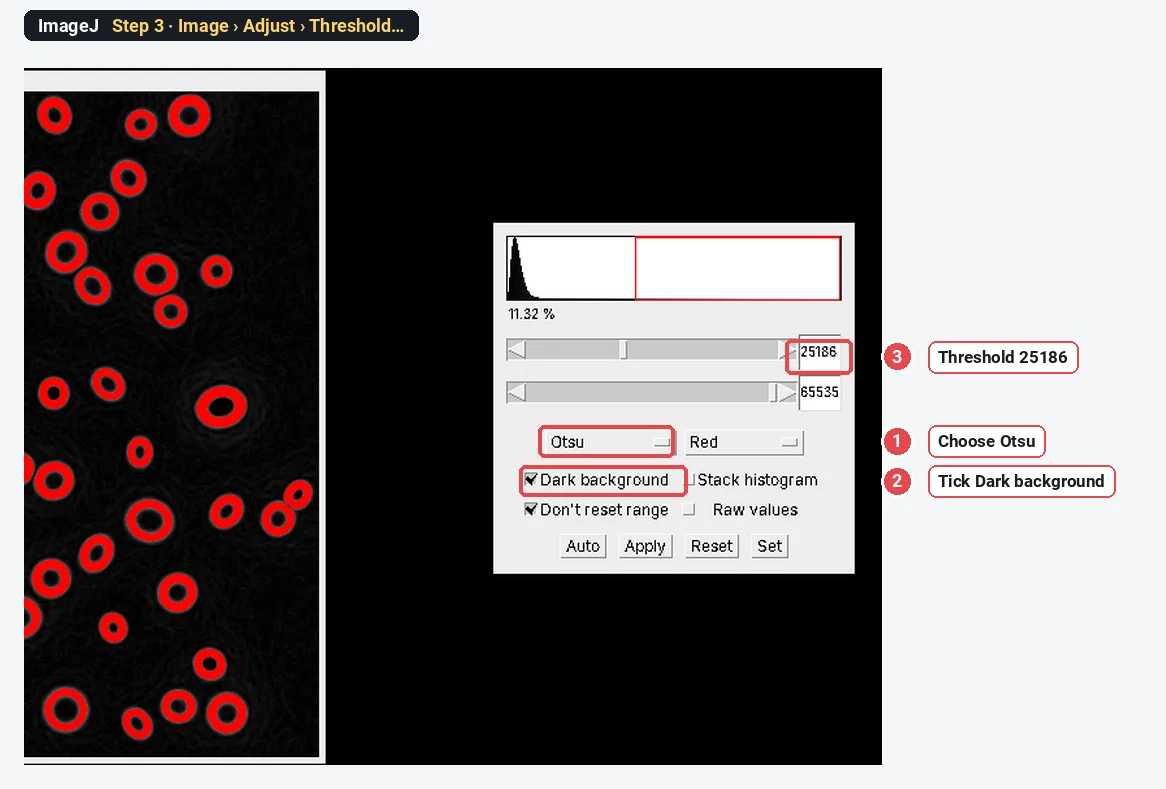
Step 4: Fill the rings and count
Run Process › Binary › Fill Holes to turn the rings into solid objects, then Analyze › Analyze Particles… with Summarize ticked.
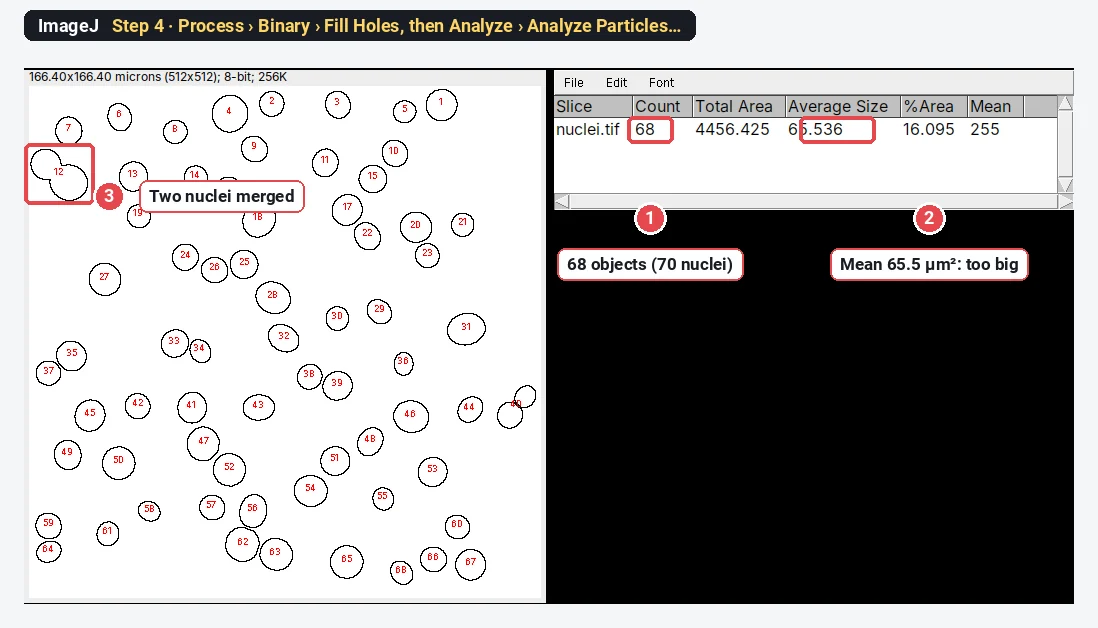
The result is honest about edges: 68 objects for 70 nuclei, and a mean size of 65.5 µm² against 40.4 µm² from a plain threshold. The Sobel ring is several pixels wide and sits half outside each nucleus, so objects made from edges are too big, and touching nuclei share one ring. Edges are good for seeing boundaries, finding shapes and guiding a watershed; for counting and sizing round objects, a threshold of the bandpassed image is better.
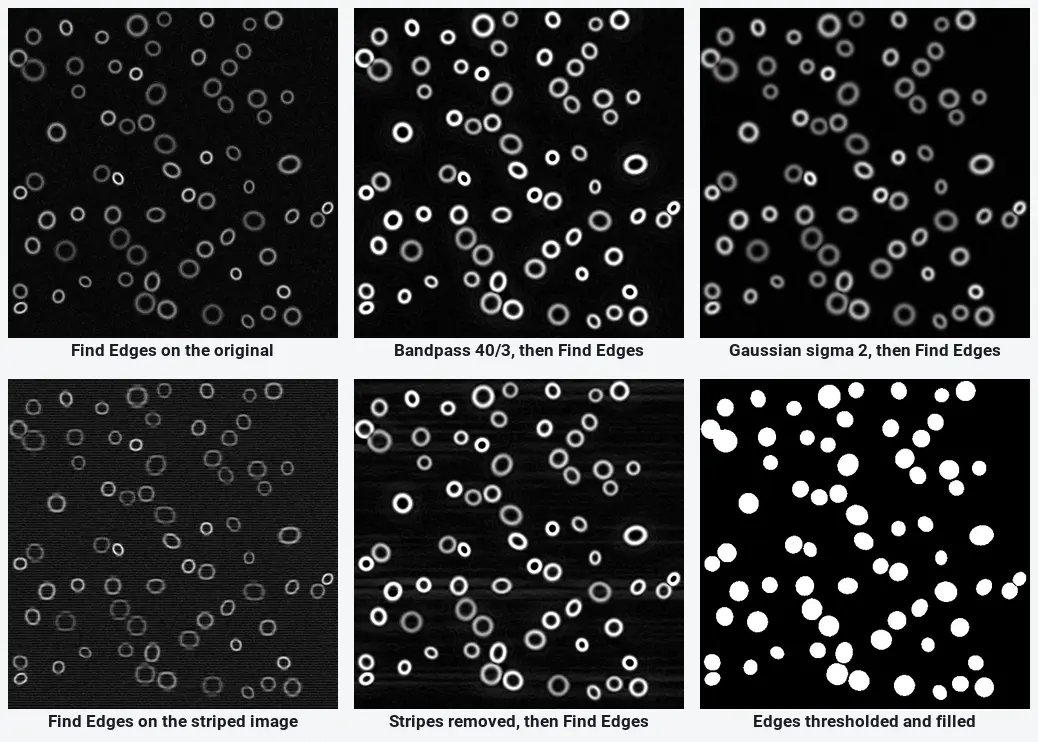
A Gaussian blur first (Process › Filters › Gaussian Blur…, sigma 2) also cleans the edges, but it does not flatten the background, so the dim nuclei stay faint. Fiji has more edge detectors through update sites (for example a Canny-type detector in FeatureJ on the ImageScience site); plain ImageJ has Find Edges only.
When is filtering OK, and when is it not?
The bandpass filter is a segmentation tool. It is the right step before a threshold, a particle count, a watershed or an outline. It is the wrong step before any intensity measurement: mean grey value, integrated density, CTCF, a ratio, a western blot band. On the sample:
| Nucleus | Original mean | After Bandpass 40/3 (no autoscale) | Change |
|---|---|---|---|
| Brightest (lower left) | 4932 | 4055 | −17.8% |
| Dimmest (upper right) | 3017 | 2995 | −0.7% |
| Ratio bright / dim | 1.64 | 1.35 |
The filter removes the slow background unevenly and trims the peak of small bright objects, so values change by different amounts in different places. With Autoscale on (the default) the values are also stretched to the full 16-bit range: the same two nuclei read 52,567 and 38,692. Neither version is a measurement of the sample.
The safe way:
- Image › Duplicate… the original. Filter the copy.
- Threshold and segment the filtered copy (mask or ROIs in the ROI Manager).
- In Analyze › Set Measurements… set Redirect to the original image, or apply the ROIs to the original, and measure there.
If the background really must come off before measuring, use Process › Subtract Background… (rolling ball) on the original and say so in the methods; see rolling-ball background subtraction.
Pitfalls
- Large size below the object size. The filter removes the inside of the objects and leaves rings with dark halos (the 10/3 tile above). Keep large above the biggest object.
- Wrong stripe direction. Horizontal stripes need Horizontal. The wrong one adds streaks.
- Measuring the filtered image. See above. Reviewers will ask.
- Filtering a stack slice only. For a stack, tick Process entire stack in the dialog, or only the current slice changes.
- Find Edges on a noisy image. Every noisy pixel becomes an edge. Filter first.
- 8-bit after autoscale. Converting the filtered 16-bit image to 8-bit after autoscale is fine for segmentation; it is one more reason not to measure intensity on it.
Reporting it
Images were bandpass filtered in ImageJ 1.54f (Process › FFT › Bandpass Filter; structures larger than [40] and smaller than [3] pixels removed, [horizontal stripes suppressed, tolerance 5%]) for segmentation only. Objects were thresholded (Otsu) on the filtered image; all intensities were measured on the original, unfiltered images.
Cite ImageJ (Schneider et al. 2012). If you show filtered images in a figure, say so in the legend.
Switch to LabCanvas: the same filter in a few clicks
LabCanvas Image Analysis has ImageJ's bandpass filter in the browser, with nothing to install.
- Click Open an image (or use a sample) and look at the Image check: it flags uneven illumination before you filter.
- In the Process tab › Enhance, choose FFT bandpass.
- Type the large and small sizes in pixels, and choose horizontal or vertical stripes if needed; apply it As a new image to keep the original.
- Threshold and count the copy in the Count tab, and measure intensities on the original.
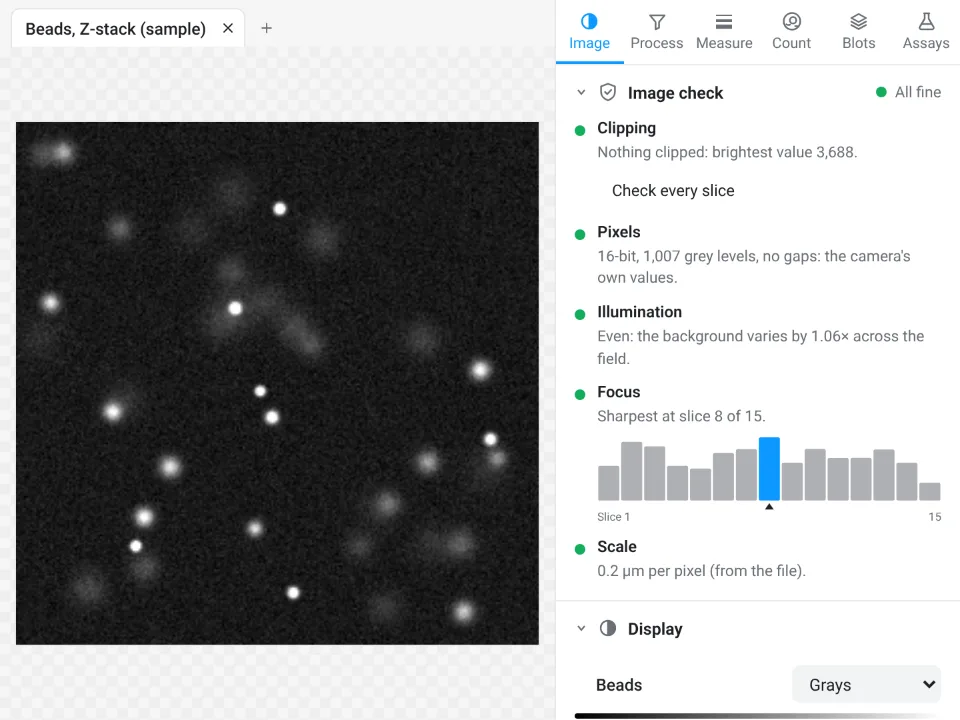
The app's bandpass code reproduces ImageJ's: run on the same two images (40/3, and 40/3 with horizontal stripes), its output matched ImageJ 1.54f's to within 1 grey value out of 65,535, with 99.7% of the pixels identical.
Why switch for this job:
- No install: the same filter on any computer or tablet, in the browser.
- Built-in guard rails: the Enhance panel says these steps are for seeing and segmenting, not for measuring intensities, and the image check flags uneven light first.
- Validated: every measurement is checked against reference software in more than 4,000 automated tests.
ImageJ stays better here in one way: LabCanvas has no separate Find Edges command and no editable power spectrum, so for Sobel edges or hand-painted FFT masks use ImageJ or Fiji.
Open Image Analysis: free with a LabCanvas account (downloading files is part of LabCanvas Pro). ImageJ and Fiji are independent open-source projects; LabCanvas is not affiliated with them.
References
- Schneider CA, Rasband WS, Eliceiri KW (2012). NIH Image to ImageJ: 25 years of image analysis. Nature Methods 9, 671–675. doi:10.1038/nmeth.2089
Frequently asked questions
How do I do an FFT in ImageJ?
Open the image and choose Process › FFT › FFT. ImageJ shows the power spectrum (the log-scaled magnitude of the Fourier transform) as a new 8-bit window, with the lowest frequencies in the centre. To filter, use Process › FFT › Bandpass Filter…, or paint over parts of the spectrum (black removes, white keeps) and run Process › FFT › Inverse FFT.
What do the FFT Bandpass Filter settings mean?
Filter large structures down to (default 40 pixels) removes anything larger than that size, such as an uneven background. Filter small structures up to (default 3 pixels) removes anything smaller, such as pixel noise. Suppress stripes removes horizontal or vertical stripes, Autoscale stretches the result to the full range, and Display filter shows the filter itself.
How do I remove stripes from an image in ImageJ?
Use Process › FFT › Bandpass Filter… with Suppress stripes set to Horizontal for horizontal stripes or Vertical for vertical ones, and Tolerance of direction at 5%. Stripes show up in the power spectrum as bright dots on one axis; the filter cuts that axis out. Choosing the wrong direction leaves the stripes and adds new artefacts.
How does Find Edges work in ImageJ?
Process › Find Edges is a Sobel edge detector: two 3 × 3 kernels measure how fast the grey value changes across and down the image, and each pixel becomes the square root of the sum of their squares. Edges come out bright and flat areas dark. Smooth or bandpass the image first, or the noise becomes edges too.
Can I measure intensity after an FFT bandpass filter?
No. The filter changes the values: on our sample it lowered the brightest nucleus by 17.8% and the dimmest by 0.7%, so their ratio fell from 1.64 to 1.35, and Autoscale then rescales everything. Use the filtered image only to find the objects, and measure on the original (Set Measurements › Redirect to).
Is there an easier way without installing ImageJ?
LabCanvas Image Analysis runs in the browser and has the same FFT bandpass (Process › Enhance › FFT bandpass), with large and small sizes and stripe removal. It is free with a LabCanvas account; it has no separate Find Edges command.
Try it in LabCanvas
Every app is free to start in your browser. Create an account and begin.
Start Image Analysis free in your browserKeep reading

ImageJ vs LabCanvas Image Analysis: an honest comparison
ImageJ/Fiji or LabCanvas Image Analysis? Six everyday jobs done in both, six newer ones (macros, vendor files, 3D, StarDist, big images) and which to use.

How to use ImageJ: a beginner's tutorial for the 10 everyday jobs (2026)
How to use ImageJ and Fiji: get started, open an image, then 10 everyday jobs (scale, measure, threshold, count, background, blots) with exact menu paths.

How to set the scale and add a scale bar in ImageJ (with a calibration image to practise on)
Set the scale in ImageJ (Analyze › Set Scale) from a micrometer, scale bar or pixel size, add a scale bar, and practise on a free calibration image.