IHC DAB quantification in ImageJ with colour deconvolution
Quantify DAB IHC in ImageJ/Fiji: colour deconvolution with H-DAB vectors, % positive area, optical density, and why DAB intensity is not linear.
Contents
To quantify DAB immunohistochemistry in ImageJ, separate the stains with colour deconvolution (in Fiji, Image › Color › Colour Deconvolution, vectors H DAB), threshold the DAB image and measure %Area for the DAB-positive area. For staining strength, convert the DAB image to optical density,
The worked example below uses a synthetic H-DAB section with known content: 140 cells, 54 of them DAB-positive.
What colour deconvolution does
A brightfield camera sees red, green and blue light. Hematoxylin (blue-purple) and DAB (brown) both absorb in all three channels, in different proportions, so no single channel holds just one stain. Colour deconvolution (Ruifrok and Johnston 2001) works in optical density, where stains add up:
- Optical density (OD, also called absorbance) is how much light a pixel lost:
- Each stain has a fixed OD vector, its OD in red, green and blue per unit of stain. For the standard H DAB set these are hematoxylin (0.650, 0.704, 0.286) and DAB (0.268, 0.570, 0.776).
- Every pixel's three ODs are written as an amount of hematoxylin times its vector plus an amount of DAB times its vector (plus a third, residual component). Solving those three equations gives one image per stain.
| Vectors option | Stains | Use for |
|---|---|---|
| H DAB | Hematoxylin, DAB | The usual brown IHC with a blue counterstain |
| H&E | Hematoxylin, eosin | Routine histology |
| H&E DAB | Hematoxylin, eosin, DAB | IHC with eosin counterstain |
| From ROI / user values | Your own | When your stains look different from the defaults (measure each on a single-stained slide) |
In Fiji: Colour Deconvolution step by step
- Open an RGB image taken with fixed white balance and exposure, and the lamp at the same setting for every slide. A TIFF is better than a JPEG.
- Check white. An empty area of the slide should be close to, but below, 255 in all three channels (Analyze › Measure on a rectangle there). Clipped white or a coloured cast skews every OD.
- Deconvolve. Image › Color › Colour Deconvolution, choose Vectors: H DAB, OK. Three new 8-bit images open: Colour_1 (hematoxylin), Colour_2 (DAB) and Colour_3 (the residual), each a transmittance image in which dark means more stain.
- Check the residual. Colour_3 should be nearly white. Structure there means the vectors do not fit your stains; measure your own from single-stained slides (From ROI).
- DAB-positive area. Select Colour_2, Image › Adjust › Threshold…, move the upper slider until the brown cells (not the counterstain) are red, and keep that value for every image. In Analyze › Set Measurements… tick Area, Area fraction and Limit to threshold, and press M: %Area is the DAB-positive percentage of the image (or of a tissue ROI you drew first).
- Staining strength (optional). Convert Colour_2 to OD: Image › Type › 32-bit, then Process › Math › Macro… with code
v = 0.4343 * log(255 / maxOf(v, 1))(log10 written with the natural log), and measure the mean OD inside the DAB-positive area.
Colour Deconvolution 2. Landini's newer version (Landini et al. 2021) is installed in Fiji from the Colour Deconvolution2 update site (Help › Update… › Manage update sites) and appears as Image › Color › Colour Deconvolution2. It can output optical density directly instead of 8-bit transmittance, which removes step 6, and handles user-defined vectors more flexibly.
What plain ImageJ 1.x can do: Color Threshold on the brown
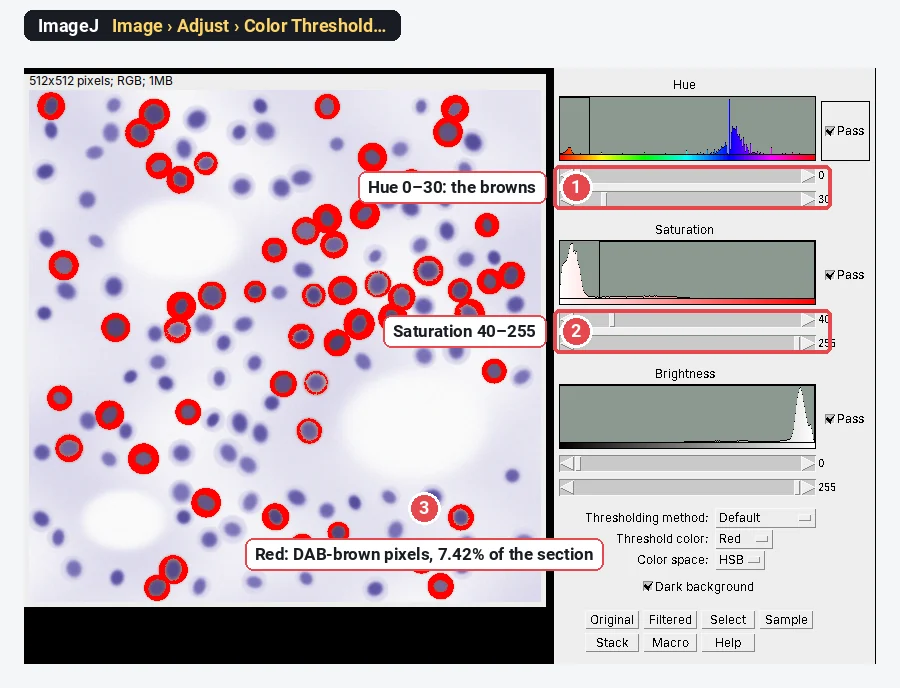
Without the plugin, Image › Adjust › Color Threshold… selects pixels by hue, saturation and brightness. It gives a DAB-positive area, not optical density.
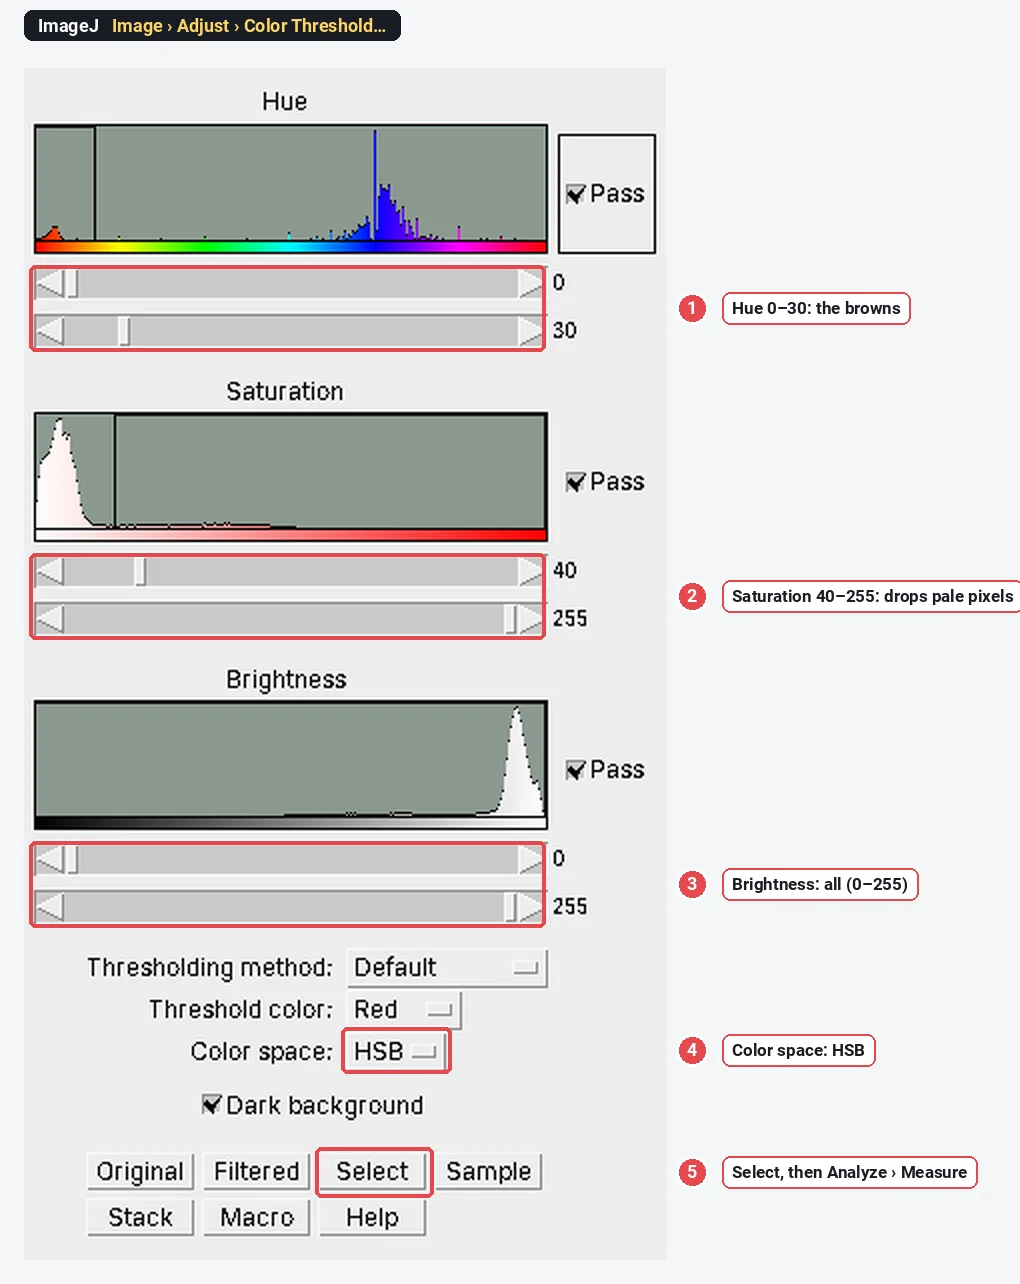
- Open the RGB image and run Image › Adjust › Color Threshold…, Color space: HSB.
- Set the Hue range to the browns (on ImageJ's 0–255 hue scale, about 0–30), the Saturation range from about 40 up (pale, nearly grey pixels have unreliable hue), and leave Brightness at 0–255.
- Click Select, then Analyze › Measure for the selected area; or click Macro to record the settings so every image gets the same ones.
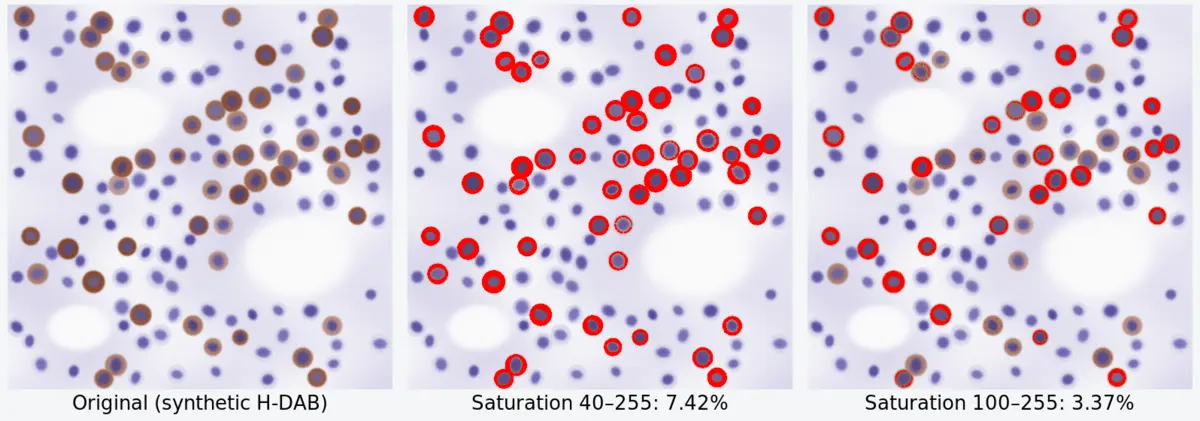
The catch is that the result moves with the saturation cut-off, because pale brown cells are both less saturated and less brown:
| Color Threshold (hue 0–30) | DAB-positive area |
|---|---|
| Saturation 25–255 | 7.97% |
| Saturation 40–255 | 7.42% |
| Saturation 60–255 | 6.17% |
| Saturation 100–255 | 3.37% |
Changing the hue range from 0–20 to 0–45 made no difference here (7.42% both times); saturation did all the work. Whatever you choose, choose it once, on a positive and a negative control, and apply it to every image unchanged.
Why DAB "intensity" is not linear
People often measure the mean grey value of the brown, or of the DAB channel, and call it expression. That number is not proportional to the amount of stain.
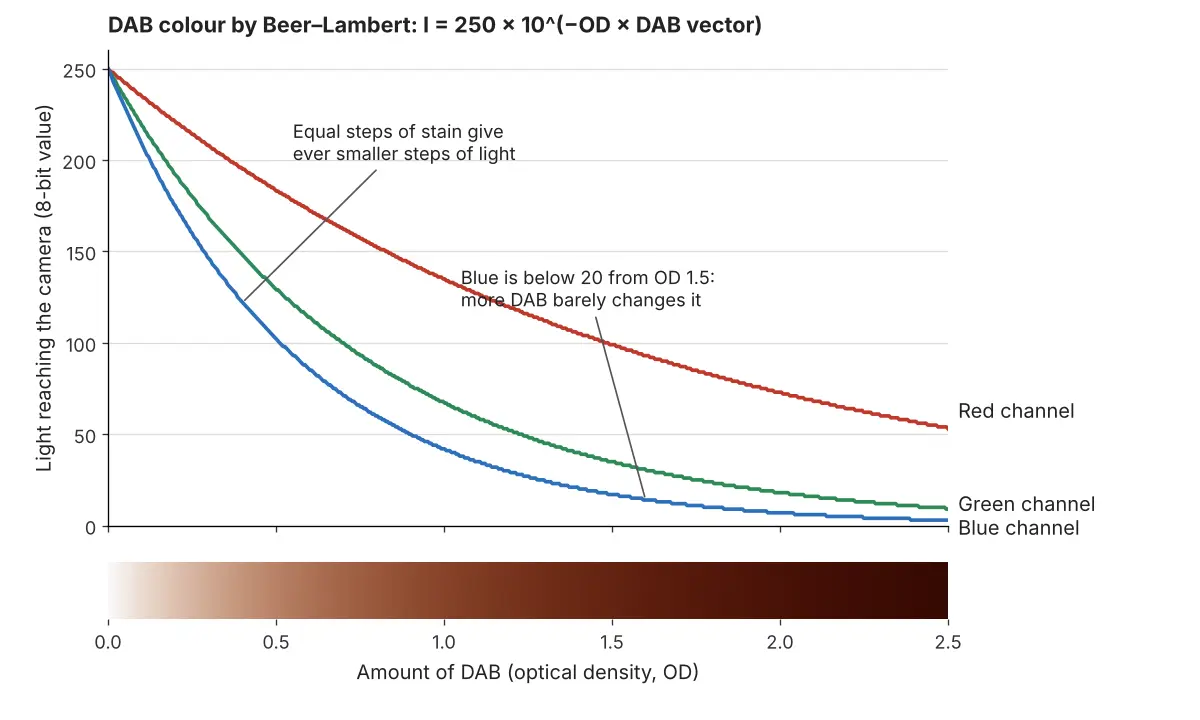
- Light falls exponentially with stain. Transmitted light
- Dark stain runs out of grey levels. In 8 bits the darkest measurable pixel has a value of 1, so the highest OD an 8-bit image can record is log10(255) ≈ 2.4, and camera noise makes values below about 10 unreliable well before that. Very dark DAB is effectively saturated. Ruifrok and Johnston reported that quantification held as long as saturation of the staining was prevented.
- The chemistry is not stoichiometric. DAB is deposited by peroxidase, so how much brown forms depends on the antibody dilution, amplification and incubation time as much as on the antigen. Sections stained on different days are not directly comparable.
So: use percent positive area, or the percentage of positive cells, as the main readout; report mean OD only for sections stained and imaged together; and keep exposure low enough that the darkest DAB is not clipped. Scoring systems such as the H-score (1 × % weak + 2 × % moderate + 3 × % strong cells, 0–300) still need the intensity bins fixed on controls.
Pitfalls
- JPEG and auto white balance. Compression shifts colours at cell edges, and auto white balance makes each image a different shade. Fix white balance and exposure, save TIFF.
- Clipped white or dark DAB. A background at 255 breaks the OD calculation; DAB at 0 in any channel is saturated. Check both before measuring.
- The wrong vectors. Every lab's hematoxylin and DAB look slightly different. If the residual channel shows structure, measure your own vectors from single-stained slides.
- Counterstain in the DAB channel. Strong hematoxylin bleeds a little into the DAB channel and vice versa; set the threshold on a negative control (primary antibody omitted) so counterstain alone stays below it.
- Tissue area, not image area. Holes, lumens and the slide edge are in the image but not in the tissue. Draw an ROI around the tissue, or threshold the tissue itself, and report DAB-positive area as a percentage of tissue.
- One field per sample. IHC staining is patchy. Measure several fields chosen by a rule (systematic random sampling, or every field in a region), not the prettiest one.
Reporting it
A methods sentence to copy, with the parts in brackets filled in:
DAB staining was quantified in [Fiji (ImageJ 1.54f)] on [n] fields per section imaged at [20×] with fixed exposure and white balance. Stains were separated by colour deconvolution (Ruifrok and Johnston 2001; Colour Deconvolution plugin, H DAB vectors), the DAB image was thresholded at [a value set on the negative control, applied to all images], and the DAB-positive area was expressed as a percentage of the tissue area.
Cite the software and the plugin (see how to cite ImageJ and Fiji). Show the percentage per animal or patient as points with the group mean, next to representative images of each group taken with the same settings, with a scale bar.
An easier way: DAB quantification in LabCanvas
Plain ImageJ needs a plugin for colour deconvolution. LabCanvas Image Analysis has it built in, in the browser, with nothing to install.
- Open your RGB image (or the stained-section sample from Process › Colour stains and thresholds) and go to Process › Colour deconvolution.
- Choose H-DAB (or H&E, H&E-DAB, or From ROIs to measure your own vectors on single-stained areas). The vectors in use are listed.
- Separate stains opens a 32-bit optical-density image, one channel per stain plus the residual, so there is no conversion step.
- The DAB positive block gives the DAB-positive area and the mean DAB optical density, with an automatic threshold (or yours), for the whole image or per ROI; Show positive pixels marks them.
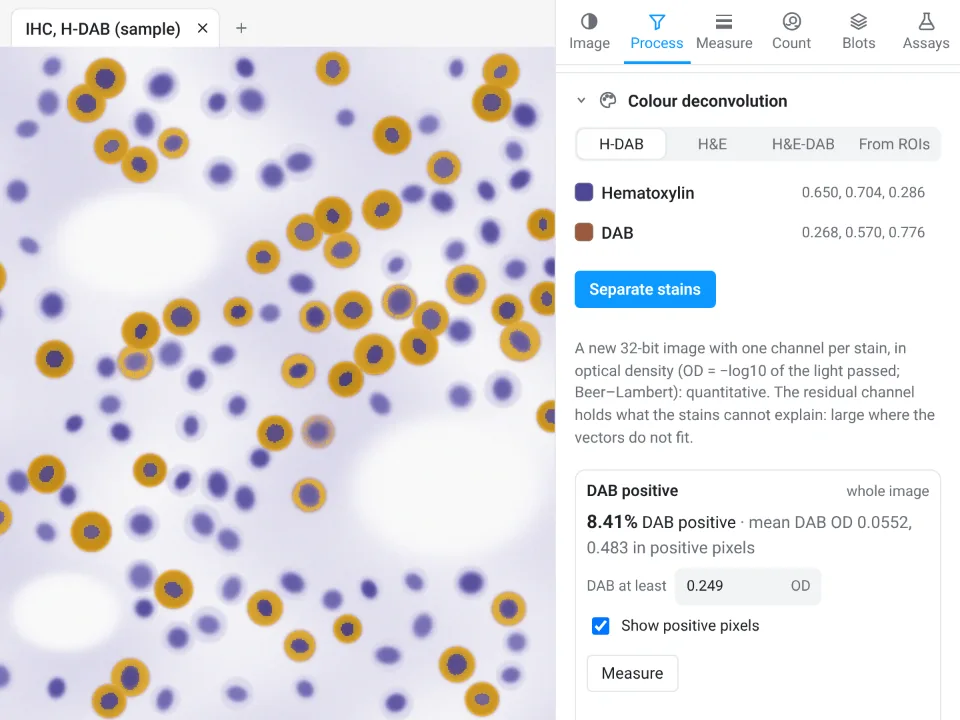
On the same synthetic section, the automatic threshold of 0.249 OD gives 8.41% DAB positive, with a mean DAB OD of 0.0552 over the image and 0.483 in the positive pixels. ImageJ's Color Threshold at saturation 40–255 gave 7.42%, and the sample was made with 10.4% of the field above 0.15 OD of DAB: each cut-off draws the line in a different place, so set yours on controls.
Why it is a good choice for DAB:
- No plugin: colour deconvolution with the Ruifrok and Johnston vectors, straight to optical density.
- An image check that flags clipped pixels and JPEG compression before you measure.
- Colour threshold in the same tab, by hue, saturation and brightness or L*a*b*, like ImageJ's Color Threshold.
- Send to Graphs for the per-section percentages with statistics, and a methods sentence with every table. Free with a LabCanvas account; downloading CSV files is part of LabCanvas Pro.
For whole-slide images (.svs, .ndpi, .mrxs) and positive-cell detection across a slide, QuPath (Bankhead et al. 2017) is purpose-built and the better tool; LabCanvas suits fields exported as TIFF, PNG or JPEG. Open Image Analysis, or read the complete guide.
ImageJ and Fiji are independent open-source projects; LabCanvas is not affiliated with them.
References
- Bankhead P, Loughrey MB, Fernández JA, et al. (2017). QuPath: open source software for digital pathology image analysis. Scientific Reports 7, 16878. doi:10.1038/s41598-017-17204-5
- Landini G, Martinelli G, Piccinini F (2021). Colour deconvolution: stain unmixing in histological imaging. Bioinformatics 37, 1485–1487. doi:10.1093/bioinformatics/btaa847
- Ruifrok AC, Johnston DA (2001). Quantification of histochemical staining by color deconvolution. Analytical and Quantitative Cytology and Histology 23, 291–299. PMID: 11531144
- Schindelin J, Arganda-Carreras I, Frise E, et al. (2012). Fiji: an open-source platform for biological-image analysis. Nature Methods 9, 676–682. doi:10.1038/nmeth.2019
Frequently asked questions
Is colour deconvolution in ImageJ?
Not in plain ImageJ 1.x: ImageJ 1.54f has no colour deconvolution command. It is Gabriel Landini’s plugin, included in Fiji under Image › Color › Colour Deconvolution; the newer Colour Deconvolution 2 installs from its own Fiji update site and appears as Image › Color › Colour Deconvolution2. In plain ImageJ you can add the plugin’s .jar to the plugins folder.
How do I quantify DAB staining in ImageJ?
In Fiji, run Image › Color › Colour Deconvolution with the H DAB vectors. Take the DAB image (Colour_2), set a threshold with Image › Adjust › Threshold, tick Area fraction (and Limit to threshold) in Set Measurements, and press M: %Area is the DAB-positive area. For staining strength, convert the DAB image to optical density,
Why is DAB intensity not linear?
A camera records transmitted light, which falls exponentially with the amount of stain (Beer–Lambert law), so equal amounts of extra DAB darken a pale cell a lot and a dark cell hardly at all. Optical density, the log of the light lost, undoes that, but dark DAB still bottoms out near zero light in 8 bits, and the enzyme reaction that deposits DAB is not proportional to the antigen. Treat DAB intensity as semi-quantitative.
What are the H-DAB colour deconvolution vectors?
The Ruifrok and Johnston (2001) optical-density vectors, normalised to length 1, are hematoxylin (0.650, 0.704, 0.286) and DAB (0.268, 0.570, 0.776) for red, green and blue. A third vector is computed to complete the set and collects what the two stains cannot explain.
Should I report percent positive area or mean intensity?
Percent positive area (or the percentage of positive cells) is the more robust number for DAB, because it depends only on whether a pixel is above a threshold. Mean optical density adds information about staining strength but is affected by staining time, section thickness and non-linearity, so use it only to compare sections stained and imaged together.
Try it in LabCanvas
Every app is free to start in your browser. Create an account and begin.
Start Image Analysis free in your browserKeep reading

ImageJ vs LabCanvas Image Analysis: an honest comparison
ImageJ/Fiji or LabCanvas Image Analysis? Six everyday jobs done in both, six newer ones (macros, vendor files, 3D, StarDist, big images) and which to use.

How to use ImageJ: a beginner's tutorial for the 10 everyday jobs (2026)
How to use ImageJ and Fiji: get started, open an image, then 10 everyday jobs (scale, measure, threshold, count, background, blots) with exact menu paths.

How to set the scale and add a scale bar in ImageJ (with a calibration image to practise on)
Set the scale in ImageJ (Analyze › Set Scale) from a micrometer, scale bar or pixel size, add a scale bar, and practise on a free calibration image.