Z Project in ImageJ: maximum, average and sum projections compared
Image › Stacks › Z Project in ImageJ: what Max Intensity, Average, Sum Slices, SD, Min and Median give, when Sum beats Max, and how to check depth.
Contents
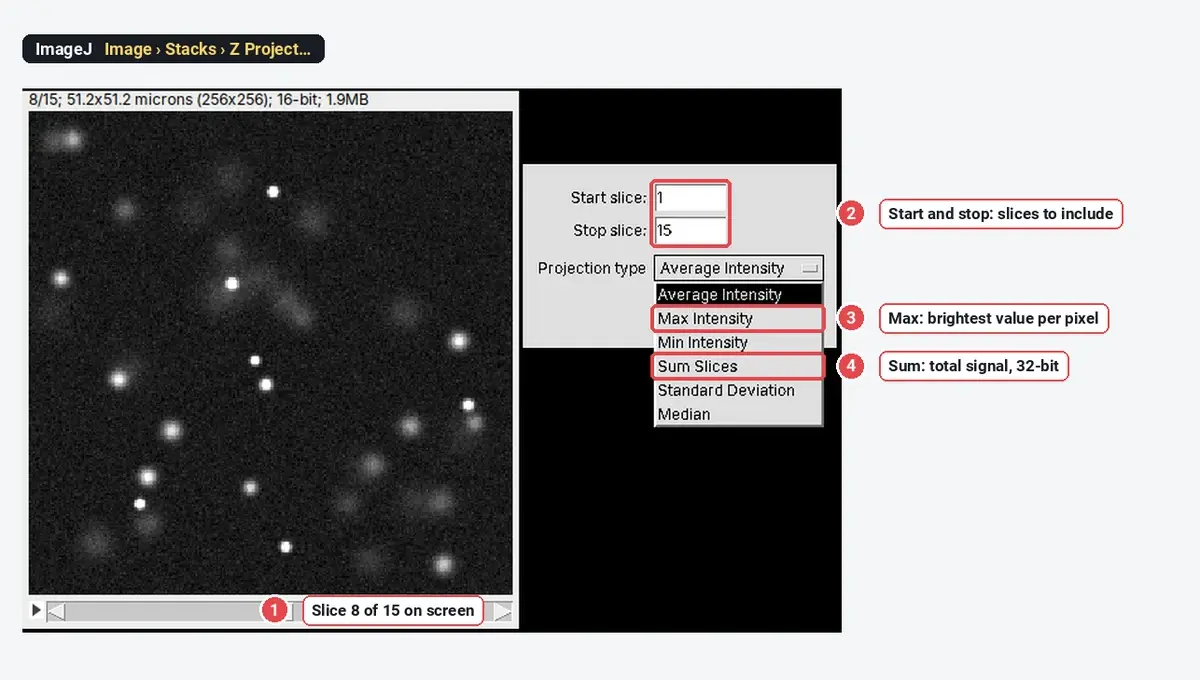
To make a maximum intensity projection in ImageJ, open the Z-stack and choose Image › Stacks › Z Project…, set Start slice and Stop slice, pick Max Intensity as the Projection type and click OK: a new image, MAX_ plus the stack name, shows the brightest value of every pixel through the slices. Use Sum Slices instead when you want to measure total intensity, and Average Intensity when you want a quieter image of an even sample.
Max shows structure; Sum measures amount; Average lowers noise.
Below: the six projection types side by side on the same stack, with the numbers ImageJ gave, the case where Sum beats Max, how projection changes your background, and Orthogonal Views for checking depth. The stack is synthetic: 40 fluorescent beads, each in focus at its own depth, 15 slices 0.5 µm apart, 0.2 µm pixels.
What does a Z projection do?
A Z-stack is a pile of images of the same field taken at different focus depths. A projection looks down through the pile at each pixel position (each x, y) and reduces the 15 values it finds there to one number. The method you choose decides which number:
| Projection type | Each output pixel is | Use it for |
|---|---|---|
| Max Intensity | The brightest of the slices | Figures; seeing every object in focus at once; counting point-like objects |
| Sum Slices | The sum of the slices | Total signal per object, when objects span several slices |
| Average Intensity | The mean of the slices | A smoother image; the same information as Sum, divided by the number of slices |
| Standard Deviation | The SD of the slices | Where things change through the stack; in a time-lapse, what moves or flickers |
| Min Intensity | The darkest of the slices | The background floor; in a time-lapse, removing moving objects |
| Median | The median of the slices | A robust background or reference image, ignoring rare bright events |
The same command works on time-lapse stacks, where the "depth" is time: a Max projection of a time-lapse shows every place a particle visited, which is the quickest way to find a track for a kymograph.
How do I Z project in ImageJ (or Fiji)?
Z Project is part of ImageJ 1.x, so the steps are the same in Fiji.
- Open the stack. Check the slice count and the spacing with Image › Properties… (Voxel depth).
- Scroll through it with the slider under the image. Note the first and last slices that contain your sample.
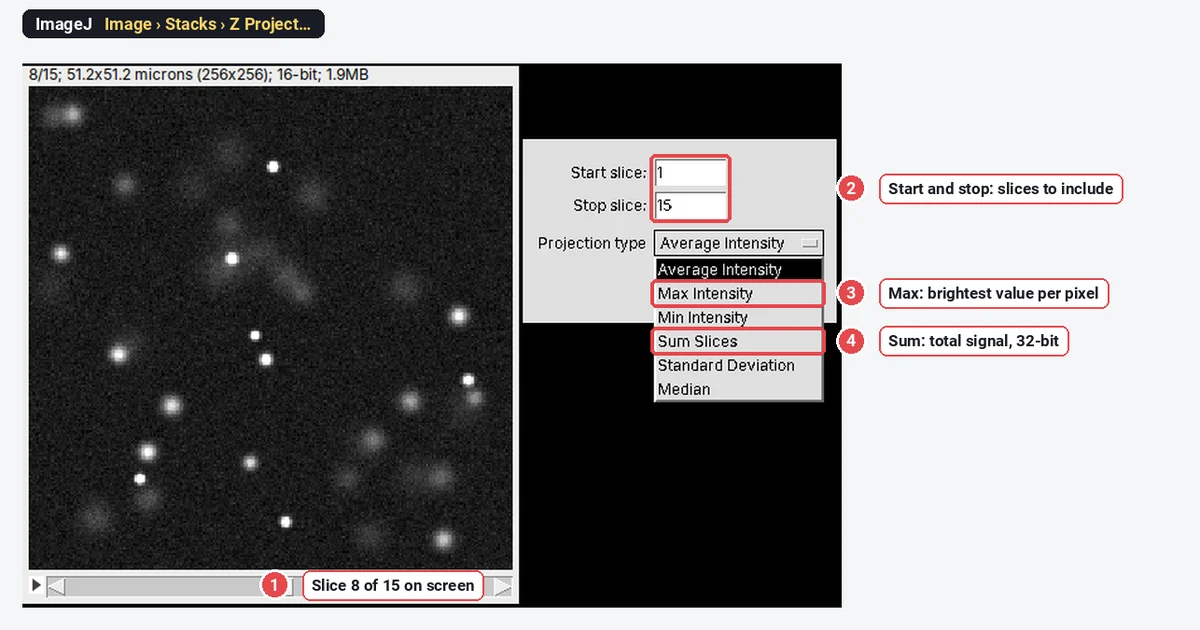
- Image › Stacks › Z Project…
- Start slice and Stop slice: the range to include.
- Projection type: Max Intensity, Sum Slices, or one of the others. In a fresh ImageJ 1.54f the dialog opened on Average Intensity, and it remembers your last choice afterwards, so check it.
- For a hyperstack with several time points, tick All time frames to get a projection at every time point.
- Click OK. The result opens as a new image named MAX_, SUM_, AVG_, STD_, MIN_ or MED_ followed by the stack's name.
In a macro:
run("Z Project...", "start=1 stop=15 projection=[Max Intensity]");The six projections compared
Here are all six on the same stack, each shown with its own display range (in brackets: the bit depth and range of values ImageJ returned):
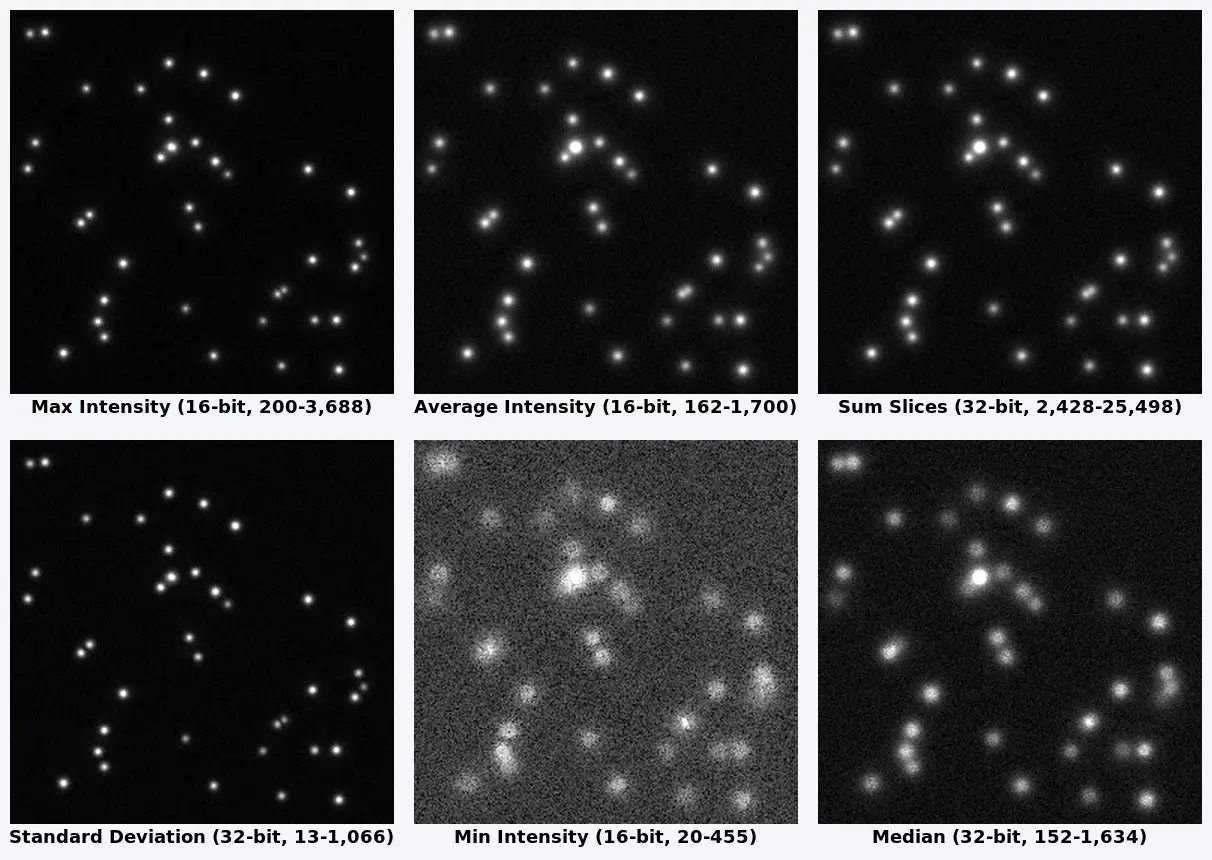
Some things to notice:
- Max and Standard Deviation look almost the same here. Both pick out what is bright on some slices and dark on others. On a stack where something is bright everywhere, they differ.
- Average and Sum are the same picture on different scales: Sum is 15 times Average. Only the numbers differ, and Sum keeps them exact.
- Min is not empty. Its brightest values (up to 455) are where a bead's blur covers every slice; Min shows how far out-of-focus light reaches.
- Bit depth. In ImageJ 1.54f, Sum Slices, Standard Deviation and Median came back as 32-bit images; Max, Min and Average stayed 16-bit, like the stack. Average is therefore rounded to whole numbers on a 16-bit stack.
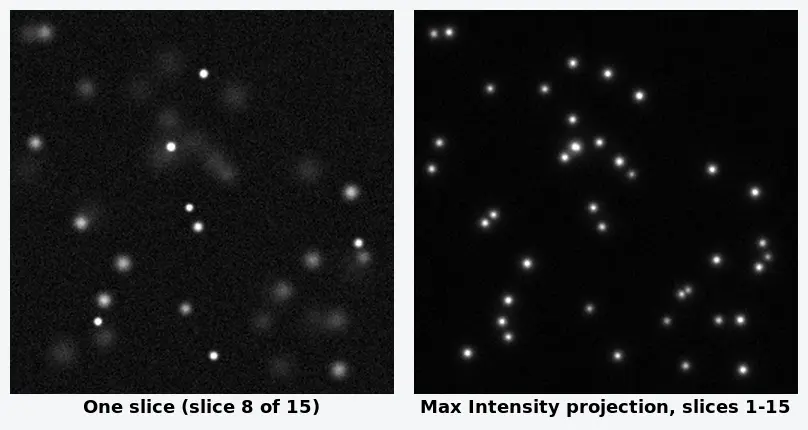
What the projection gains is plain when you put one slice next to the Max projection:
What happens to the background and the noise?
Projection changes the floor you measure against. We measured a bead-free corner of each image in ImageJ:
| Image | Background mean | Background SD (noise) |
|---|---|---|
| One slice (slice 8) | 201.5 | 40.1 |
| Max Intensity | 268.9 | 21.7 |
| Average Intensity | 199.8 | 10.1 |
| Median | 199.7 | 12.5 |
| Sum Slices | 2,996.9 | 152.1 |
| Min Intensity | 129.9 | 22.4 |
- Max raises the background. The brightest of 15 noisy values is always above their mean: here 268.9 instead of about 200, roughly 1.7 noise SDs higher. Any intensity measured on a Max projection sits on this inflated floor, and dim objects are harder to separate from it.
- Average cuts the noise by about
- Sum adds every slice's background. About 15 × 200 = 3,000 here. Subtract the background (per slice, or n × the slice background) before you compare sums.
When does Sum beat Max for intensities?
Max reports the brightest voxel in each column and nothing about how many slices the object fills. Two nuclei with the same stain concentration, one 3 µm thick and one 9 µm thick, give about the same Max value; their Sum values differ about threefold, as their total stain does. So:
- Use Sum Slices for amounts: the total fluorescence of a cell, a nucleus or a spheroid that spans several slices; the integrated density of a structure whose thickness varies between conditions. Subtract the background from each slice first (see rolling-ball background subtraction), include every slice the objects occupy, and keep the slice range the same for all stacks.
- Max is fine for small objects sampled finely in Z. On our beads, which are point-like and sampled every 0.5 µm, the Max value of each well-separated bead tracked its known brightness closely (a spread of 3.7% in the ratio, over 14 beads), better than a 7-pixel Sum measurement around each bead (11.5%), which picks up neighbouring haze. Count spots, measure their positions or show them on a Max projection; for whole-cell totals, sum.
- Never compare intensities between a Max projection and single slices, or between Max projections of stacks with different slice spacing. Coarser sampling misses the true peak of thin objects more often.
Saturation is the other trap: a Max projection collects the brightest pixel of every slice, so it shows saturated pixels (4095 on a 12-bit camera, 65535 on 16-bit) more than any slice. Check the raw stack, not the projection. Our stack's brightest value is 3,688, well below saturation.
How do I check depth with Orthogonal Views?
A projection throws depth away: two beads one above the other look like one. Image › Stacks › Orthogonal Views (Ctrl Shift H) keeps the stack and adds two side views through the point you click: XZ below the image and YZ beside it. Click a bead and both views pass through it.
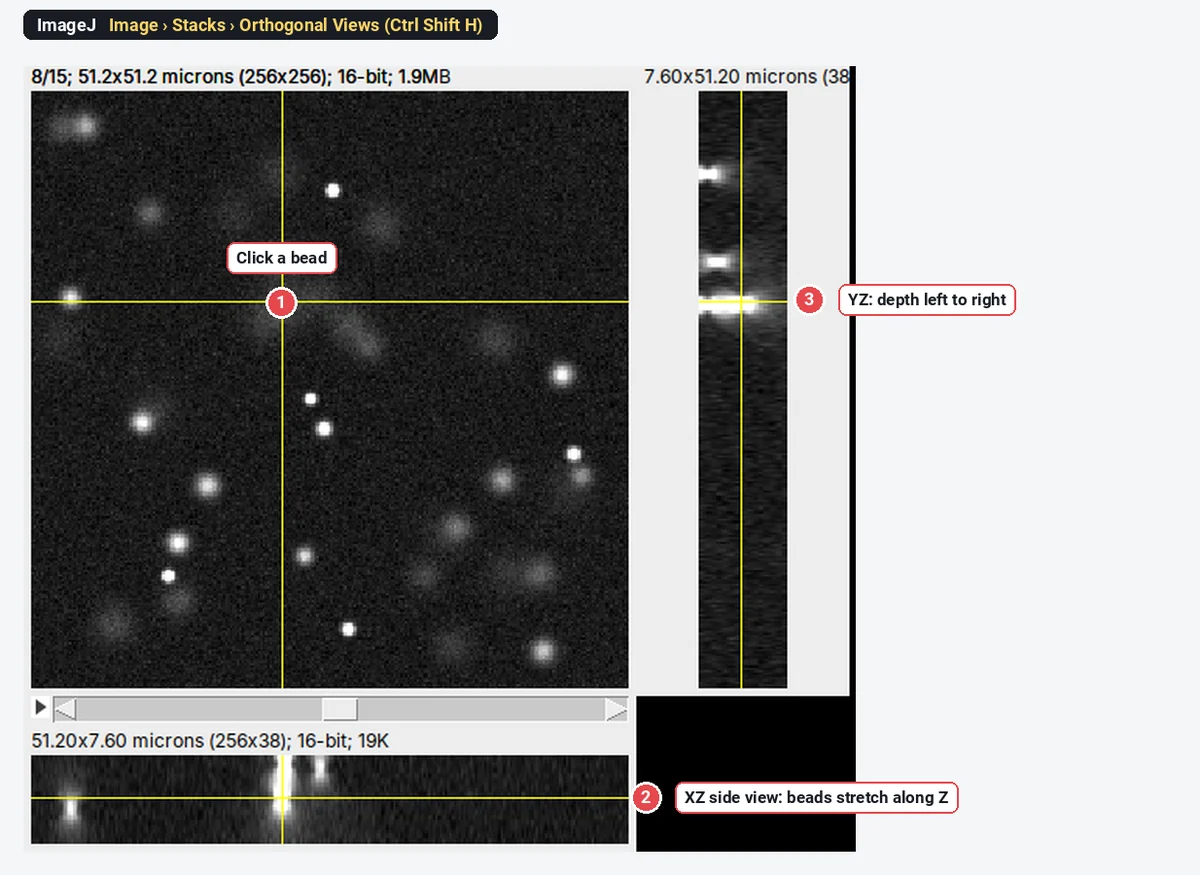
ImageJ scales the side views by the voxel depth: 15 slices 0.5 µm apart are drawn 38 pixels tall, 7.6 µm at 0.2 µm per pixel. If your stack's Voxel depth is wrong in Image › Properties…, the side views are squashed or stretched; fix it there. Image › Stacks › Reslice… makes the same kind of side view as a new stack, along a line you draw.
For true 3D work (object volumes, distances in 3D, rendering), Fiji's plugins such as 3D Viewer and 3D object counters, or dedicated 3D software, go further than any projection.
Pitfalls
- Max projection for total intensity. It ignores thickness and inflates the background.
- Projecting empty slices. Slices above and below the sample add haze to Sum and Average and noise to Max. Trim with Start and Stop slice.
- Different slice ranges between conditions. Sum depends on how many slices you add.
- Thresholding a Max projection to count cells that overlap in Z. Two cells above each other become one object. Check with Orthogonal Views.
- Forgetting the dialog's remembered setting. It opens on whatever type you used last.
- A wrong voxel depth distorts side views and any 3D measurement. Set it in Image › Properties….
- Projecting a drifting stack. If the sample moved between slices, correct the drift first, or every object smears.
Reporting it
A methods sentence to copy:
Z-stacks ([15] slices, [0.5] µm apart) were projected in [Fiji (ImageJ 1.54f)] with Image › Stacks › Z Project ([Sum Slices] over slices [1–15]) after rolling-ball background subtraction of each slice ([radius 50 pixels]); [maximum intensity projections] are shown for display only.
Say which projection you measured on and which you show, give the slice range and spacing, and cite ImageJ or Fiji.
An easier way: Z projection in LabCanvas
LabCanvas Image Analysis projects stacks in the browser, with nothing to install and no plugins. It reads TIFF, BigTIFF and OME-TIFF stacks with their slice spacing.
- Open the Z-stack and go to Image › Stack and image.
- Under Z projection, choose Maximum, Average, Sum, Standard deviation, Minimum or Median, and the slices to include.
- The projection opens as a new image, ready to measure; Orthogonal views gives XZ and YZ strips through a point you pick, and Reslice along a selected line.
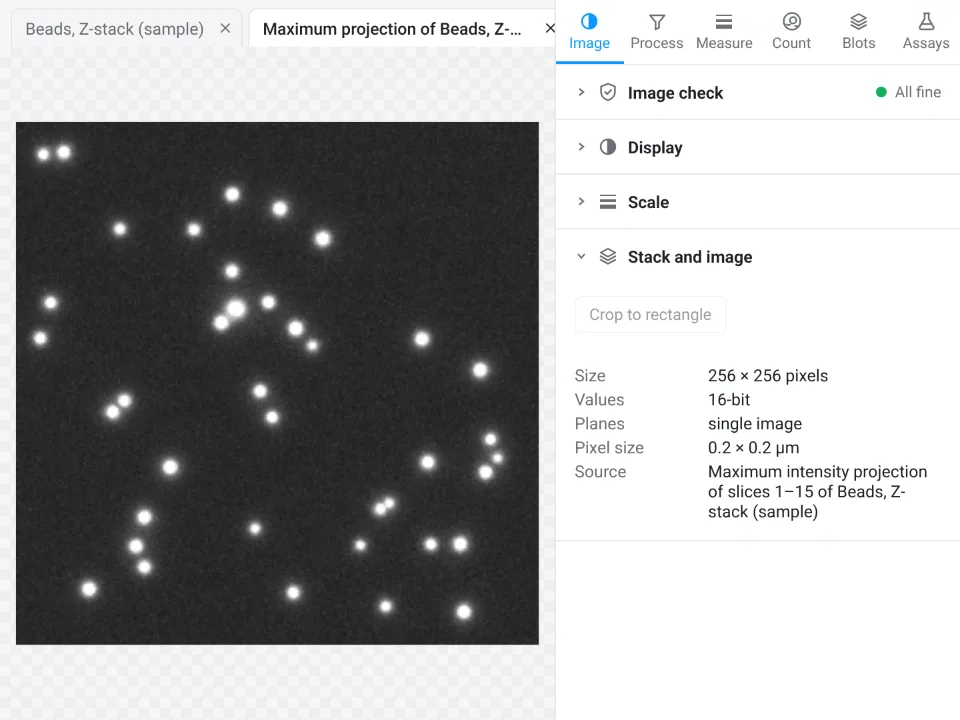
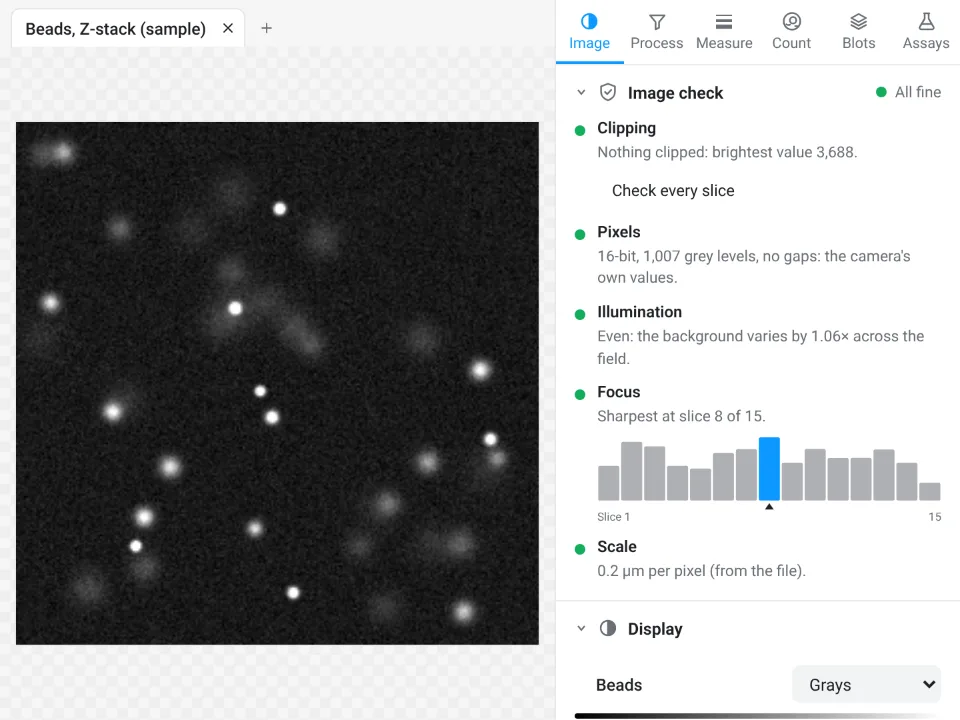
That is the same synthetic bead stack, which is built in as the Z-stack sample. The image check agrees with ImageJ: its brightest value is 3,688, the maximum of ImageJ's Max projection, and it marks slice 8 as the sharpest.
Why it is a good choice for projections:
- Nothing to install: it runs in the browser on any computer or tablet.
- ImageJ's six projection types under the same names, plus orthogonal views, substacks and a player.
- An image check flags clipped pixels on every slice, uneven light and the sharpest slice before you project.
- Projection, measurement, Send to Graphs and Add to a figure are free with a LabCanvas account (downloading the projected TIFF is part of Pro); every measurement is checked in more than 4,000 automated tests.
Stacks in a maker's format (.czi, .nd2, .lif) need exporting to TIFF or OME-TIFF first, which Fiji does through Bio-Formats (see opening CZI and ND2 files), and Fiji remains the place for 3D object analysis and rendering. Open Image Analysis.
ImageJ and Fiji are independent open-source projects; LabCanvas is not affiliated with them.
References
- Schneider CA, Rasband WS, Eliceiri KW (2012). NIH Image to ImageJ: 25 years of image analysis. Nature Methods 9, 671–675. doi:10.1038/nmeth.2089
- Schindelin J, Arganda-Carreras I, Frise E, et al. (2012). Fiji: an open-source platform for biological-image analysis. Nature Methods 9, 676–682. doi:10.1038/nmeth.2019
Frequently asked questions
How do I make a maximum intensity projection in ImageJ?
Open the Z-stack, choose Image › Stacks › Z Project…, set Start slice and Stop slice, pick Max Intensity as the Projection type and click OK. A new image named MAX_ followed by the stack name opens, with the brightest value of each pixel through the slices.
Should I use Max or Sum projection for quantification?
Sum Slices when you need the total signal of objects that extend through several slices, such as whole cells or nuclei, after subtracting the background of every slice. Max Intensity is for showing structure and for point-like objects; it ignores how thick an object is and raises the background.
Why is my Sum projection 32-bit?
Adding 15 slices of a 16-bit image can exceed 65,535, so ImageJ returns Sum Slices as a 32-bit image. In ImageJ 1.54f, Standard Deviation and Median also came out 32-bit on our 16-bit stack, while Max, Min and Average stayed 16-bit.
What is the difference between Z Project and Orthogonal Views?
Z Project collapses the stack into one 2D image, losing depth. Orthogonal Views (Image › Stacks › Orthogonal Views, Ctrl Shift H) keeps the stack and shows side views (XZ and YZ) through the point you click, so you can see where in depth things are.
Can I project only some slices?
Yes. Set Start slice and Stop slice in the Z Project dialog. Leave out slices above and below the cell, which add only background and out-of-focus haze, and use the same range for every stack you compare.
How do I Z project a time-lapse Z-stack?
For a hyperstack with several time points, the Z Project dialog adds an All time frames box: tick it to get one projection per time point. For a plain stack, Image › Stacks › Tools › Grouped Z Project projects every group of n slices.
Try it in LabCanvas
Every app is free to start in your browser. Create an account and begin.
Start Image Analysis free in your browserKeep reading

ImageJ vs LabCanvas Image Analysis: an honest comparison
ImageJ/Fiji or LabCanvas Image Analysis? Six everyday jobs done in both, six newer ones (macros, vendor files, 3D, StarDist, big images) and which to use.

How to use ImageJ: a beginner's tutorial for the 10 everyday jobs (2026)
How to use ImageJ and Fiji: get started, open an image, then 10 everyday jobs (scale, measure, threshold, count, background, blots) with exact menu paths.

How to set the scale and add a scale bar in ImageJ (with a calibration image to practise on)
Set the scale in ImageJ (Analyze › Set Scale) from a micrometer, scale bar or pixel size, add a scale bar, and practise on a free calibration image.